
IMAGING IN BENIGN HEPATIC MASSES PRESENTOR Dr Navni
IMAGING IN BENIGN HEPATIC MASSES PRESENTOR : Dr Navni Garg MODERATOR : Dr Sonal Krishan SEMINAR JUNE 26, 2014
n n n Focal liver lesion is by definition a discrete abnormality arising within the liver Features of intra hepatic lesion Most of the lesion within the liver with respiration Bulging of the liver capsule Displacement and distortion of the portal and hepatic vessels Post displacement of IVC
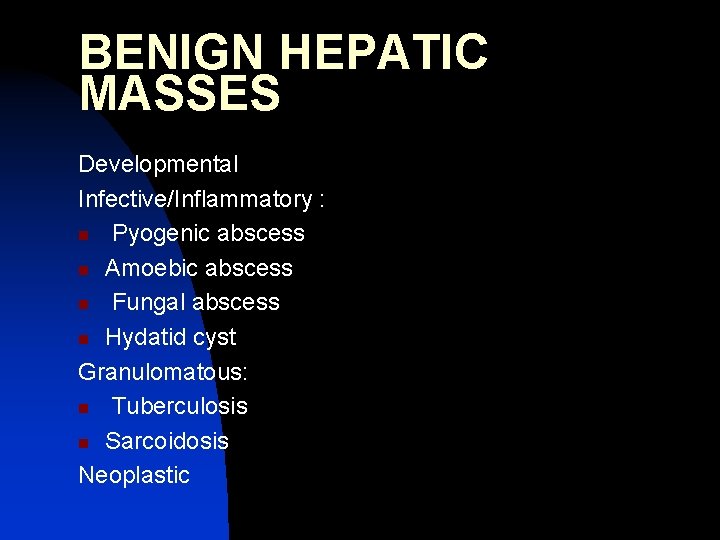
BENIGN HEPATIC MASSES Developmental Infective/Inflammatory : n Pyogenic abscess n Amoebic abscess n Fungal abscess n Hydatid cyst Granulomatous: n Tuberculosis n Sarcoidosis Neoplastic
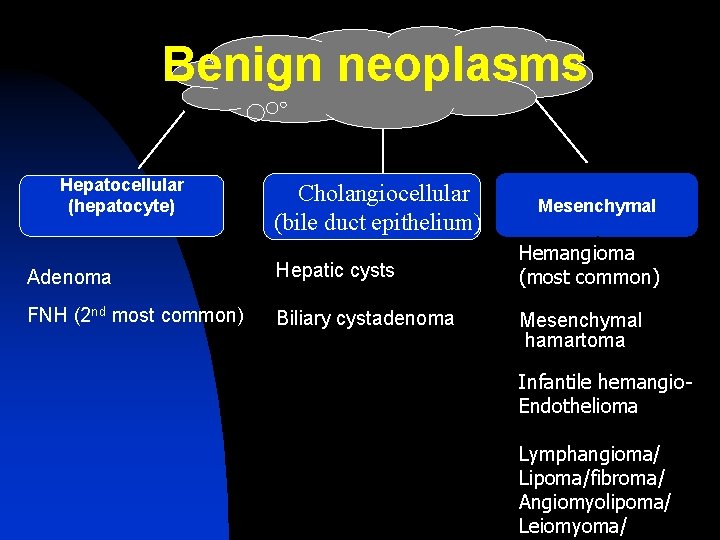
Benign neoplasms Hepatocellular (hepatocyte) Cholangiocellular (bile duct epithelium) Adenoma Hepatic cysts FNH (2 nd most common) Biliary cystadenoma Mesenchymal Hemangioma (most common) Mesenchymal hamartoma Infantile hemangio. Endothelioma Lymphangioma/ Lipoma/fibroma/ Angiomyolipoma/ Leiomyoma/
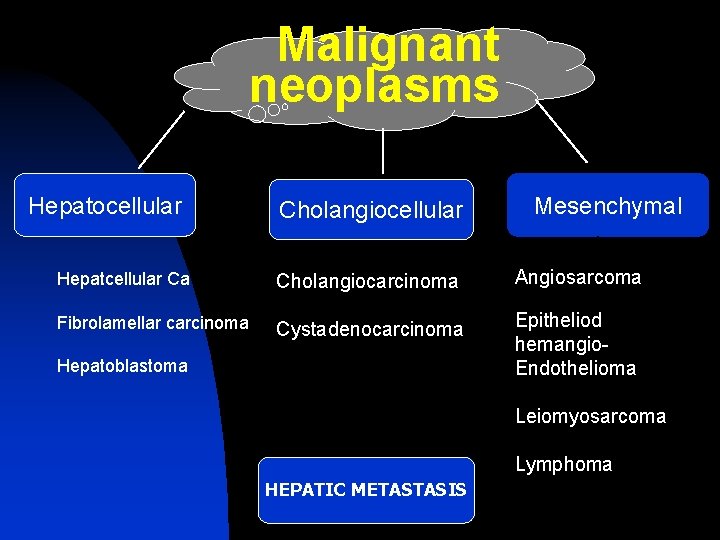
Malignant neoplasms Hepatocellular Cholangiocellular Mesenchymal Hepatcellular Ca Cholangiocarcinoma Angiosarcoma Fibrolamellar carcinoma Cystadenocarcinoma Epitheliod hemangio. Endothelioma Hepatoblastoma Leiomyosarcoma Lymphoma HEPATIC METASTASIS
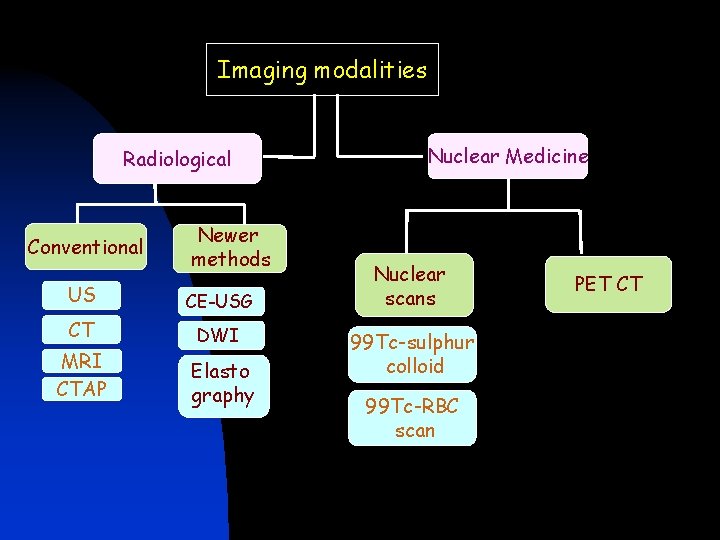
Imaging modalities Radiological Conventional Newer methods US CE-USG CT DWI MRI CTAP Elasto graphy Nuclear Medicine Nuclear scans 99 Tc-sulphur colloid 99 Tc-RBC scan PET CT
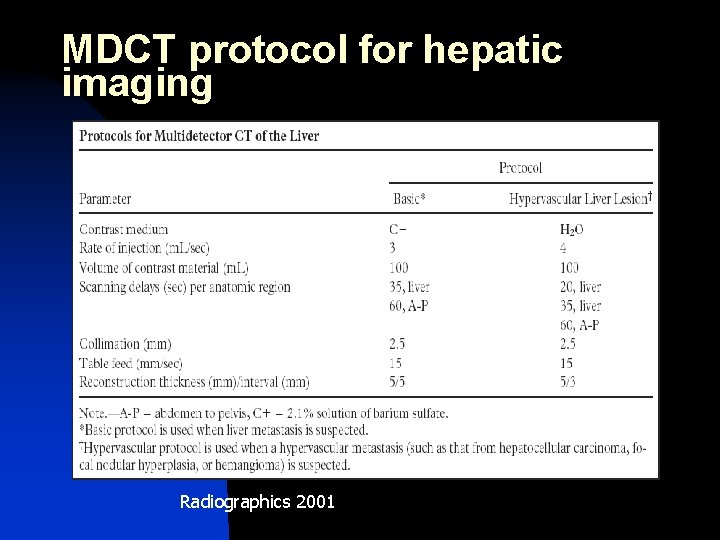
MDCT protocol for hepatic imaging Radiographics 2001
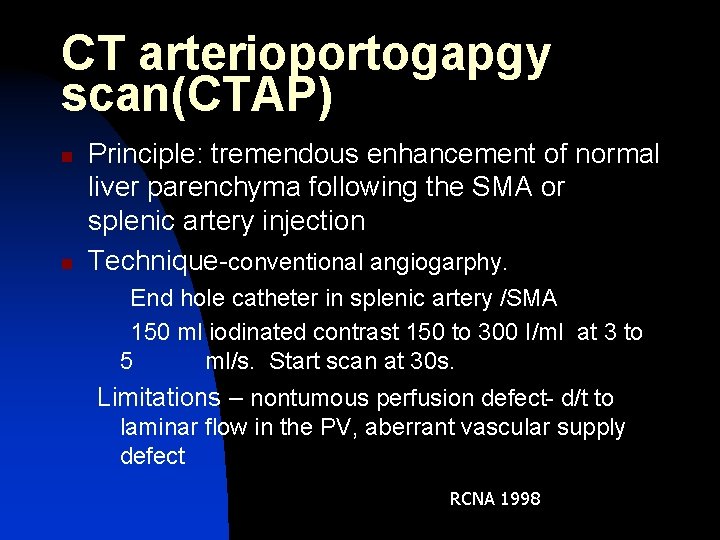
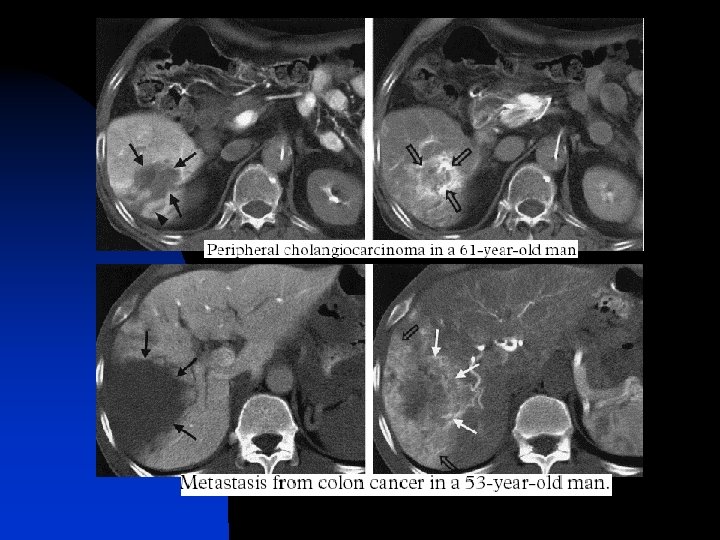
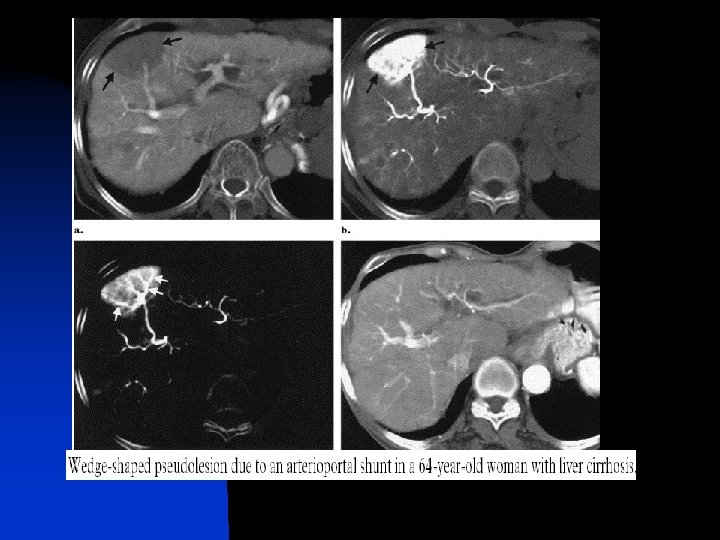
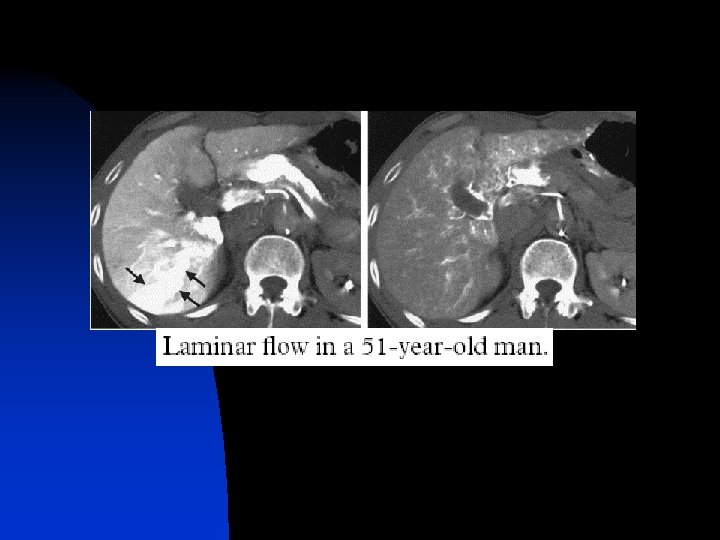
CT arterioportogapgy scan(CTAP) n n Principle: tremendous enhancement of normal liver parenchyma following the SMA or splenic artery injection Technique-conventional angiogarphy. End hole catheter in splenic artery /SMA 150 ml iodinated contrast 150 to 300 I/ml at 3 to 5 ml/s. Start scan at 30 s. Limitations – nontumous perfusion defect- d/t to laminar flow in the PV, aberrant vascular supply defect RCNA 1998
CT arterioportogapgy scan(CTAP) n n most sensitive technique for detection of focal hepatic neoplasm. Sensitivity 80 -90% for metastasis and 70% for primary malignant neoplasm. higher sensitivity for smaller liver SOL. Disadvantage-low specificity, cost and need for the invasive procedure. Replacement with GD and ferumoxide enhanced MRI may be reasonable. RCNA 1998
CT hepatic angiography scan n Principle: all hepatic neoplasm are largely supplied by the hepatic artery. n Technique: angiographic catheter is placed in common hepatic artery. Scan delay 3 -5 s of contrast injection. 70 ml of diluted iodinated 15 -30 % at 2 ml/s. n Applications. use full in combination with the CTAP scan for characterizing the lesions and for characterization of portal perfusion defect. RCNA 1998
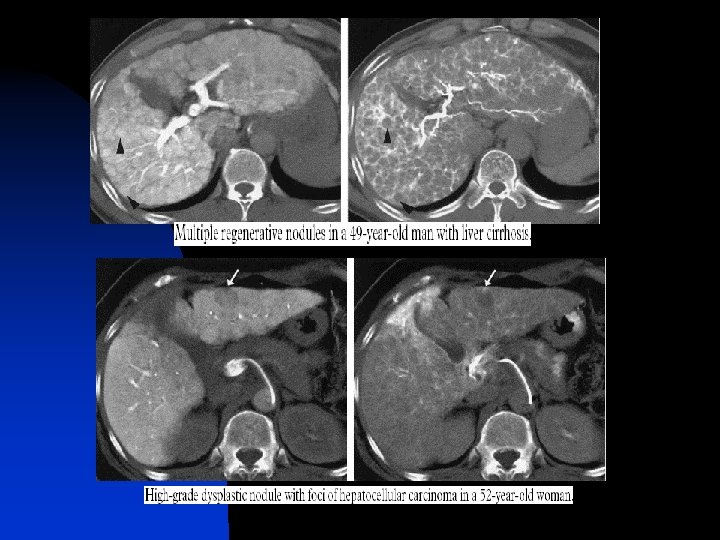
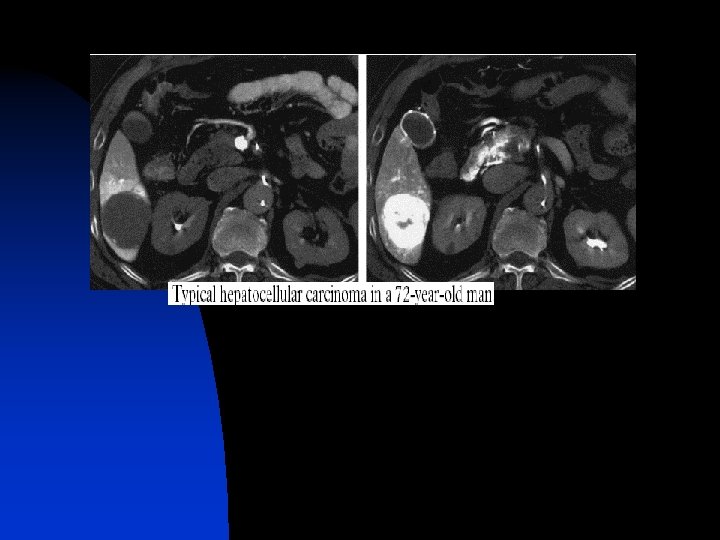
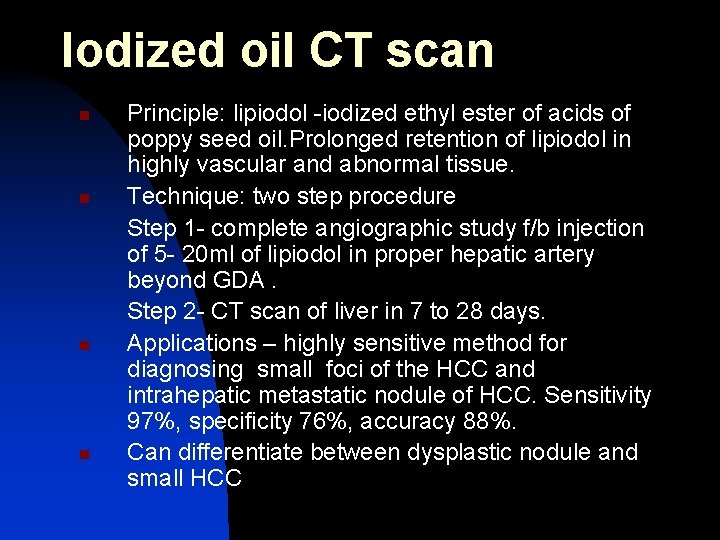
Iodized oil CT scan n n Principle: lipiodol -iodized ethyl ester of acids of poppy seed oil. Prolonged retention of lipiodol in highly vascular and abnormal tissue. Technique: two step procedure Step 1 - complete angiographic study f/b injection of 5 - 20 ml of lipiodol in proper hepatic artery beyond GDA. Step 2 - CT scan of liver in 7 to 28 days. Applications – highly sensitive method for diagnosing small foci of the HCC and intrahepatic metastatic nodule of HCC. Sensitivity 97%, specificity 76%, accuracy 88%. Can differentiate between dysplastic nodule and small HCC
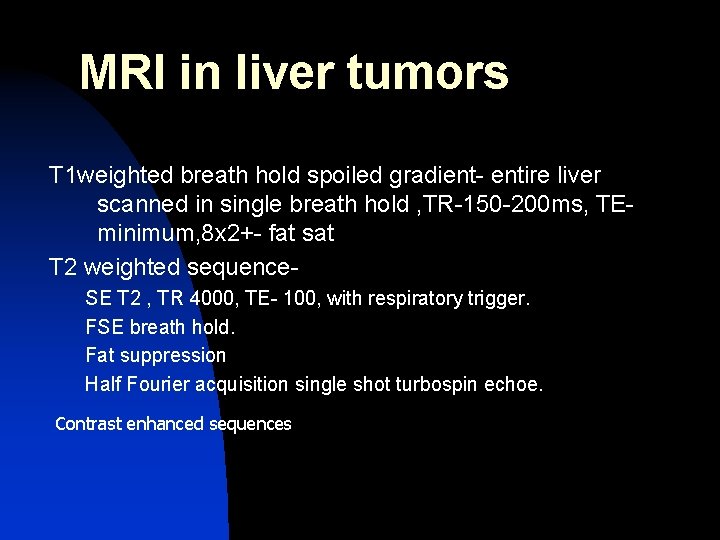
MRI in liver tumors T 1 weighted breath hold spoiled gradient- entire liver scanned in single breath hold , TR-150 -200 ms, TEminimum, 8 x 2+- fat sat T 2 weighted sequence. SE T 2 , TR 4000, TE- 100, with respiratory trigger. FSE breath hold. Fat suppression Half Fourier acquisition single shot turbospin echoe. Contrast enhanced sequences
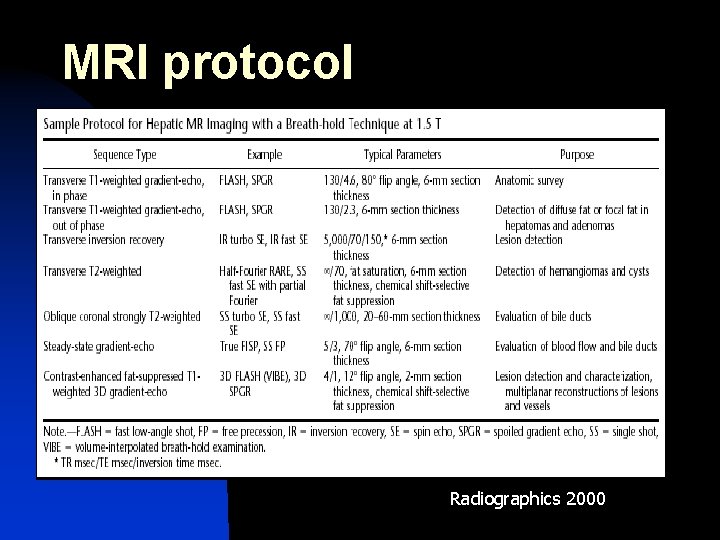
MRI protocol Radiographics 2000
MRI CONTRAST AGENTS IN LIVER IMAGING
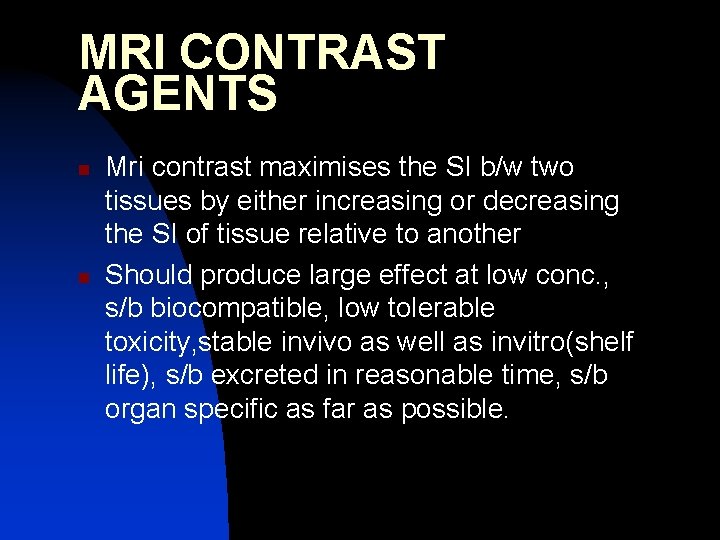
MRI CONTRAST AGENTS n n Mri contrast maximises the SI b/w two tissues by either increasing or decreasing the SI of tissue relative to another Should produce large effect at low conc. , s/b biocompatible, low tolerable toxicity, stable invivo as well as invitro(shelf life), s/b excreted in reasonable time, s/b organ specific as far as possible.
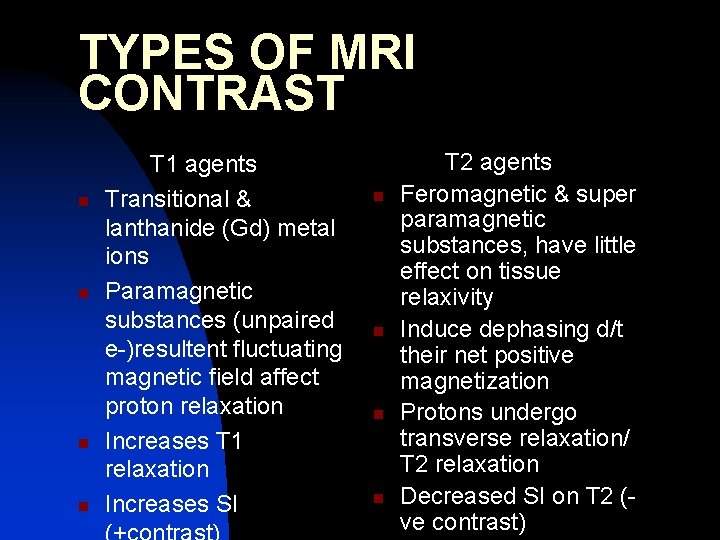
TYPES OF MRI CONTRAST n n T 1 agents Transitional & lanthanide (Gd) metal ions Paramagnetic substances (unpaired e-)resultent fluctuating magnetic field affect proton relaxation Increases T 1 relaxation Increases SI n n T 2 agents Feromagnetic & super paramagnetic substances, have little effect on tissue relaxivity Induce dephasing d/t their net positive magnetization Protons undergo transverse relaxation/ T 2 relaxation Decreased SI on T 2 (ve contrast)
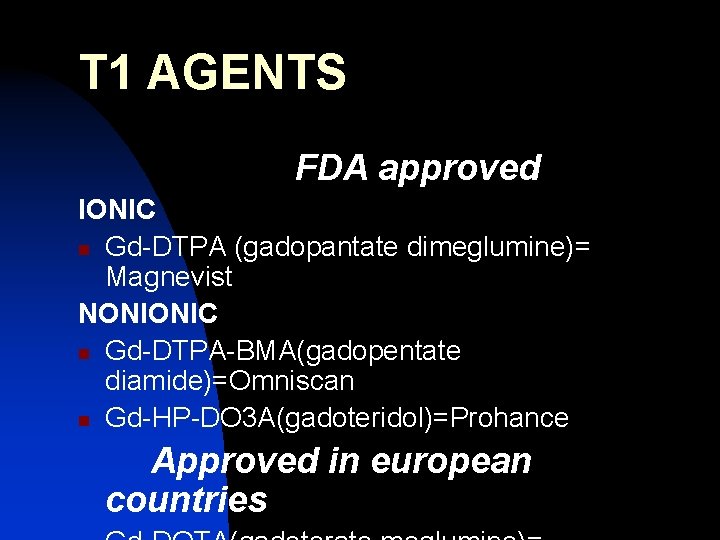
T 1 AGENTS FDA approved IONIC n Gd-DTPA (gadopantate dimeglumine)= Magnevist NONIONIC n Gd-DTPA-BMA(gadopentate diamide)=Omniscan n Gd-HP-DO 3 A(gadoteridol)=Prohance Approved in european countries
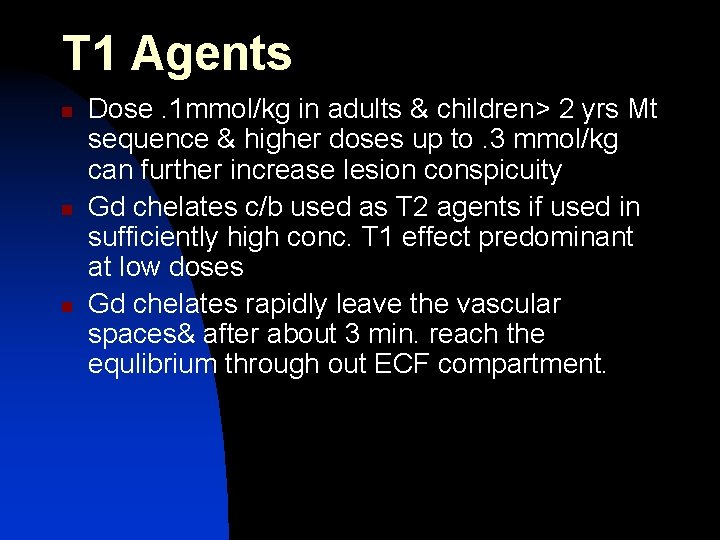
T 1 Agents n n n Dose. 1 mmol/kg in adults & children> 2 yrs Mt sequence & higher doses up to. 3 mmol/kg can further increase lesion conspicuity Gd chelates c/b used as T 2 agents if used in sufficiently high conc. T 1 effect predominant at low doses Gd chelates rapidly leave the vascular spaces& after about 3 min. reach the equlibrium through out ECF compartment.
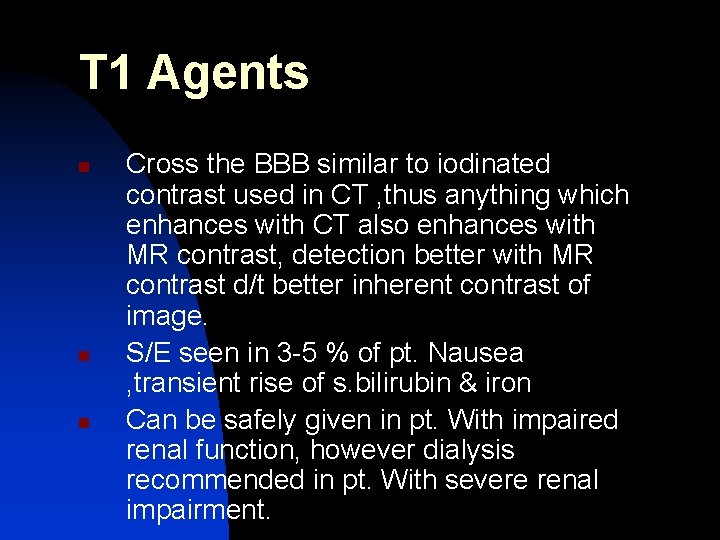
T 1 Agents n n n Cross the BBB similar to iodinated contrast used in CT , thus anything which enhances with CT also enhances with MR contrast, detection better with MR contrast d/t better inherent contrast of image. S/E seen in 3 -5 % of pt. Nausea , transient rise of s. bilirubin & iron Can be safely given in pt. With impaired renal function, however dialysis recommended in pt. With severe renal impairment.
ORGAN & TISSUE DIRECTED CONTRASTAGENTS 1. 2. 3. 4. Liver specific Hepatobilliary agents GI contrast Blood pool agents
LIVER SPECIFIC AGENTS n n n T 2 agents/-ve contrast/RES agents Coated iron oxide particles of various sizes. Phagocytosed by RES of liver, spleen, BM, LN. Normal liver looses SI on T 2 agents, Focal liver lesions like mets which do not contain kupffer cell c/b better seen. More specific the accumulation of agent in target tissue better the result & lesion tissue contrast SPIO (Ferum oxide/AMI-25, Magnetite/ Resovist/ SHU-555) & USPIO(AMI-227).
SPIO (super Paramagnetic iron oxide) (50+- 19 nm) 1. Ferum oxide (Feridex/ AMI-25) n FDA approved n RES clears it (T 1/2=8 min. ) n Liver t 1/2=2 -3 days n Dose 10 -15 micro gm/kg n Slow infusion over 30 min. (pre & post contrast imaging inconvenience) n S/E back ache, hypo tension (skilled personnel & resuscitation equipment s/b available when ever ferum oxide is administered)
SPIO 2. Magnetite/resovit/SHU-555 n Phase III cl. trial n Dose =40 microgram(comparable to AMI 25) n Particle size 61 nm. n Max. hepatic signal loss in 10 min.
USPIO(ultra small SPIO) n n n Particle size 17 -20 nm Rapid infusion c/b given Small volume required S/E- back ache, hypo tension, flushing Taken up by normal & cirrhotic liver, FNH & adenoma, but excluded from HCC Clinical trials have not been reported.
USPIO n n n AMI-227 Blood t 1/2 long=200 hrs=blood pool agent T 2 - liver looses SI, BV dark Has gr. T 1 effect. T 1 -bright blood effect-delineates IV thrombus better. Good balance of. T 1 & T 2 effect, by bolus administration dynamic imaging of liver c/b done.
HEPATO BILLIARY AGENTS (T 1 agents) n n n Soluble paramagnetic molecule Substantial hepatic uptake & Prolonged hepatocyte retention, billiary ex. T 1 agent – preferential T 1 enhancement, beginning with in min & lasting for 2 hrs, imaging performed during window after renal clearance from blood & ECF
HEPATO BILLIARY AGENTS (T 1 agents) FDA APPROVED 1. Mangafodipir/Teslascan =Mn-DPDP(Mn dipyridoxal diphosphate) UNDER CLINICAL TRIAL 1. 2. Multihance = Gd-BOPTA (Benzyl oxy propionic tetra acetate)Gadobenate dimeglumine eovist = Gd-EOB-DTPA (gadoxitate)
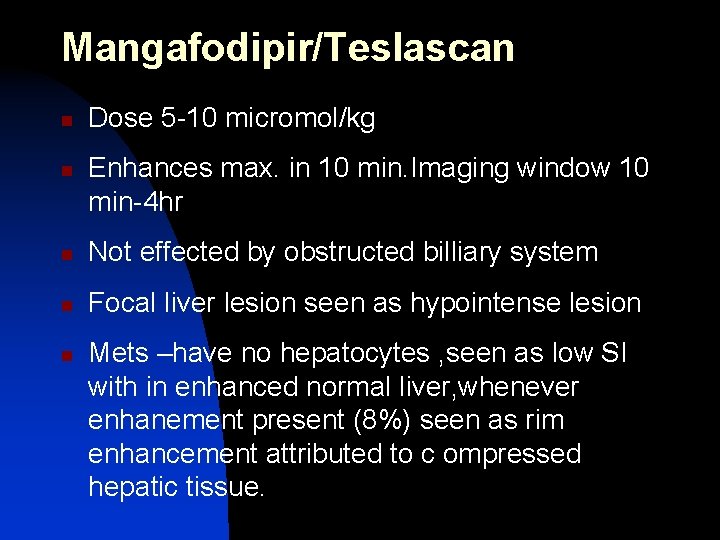
Mangafodipir/Teslascan n n Dose 5 -10 micromol/kg Enhances max. in 10 min. Imaging window 10 min-4 hr n Not effected by obstructed billiary system n Focal liver lesion seen as hypointense lesion n Mets –have no hepatocytes , seen as low SI with in enhanced normal liver, whenever enhanement present (8%) seen as rim enhancement attributed to c ompressed hepatic tissue.
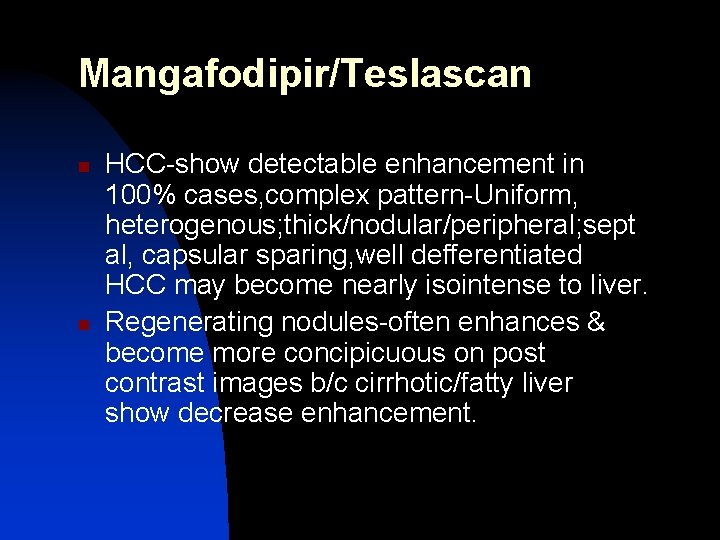
Mangafodipir/Teslascan n n HCC-show detectable enhancement in 100% cases, complex pattern-Uniform, heterogenous; thick/nodular/peripheral; sept al, capsular sparing, well defferentiated HCC may become nearly isointense to liver. Regenerating nodules-often enhances & become more concipicuous on post contrast images b/c cirrhotic/fatty liver show decrease enhancement.
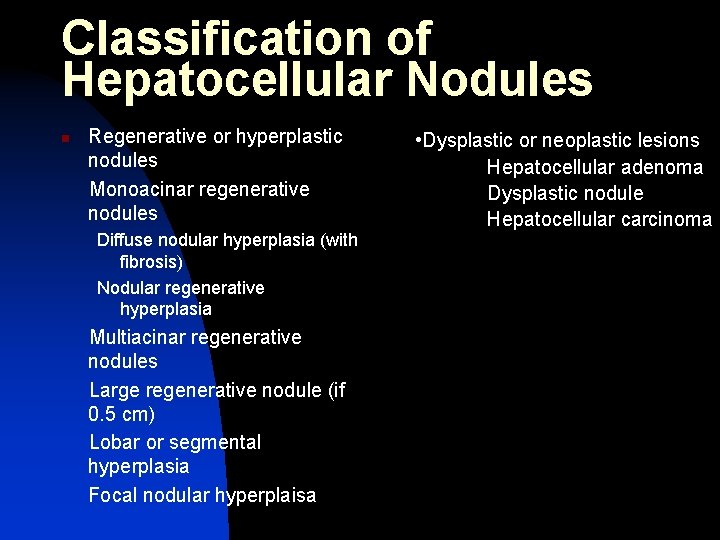
Classification of Hepatocellular Nodules n Regenerative or hyperplastic nodules Monoacinar regenerative nodules Diffuse nodular hyperplasia (with fibrosis) Nodular regenerative hyperplasia Multiacinar regenerative nodules Large regenerative nodule (if 0. 5 cm) Lobar or segmental hyperplasia Focal nodular hyperplaisa • Dysplastic or neoplastic lesions Hepatocellular adenoma Dysplastic nodule Hepatocellular carcinoma
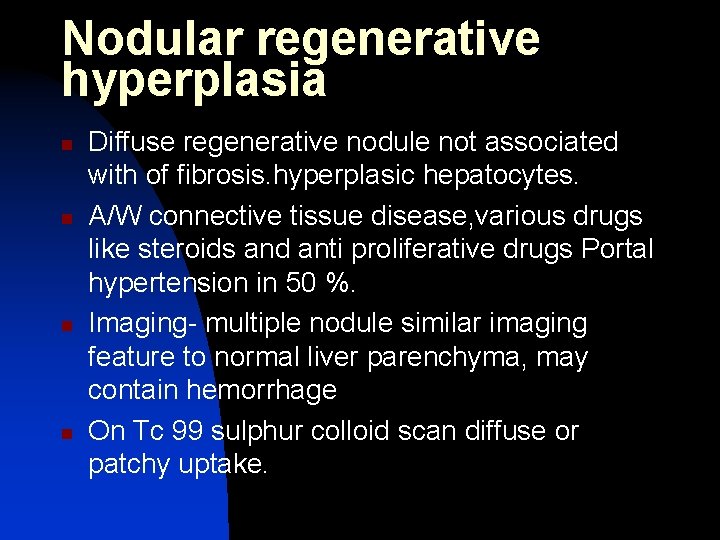
Nodular regenerative hyperplasia n n Diffuse regenerative nodule not associated with of fibrosis. hyperplasic hepatocytes. A/W connective tissue disease, various drugs like steroids and anti proliferative drugs Portal hypertension in 50 %. Imaging- multiple nodule similar imaging feature to normal liver parenchyma, may contain hemorrhage On Tc 99 sulphur colloid scan diffuse or patchy uptake.
n n n USG : iso to liver with asso portal HTN findings CT : non enhancing multiple hypo nodules. Hmg may occur MRI : hyper on T 1 and hypo on T 2
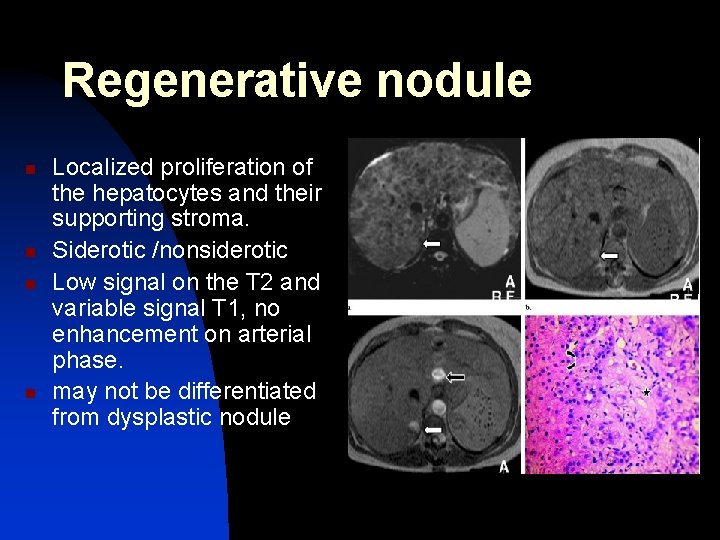
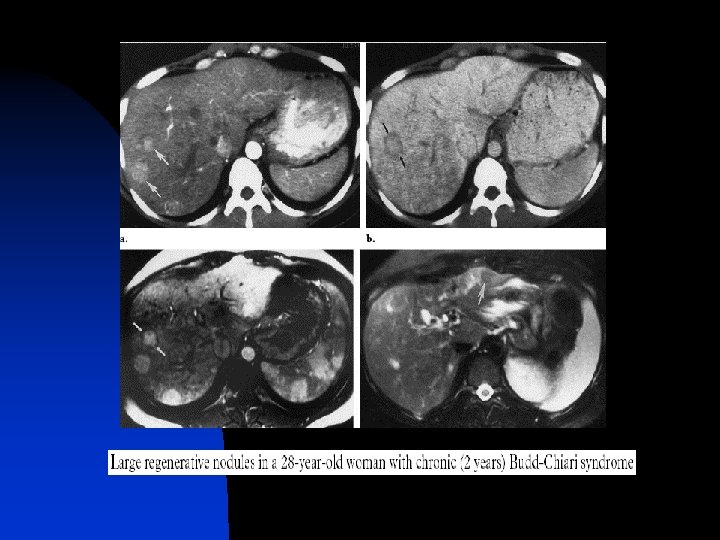
Regenerative nodule n n Localized proliferation of the hepatocytes and their supporting stroma. Siderotic /nonsiderotic Low signal on the T 2 and variable signal T 1, no enhancement on arterial phase. may not be differentiated from dysplastic nodule
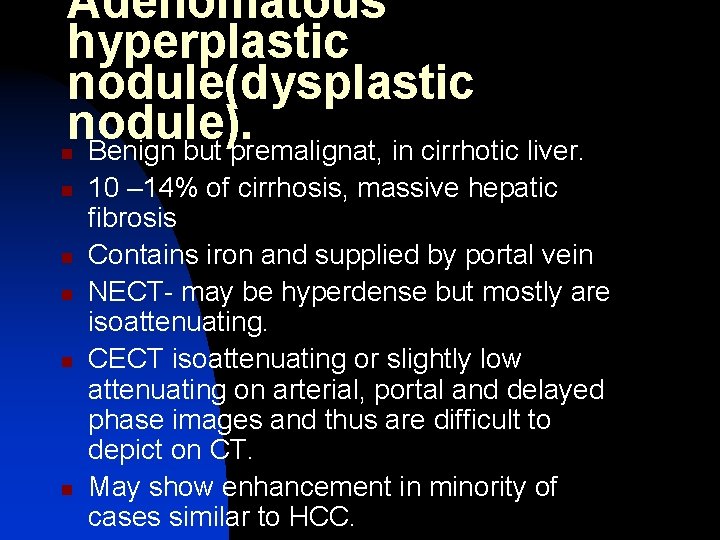
Adenomatous hyperplastic nodule(dysplastic nodule). Benign but premalignat, in cirrhotic liver. n n n 10 – 14% of cirrhosis, massive hepatic fibrosis Contains iron and supplied by portal vein NECT- may be hyperdense but mostly are isoattenuating. CECT isoattenuating or slightly low attenuating on arterial, portal and delayed phase images and thus are difficult to depict on CT. May show enhancement in minority of cases similar to HCC.
Adenomatous hyperplastic nodule(dysplastic nodule n n MRI- hyperintense on T 1 w and hypointense on T 2, Nodule with in nodule on T 2 s/o HCC CT arterioportography- to differentiat AHN& HCC supplied by hepatic artery so enhances on CTAP whereas dysplastic nodule is supplied by portal vein
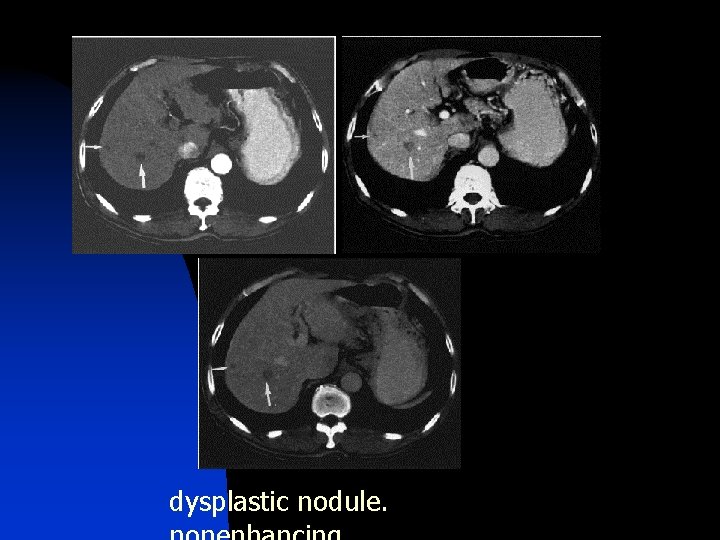
dysplastic nodule.
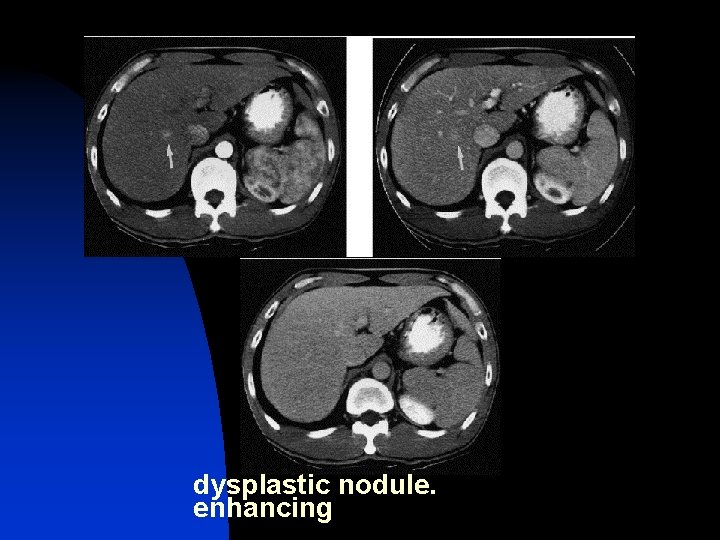
dysplastic nodule. enhancing
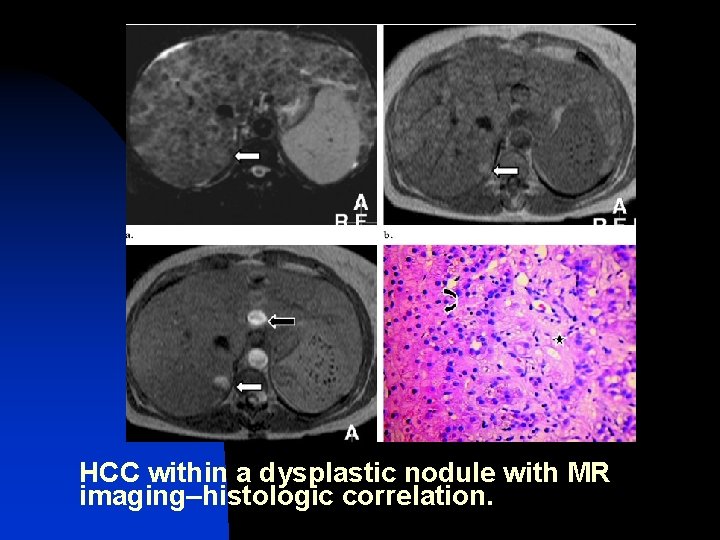
HCC within a dysplastic nodule with MR imaging–histologic correlation.
FNH • Second MC benign lesion • F>M , 3 rd to 5 th decade • 2% primary tumors in children • Congenital vascular malformation -> hyperplasia of hepatocytes • Kupffer’s cell activity seen • Well circumscribed , non encapsulated mass with central scar surrounded by nodules of hyperplastic hepatocytes and kupffer cells • No hmg or necrosis Radio. Graphics 2010
n n May be present on liver surface, nodules due to AVM May be pedunculated Rt lobe > lt lobe > 7 cm in children
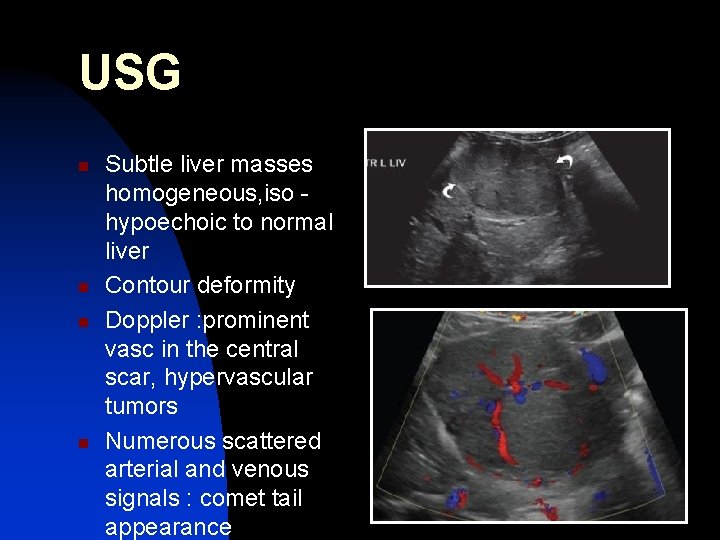
USG n n Subtle liver masses homogeneous, iso hypoechoic to normal liver Contour deformity Doppler : prominent vasc in the central scar, hypervascular tumors Numerous scattered arterial and venous signals : comet tail appearance
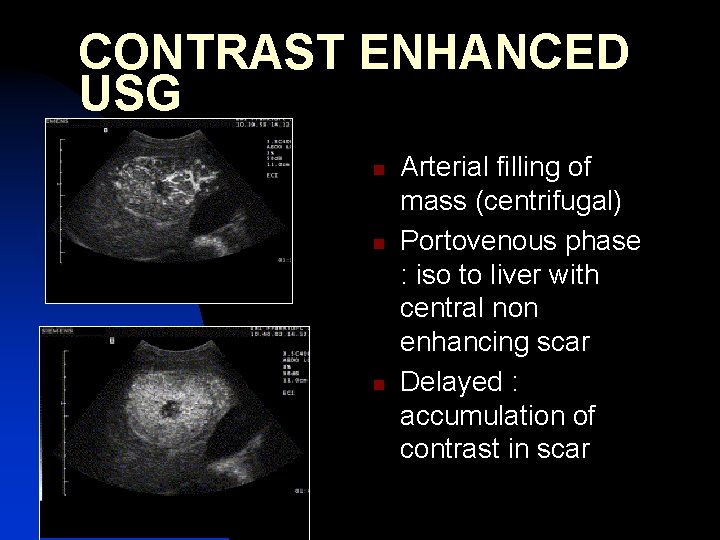
CONTRAST ENHANCED USG n n n Arterial filling of mass (centrifugal) Portovenous phase : iso to liver with central non enhancing scar Delayed : accumulation of contrast in scar
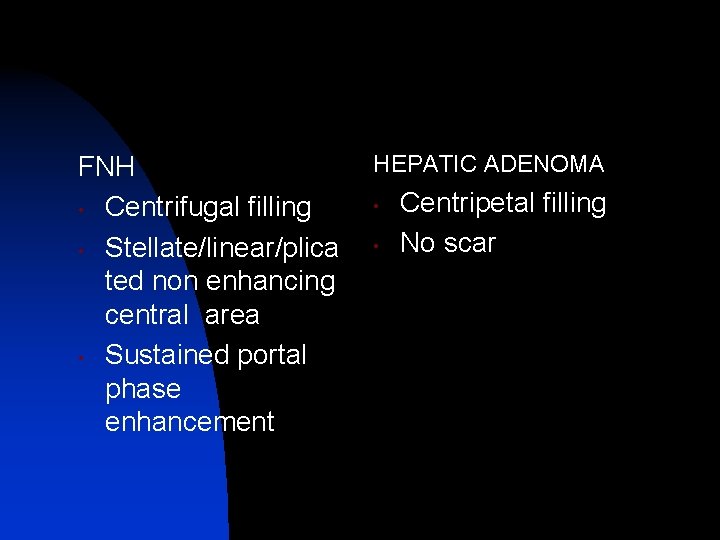
FNH • Centrifugal filling • Stellate/linear/plica ted non enhancing central area • Sustained portal phase enhancement HEPATIC ADENOMA • • Centripetal filling No scar
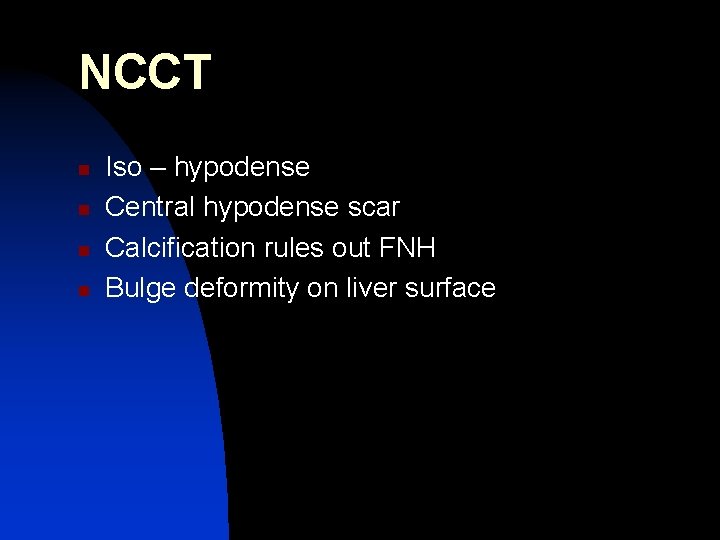
NCCT n n Iso – hypodense Central hypodense scar Calcification rules out FNH Bulge deformity on liver surface
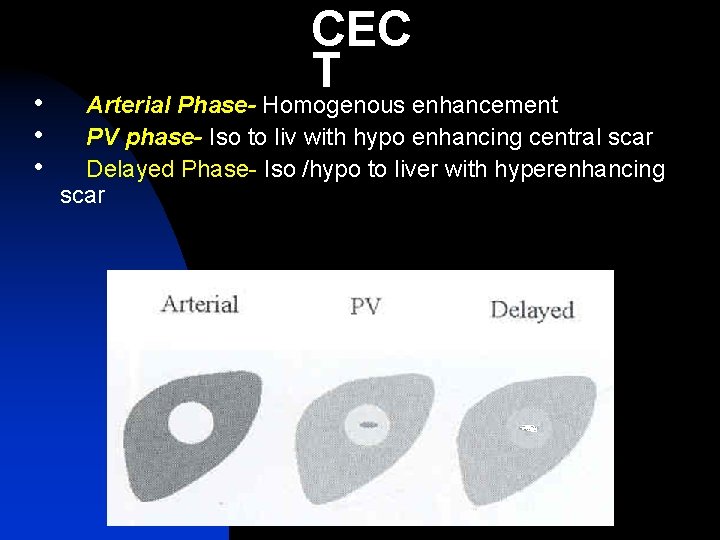
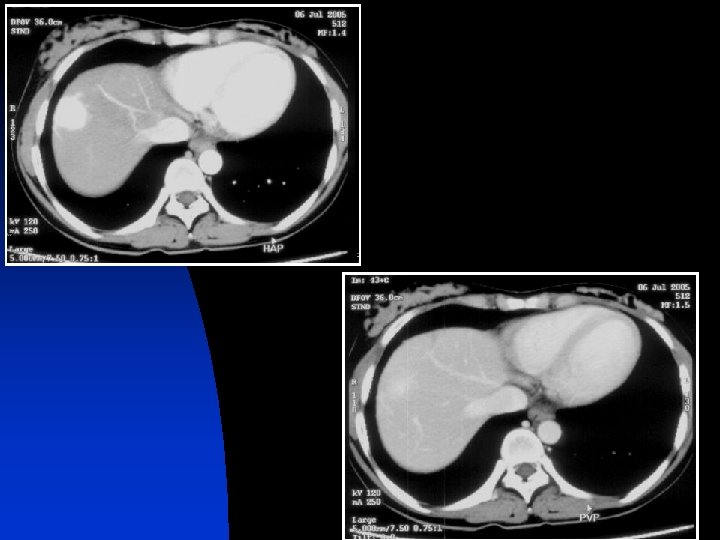
• • • CEC T Arterial Phase- Homogenous enhancement PV phase- Iso to liv with hypo enhancing central scar Delayed Phase- Iso /hypo to liver with hyperenhancing scar
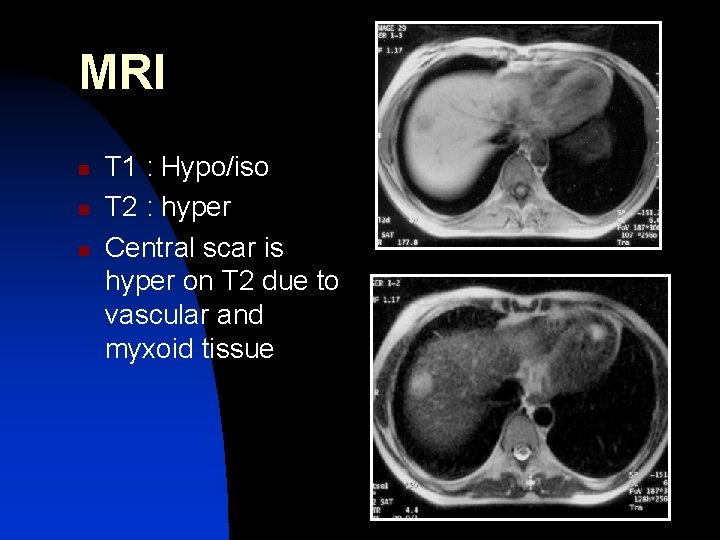
MRI n n n T 1 : Hypo/iso T 2 : hyper Central scar is hyper on T 2 due to vascular and myxoid tissue
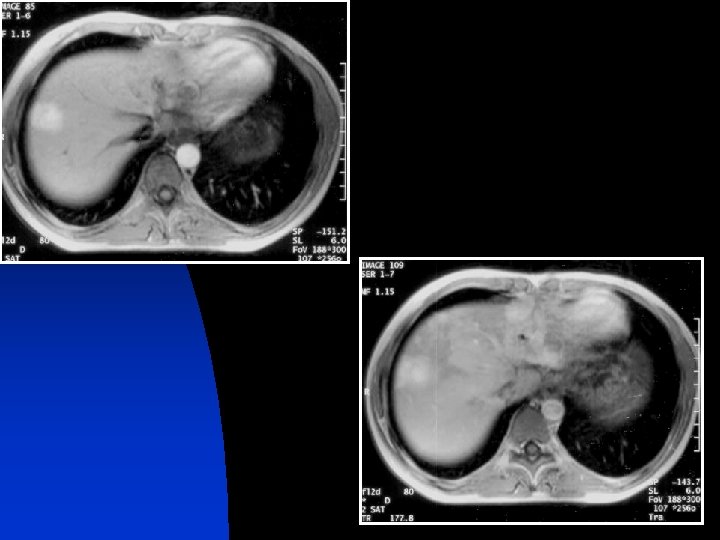
CEMRI n n Homogeneous enhancement with rapid washout to isointensity with surrounding liver tissue Scar shows delayed and persistent enhancement
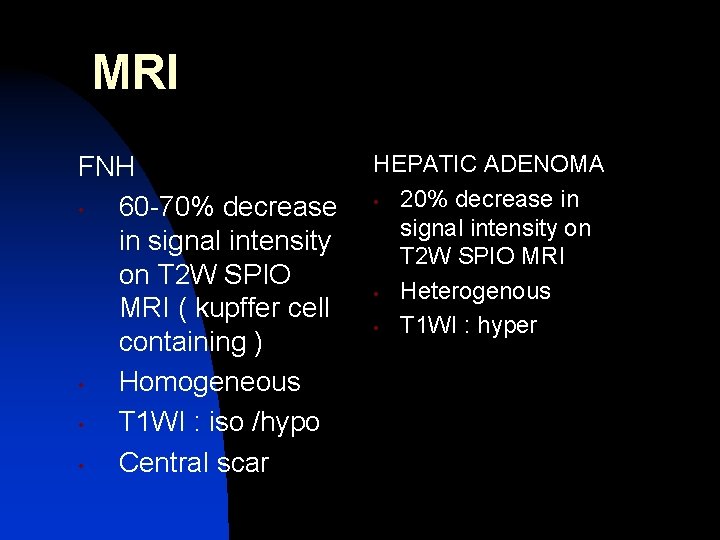
MRI FNH • 60 -70% decrease in signal intensity on T 2 W SPIO MRI ( kupffer cell containing ) • Homogeneous • T 1 WI : iso /hypo • Central scar HEPATIC ADENOMA • 20% decrease in signal intensity on T 2 W SPIO MRI • Heterogenous • T 1 WI : hyper
n n Sulphur colloid scan : hot spot Angiography : hypervascular mass possessing centrifugal or spoke wheel pattern with dense tumor blush in capillary , portal venous phase
HEPATOCELLULAR ADENOMA • Rare • Usually solitary, > 10 cm • 30 -50 y F> M • Association with oral contraceptives, anabolic steroid intake and GSD type I & III • Lacks portal tracts and terminal hepatic veins -> necrosis, hemorrhage, and rupture common in large tumors B. Op de Beeck et al. : European Journal of Radiology(1999)
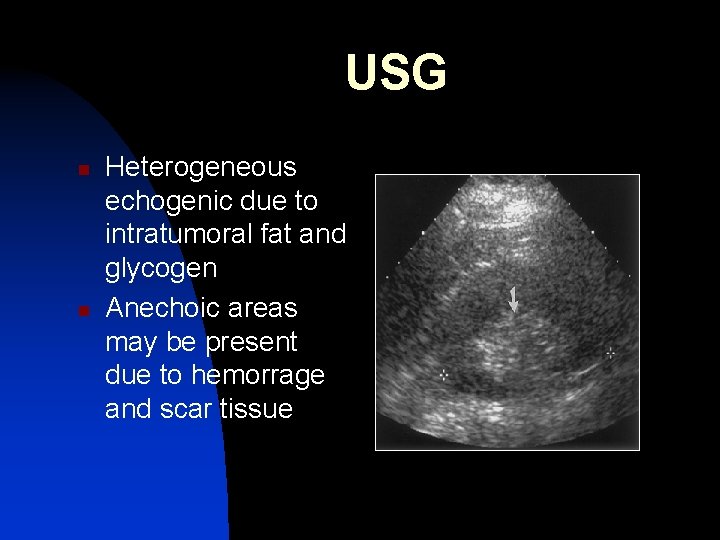
USG n n Heterogeneous echogenic due to intratumoral fat and glycogen Anechoic areas may be present due to hemorrage and scar tissue
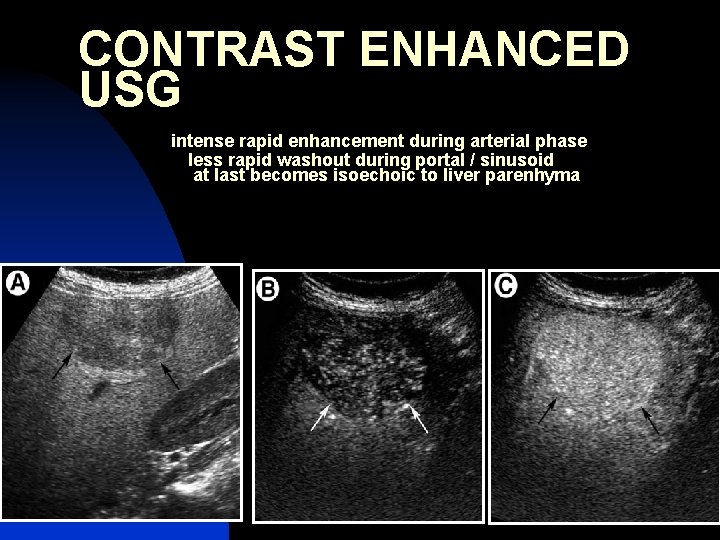
CONTRAST ENHANCED USG intense rapid enhancement during arterial phase less rapid washout during portal / sinusoid at last becomes isoechoic to liver parenhyma
n n Discrete perilesional feeding arteries manifest as enhancement around the tumor capsule Never seen in HCC
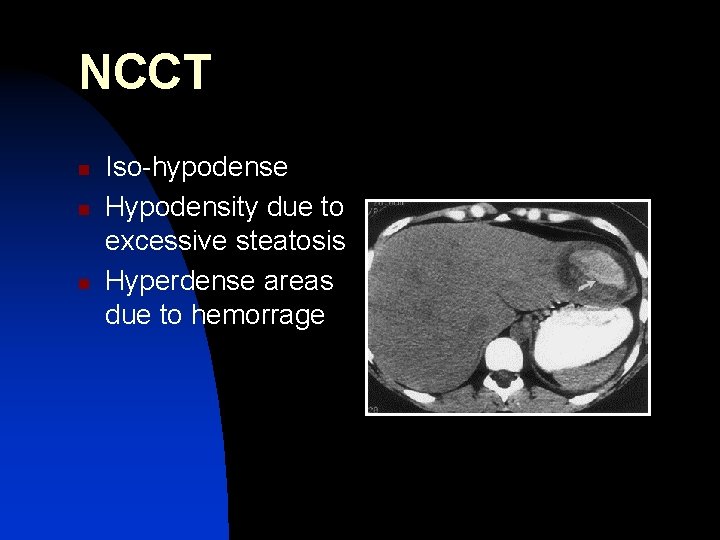
NCCT n n n Iso-hypodense Hypodensity due to excessive steatosis Hyperdense areas due to hemorrage
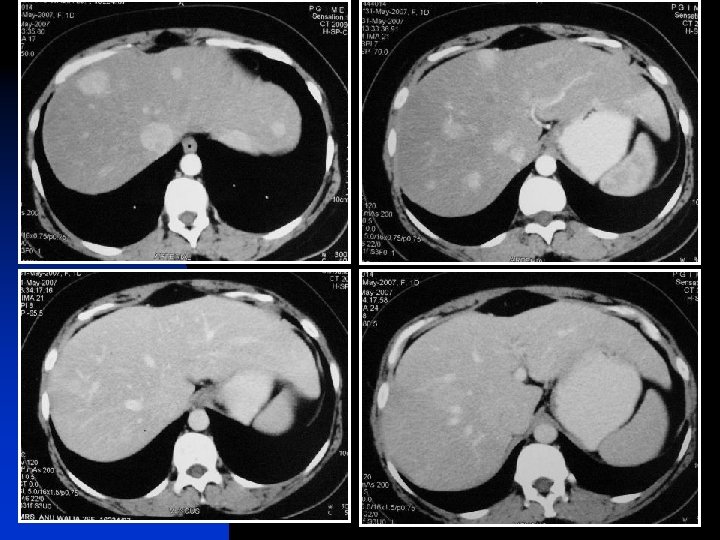
TRIPHASIC STUDY n n n ARTERIAL : HYPERDENSE PV : ISODENSE HV : HYPODENSE
• • Tc 99 sulphur colloid –cold spot in 80% as they lack kupffer cells MRI-iso to hyper on T 1 and T 2 due to fat and glycogen; capsule may be hypo on T 1 WI Enhancement similar to CT SPIO- variable signal loss
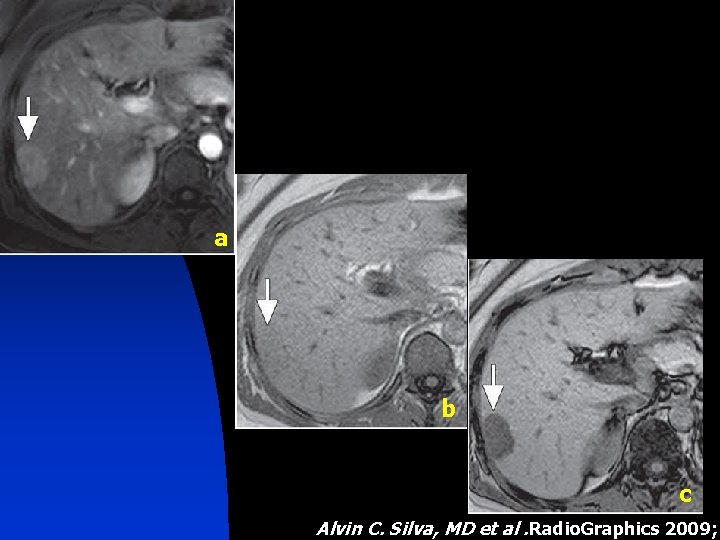
a b c Alvin C. Silva, MD et al. Radio. Graphics 2009;
HEPATIC SCINTIGRAPHY n Uptake seen which doesnot get excreted therefore delayed enhancement
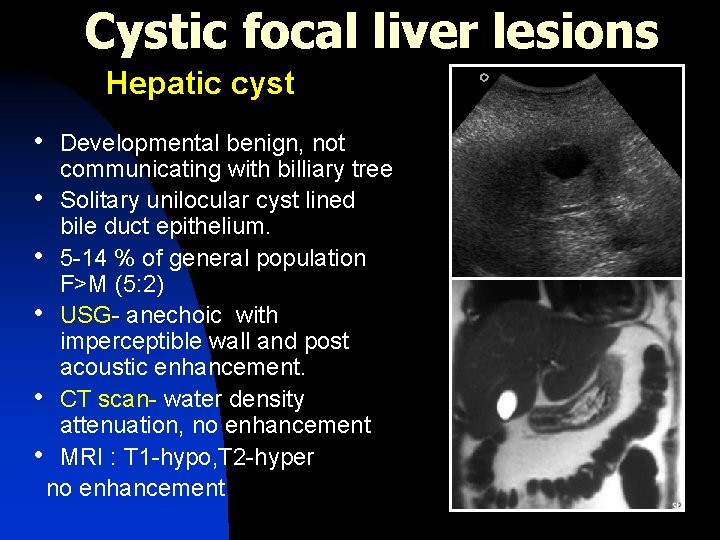
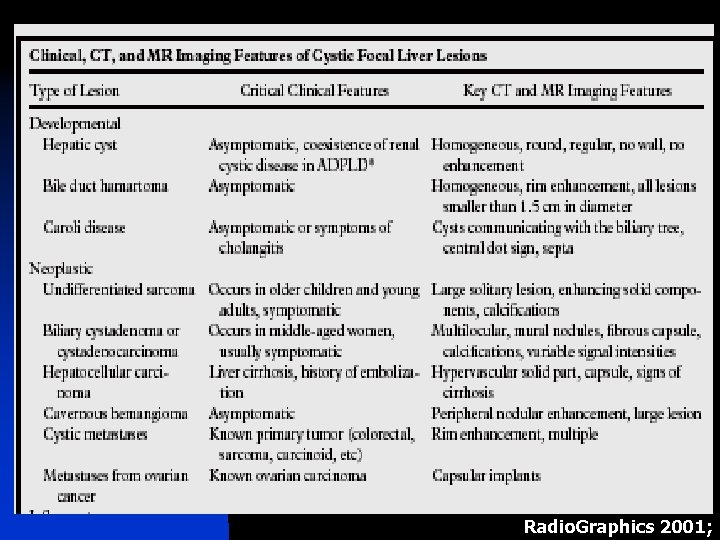
Cystic focal liver lesions Hepatic cyst • Developmental benign, not communicating with billiary tree • Solitary unilocular cyst lined bile duct epithelium. • 5 -14 % of general population F>M (5: 2) • USG- anechoic with imperceptible wall and post acoustic enhancement. • CT scan- water density attenuation, no enhancement • MRI : T 1 -hypo, T 2 -hyper no enhancement
D/D n n n Abscess Hydatid cyst Necrotic mets Hepatic cystadenocarcinoma Hematoma Intrahep GB
COMPLICATED CYST n n Because of hemorrage or infection in simple cyst USG : Presence of internal echoes, debris, thick septations, mural calcification or nodules CT : septations, internal debris and wall enhancement MRI : Hyper on both T 1, T 2 due to mixed blood products
PERIBILIARY CYST n n n Seen in pts with severe liver disease Small in size 0. 2 – 2. 5 cm Usually located centrally within porta hepatis or at the junction of the main right and left hep ducts Generally asymptomatic May rarely cause biliary obstruction Due to obstructed small periductal glands
n USG : discrete clustered cysts or tubular appearing parastructures having thin septa which parallel the bile ducts and portal veins
POLYCYSTIC LIVER DISEASE • • More than 10 simple hepatic cysts Surrounding parenchyma frequently contains von meyenburg’s complexes Associated with periductal fibrosis and bile duct proliferation – congenital fibropolycystic disease of liver Associated with autosomal dominant polycystic kidney disease in 70%
n n No corelation exists between severity of renal ds and extent of liver involvement LFTs normal
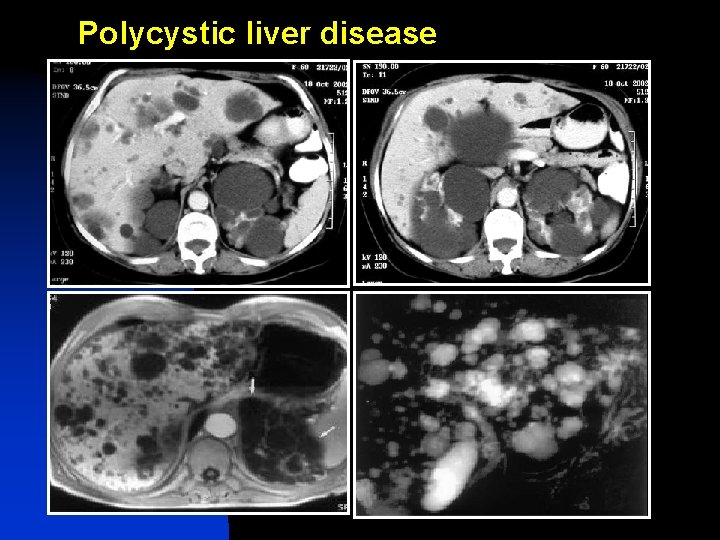
Polycystic liver disease
Biliary Cystadenoma • Slow growing multilocular cystic tumors • 85 % : intrahepatic ( 55% - right lobe, 29%- left lobe , 16% - both lobes) • F>M • May communicate with intrahepatic bile ducts and secrete mucinous material into the duct • Premalignant • Calcification rare • Avascular
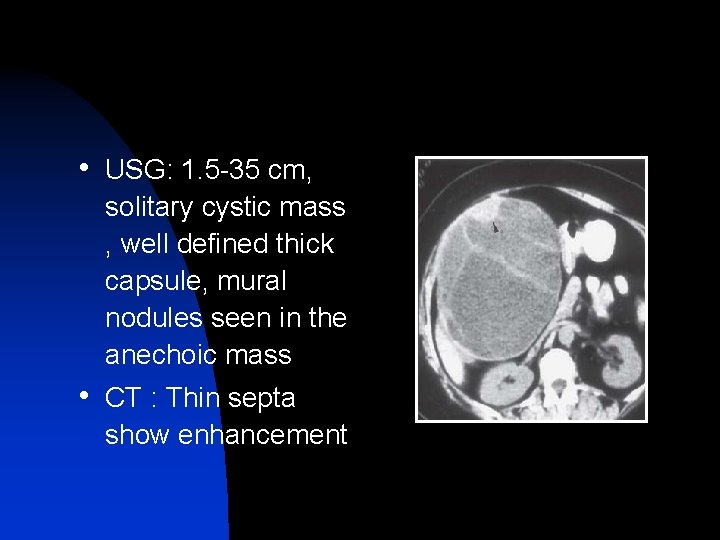
• USG: 1. 5 -35 cm, solitary cystic mass , well defined thick capsule, mural nodules seen in the anechoic mass • CT : Thin septa show enhancement
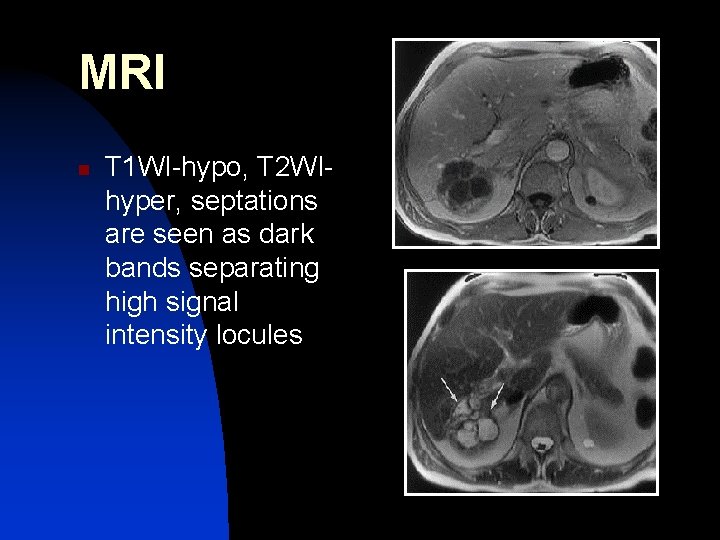
MRI n T 1 WI-hypo, T 2 WIhyper, septations are seen as dark bands separating high signal intensity locules
• ↑ CA 19 -9 and CEA in intracystic fluid of cystadenoma/ cystadenocarcinoma • Polypoid, pedunculated excrescences with coarse calcification in septa seen in cystadenocarcinoma
HEMANGIOMA • • MC benign lesion of liver 2 MC hepatic tumor after metastasis Prevalence -- 1– 2% to 20% (F: M= 2: 1– 5: 1) More common in right lobe of liver More common in subcapsular location/around intrahepatic vessels Blood filled vascular channels separated by thin fibrous septa lined by flat endothelium No kupffer cells
• XRAY ABDOMEN : multiple calcific phlebolith, numerous calcified trebaculations and spicules arising from central point and radiating towards periphery
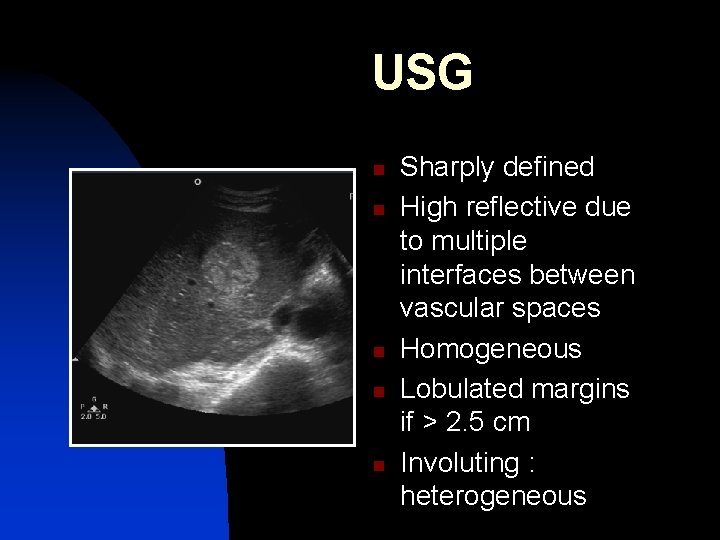
USG n n n Sharply defined High reflective due to multiple interfaces between vascular spaces Homogeneous Lobulated margins if > 2. 5 cm Involuting : heterogeneous
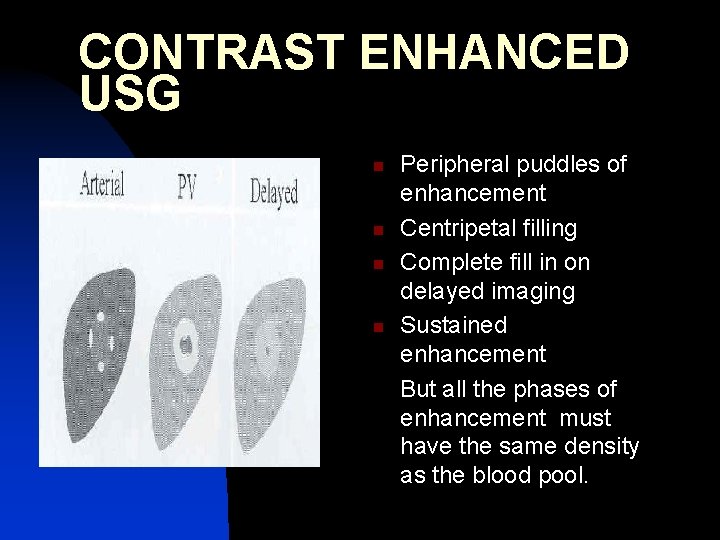
CONTRAST ENHANCED USG n n Peripheral puddles of enhancement Centripetal filling Complete fill in on delayed imaging Sustained enhancement But all the phases of enhancement must have the same density as the blood pool.
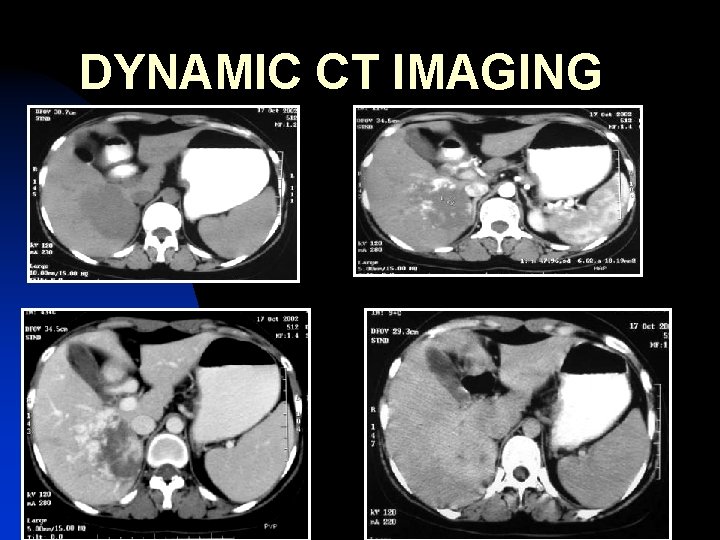
DYNAMIC CT IMAGING
FLASH HEMANGIOMAS n n n Small hemangiomas may show fast homogeneous enhancement ( flash filling) D/D : Small HCC , Hypervascular metastasis So look at all phases to see if the enhancing areas match the blood pool.
n n Hemangiomas have peripheral nodular, globular enhancement D/D : rim enhancement is continous peripheral enhancement seen in malignant lesions ( metastases)
MORPHOLOGY ON MRI n n n Sharp geographic margins Lack of peripheral halo on T 2 WI Lack of deformity of the liver surface Superficial location Lack of displacement of hepatic vessels
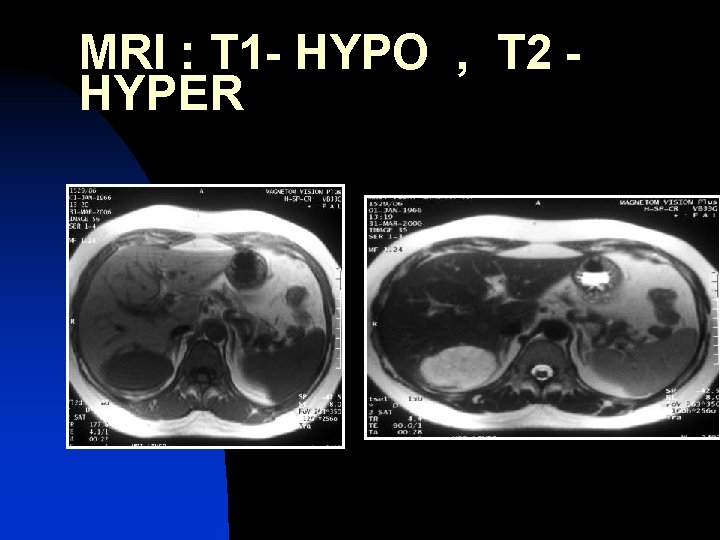
MRI : T 1 - HYPO , T 2 HYPER
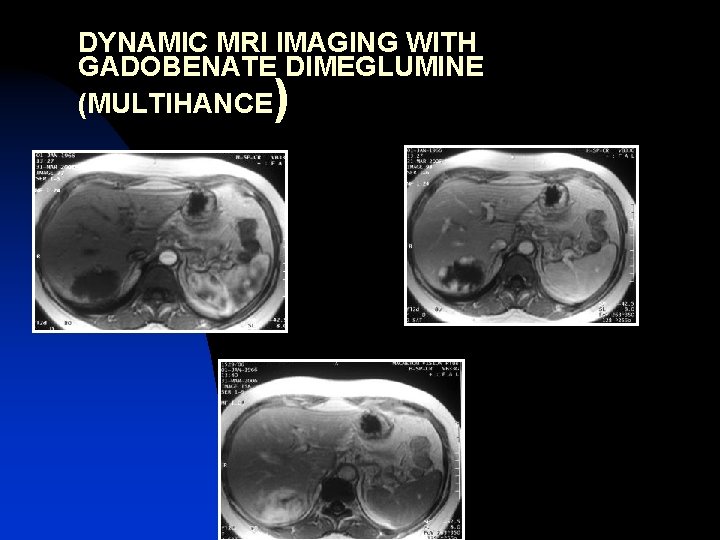
DYNAMIC MRI IMAGING WITH GADOBENATE DIMEGLUMINE (MULTIHANCE )
n n n Hemangioma with central fibrosis : hypointense on T 2 WI HCC and metastasis : hyperintense necrotic area on T 2 WI Giant hemangioma : heterogeneous on T 2 WI due to thrombosis, myxoid tissue, fibrosis. May show irregular flame shaped peripheral and central enhancement
RBC SCINTIGRAPHY n n Hot spot on delayed Tc 99 –RBC scan Scans are taken 1 -2 hours after injection of patient’s isotope labelled blood Progressive increase in ratio of blood pool activity within the hemangioma to that of surrounding liver because of retarded blood flow in vascular sinusoids Initial photopenia with hot nodule on delayed blood pool images
Angiography : Gold std n n Normal main and feeding vessels Early contrast accumulation within the lesion during the late arterial phase Persists throughout the venous phase : diagnostic Feeding vessels show crowding around the lesion
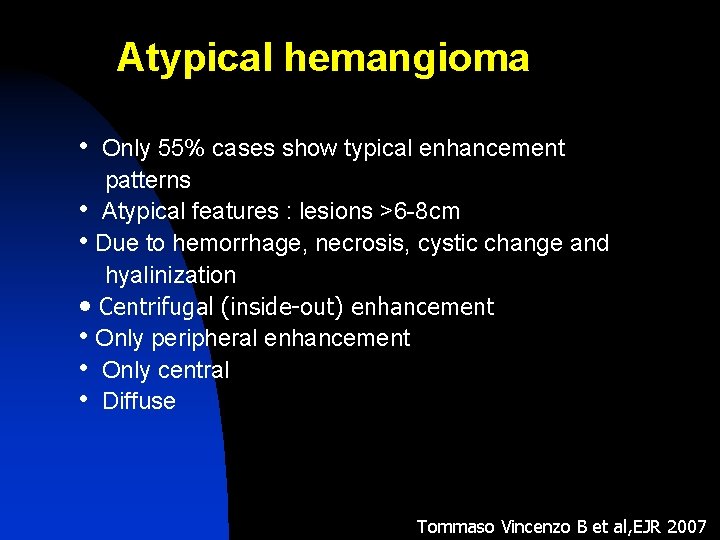
Atypical hemangioma • Only 55% cases show typical enhancement patterns • Atypical features : lesions >6 -8 cm • Due to hemorrhage, necrosis, cystic change and hyalinization • Centrifugal (inside-out) enhancement • Only peripheral enhancement • Only central • Diffuse Tommaso Vincenzo B et al, EJR 2007
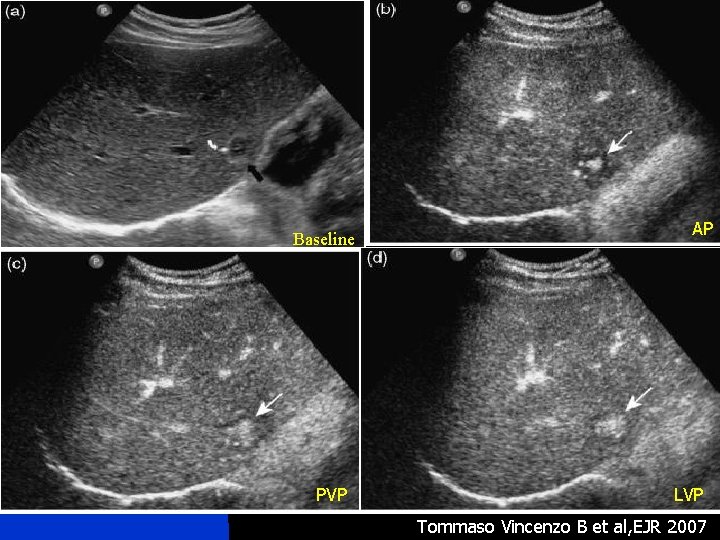
e Baseline PVP AP LVP Tommaso Vincenzo B et al, EJR 2007
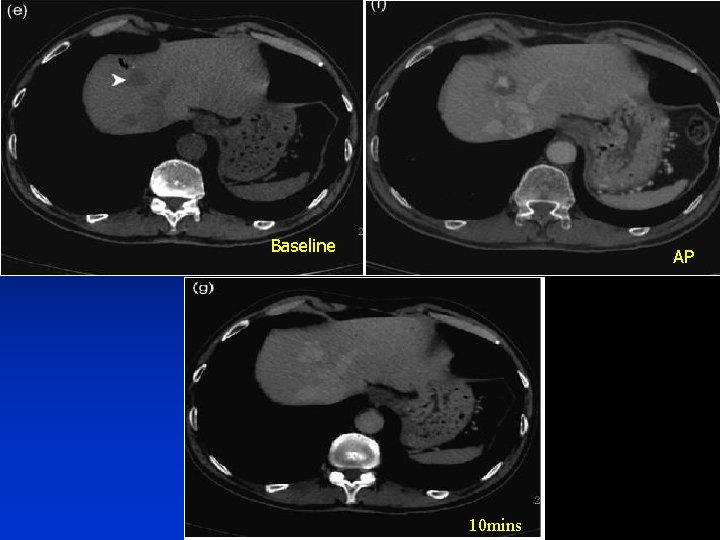
Baseline PVP AP 10 mins
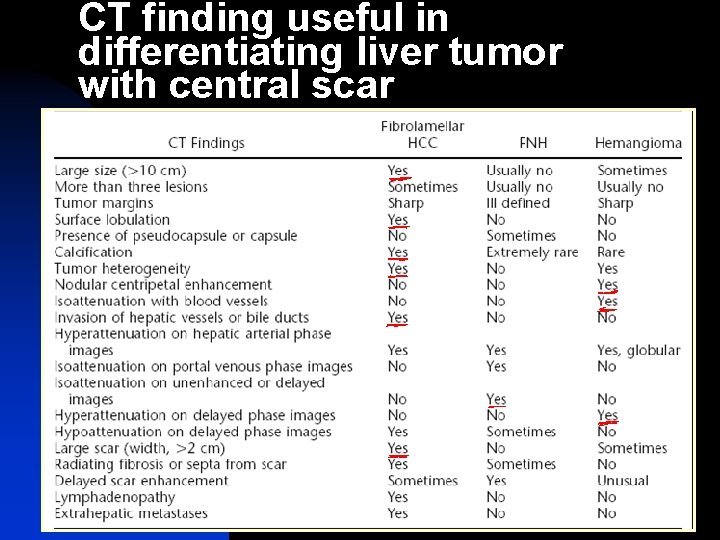
CT finding useful in differentiating liver tumor with central scar
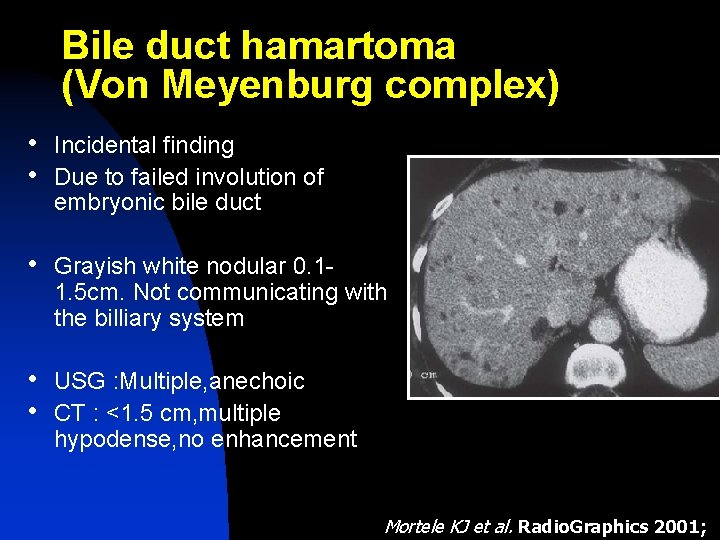
Bile duct hamartoma (Von Meyenburg complex) • Incidental finding • Due to failed involution of embryonic bile duct • Grayish white nodular 0. 1 - 1. 5 cm. Not communicating with the billiary system • USG : Multiple, anechoic • CT : <1. 5 cm, multiple hypodense, no enhancement Mortele KJ et al. Radio. Graphics 2001;
n On USG, bright echogenic foci with ring down artifacts occuring due to presence of cholesterol crystals withih dilated tubules
n n MRI : hypo on T 1 and hyper on T 2 Irregularly outlined. No enhancement/rim enhancement ( due to compressed liver parenchyma) MR CHOLANGIOGRAPHY : multiple, tiny, cystic lesions that donot communicate with biliary tree
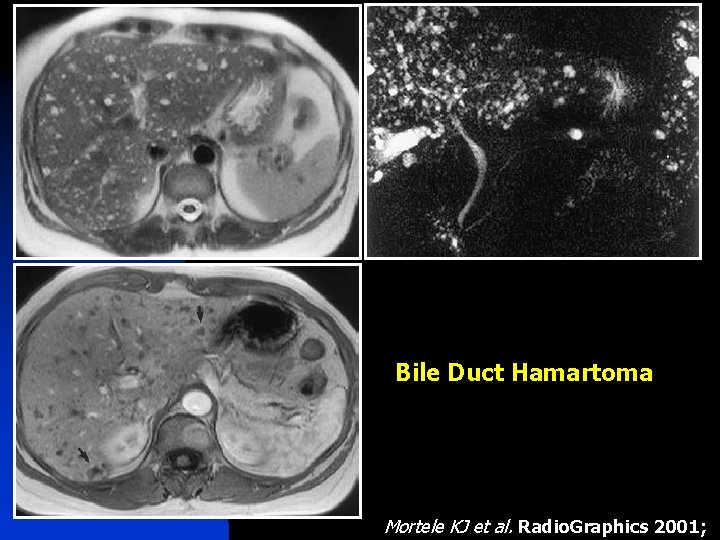
Bile Duct Hamartoma Mortele KJ et al. Radio. Graphics 2001;
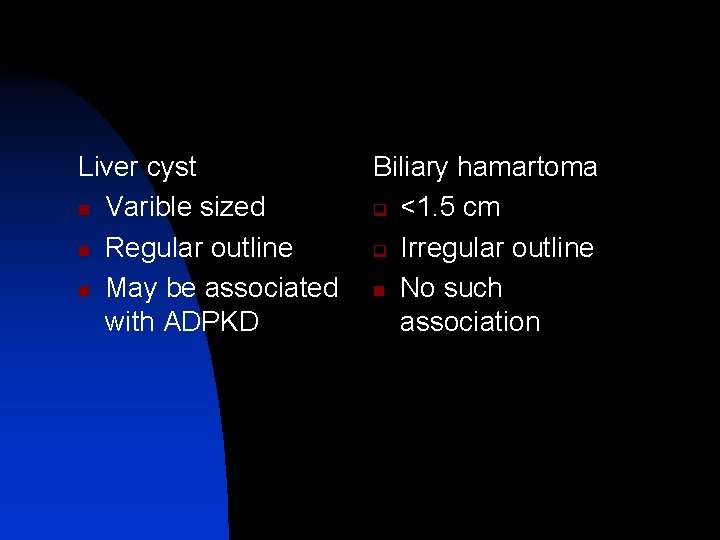
Liver cyst n Varible sized n Regular outline n May be associated with ADPKD Biliary hamartoma q <1. 5 cm q Irregular outline n No such association
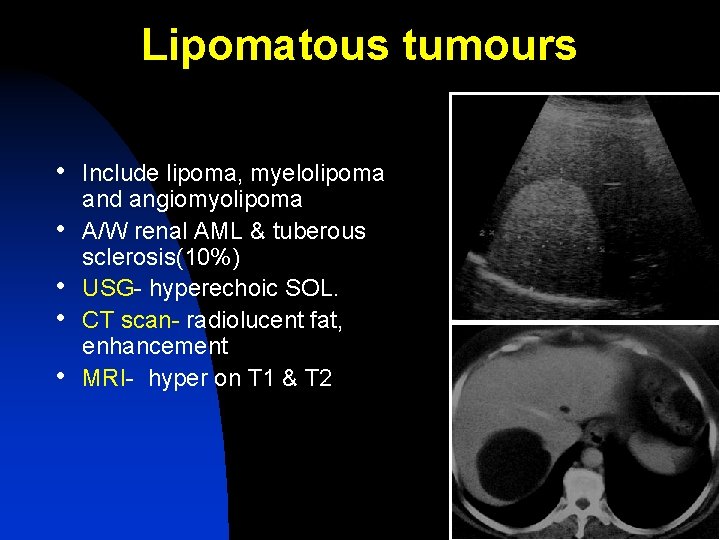
Lipomatous tumours • Include lipoma, myelolipoma • • and angiomyolipoma A/W renal AML & tuberous sclerosis(10%) USG- hyperechoic SOL. CT scan- radiolucent fat, enhancement MRI- hyper on T 1 & T 2
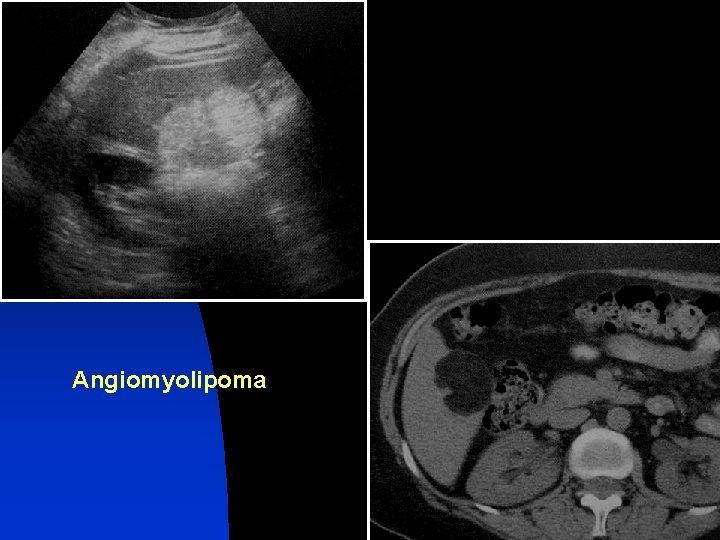
Angiomyolipoma
Focal inflammatory lesions • Abscesses • Hydatid cysts
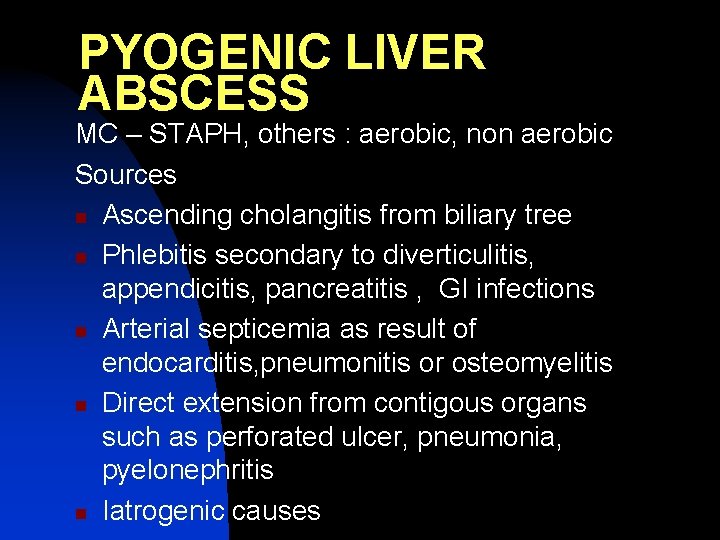
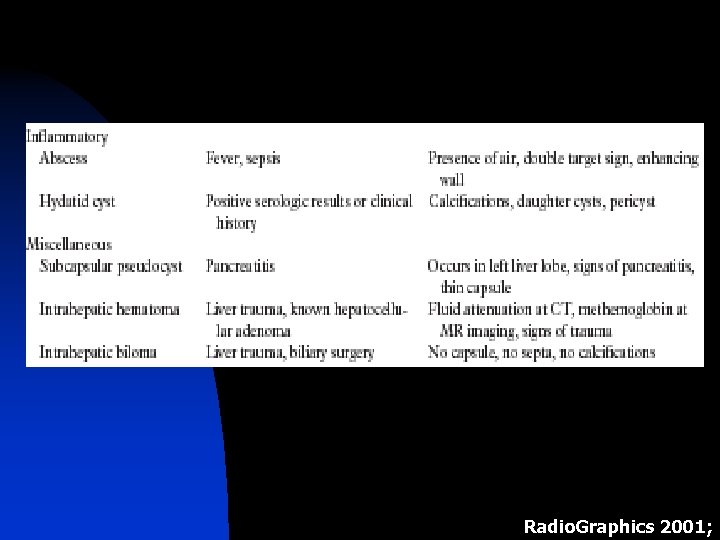
PYOGENIC LIVER ABSCESS MC – STAPH, others : aerobic, non aerobic Sources n Ascending cholangitis from biliary tree n Phlebitis secondary to diverticulitis, appendicitis, pancreatitis , GI infections n Arterial septicemia as result of endocarditis, pneumonitis or osteomyelitis n Direct extension from contigous organs such as perforated ulcer, pneumonia, pyelonephritis n Iatrogenic causes
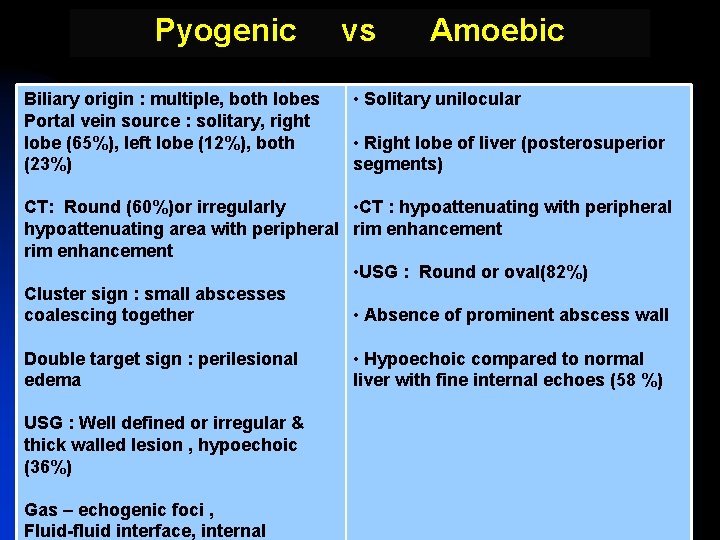
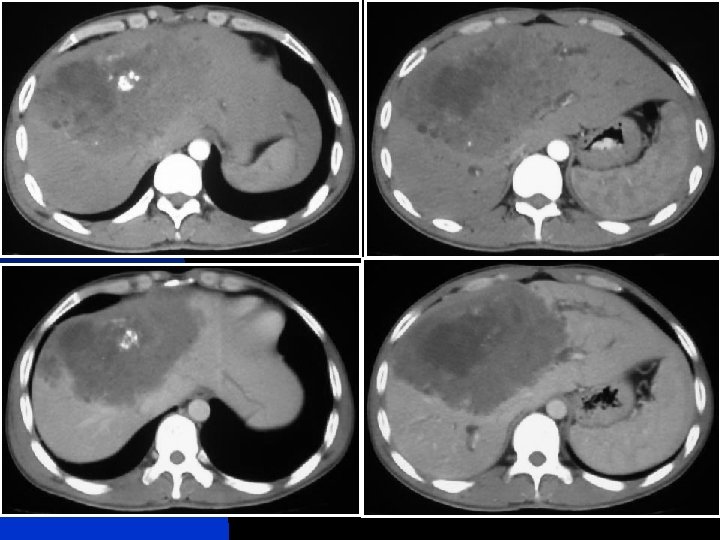
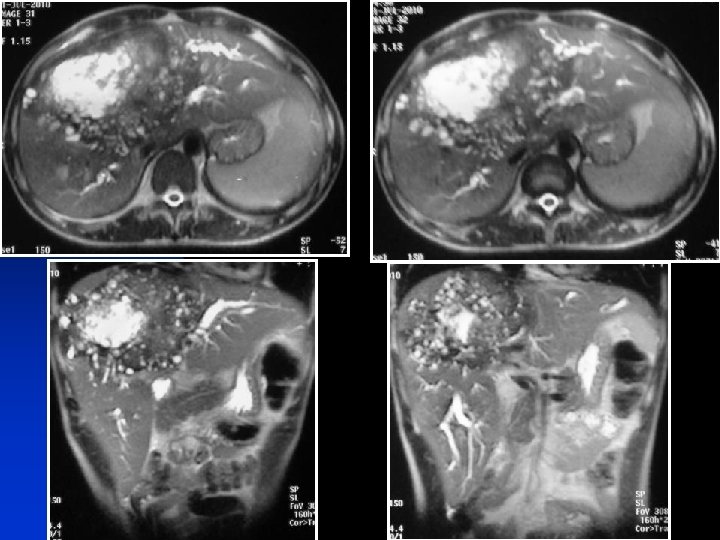
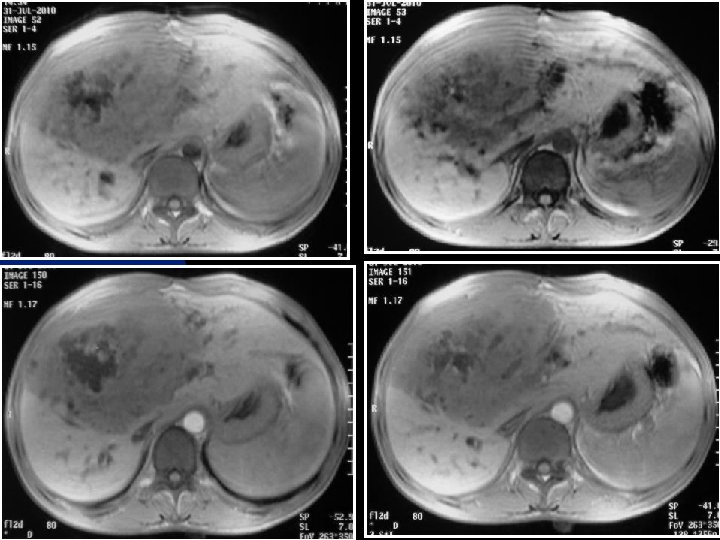
Pyogenic Biliary origin : multiple, both lobes Portal vein source : solitary, right lobe (65%), left lobe (12%), both (23%) vs Amoebic • Solitary unilocular • Right lobe of liver (posterosuperior segments) CT: Round (60%)or irregularly • CT : hypoattenuating with peripheral hypoattenuating area with peripheral rim enhancement • USG : Round or oval(82%) Cluster sign : small abscesses coalescing together • Absence of prominent abscess wall Double target sign : perilesional edema USG : Well defined or irregular & thick walled lesion , hypoechoic (36%) Gas – echogenic foci , Fluid-fluid interface, internal • Hypoechoic compared to normal liver with fine internal echoes (58 %)
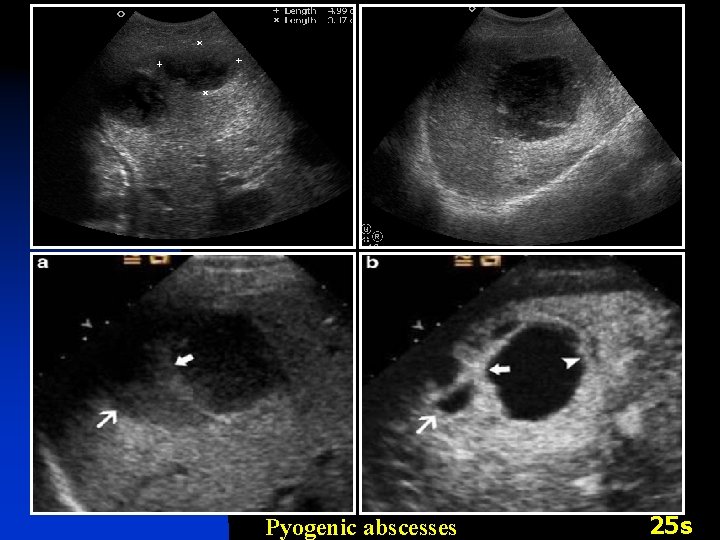
Pyogenic abscesses 25 s
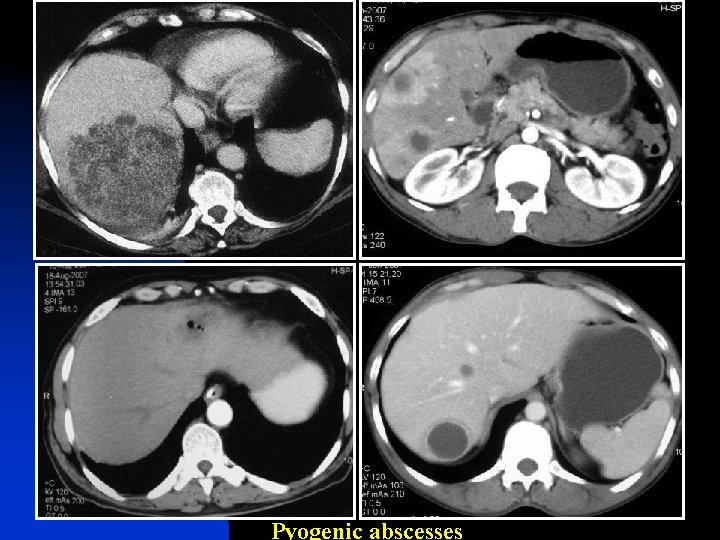
Pyogenic abscesses
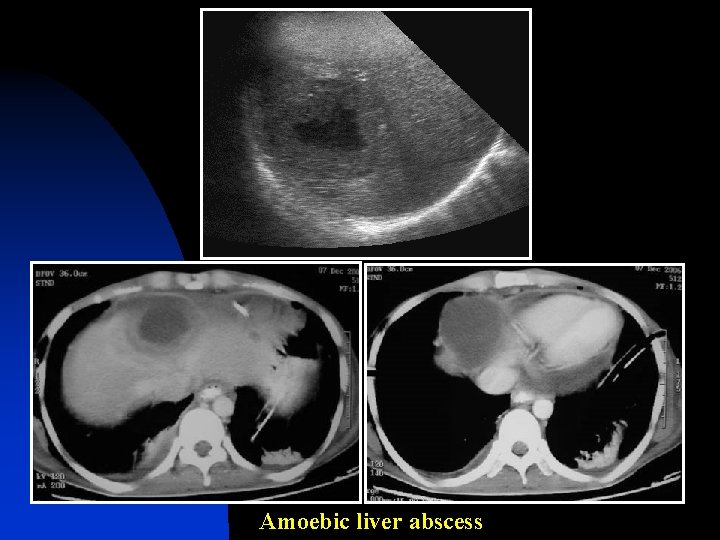
Amoebic liver abscess

Cystic Hydatid Disease Gharbi’s Classification of Cystic Hydatid Disease Type I Ultrasonographic features and patterns Pure fluid collection - univesicular cyst II Fluid collection with a split wall- detached laminated membrane (water-lily sign)- III Fluid collection with septa representing walls of daughter cysts (honeycomb sign) IV V Heterogeneous appearance - presence of matrix - mimics a solid mass Reflecting thick walls - calcifications
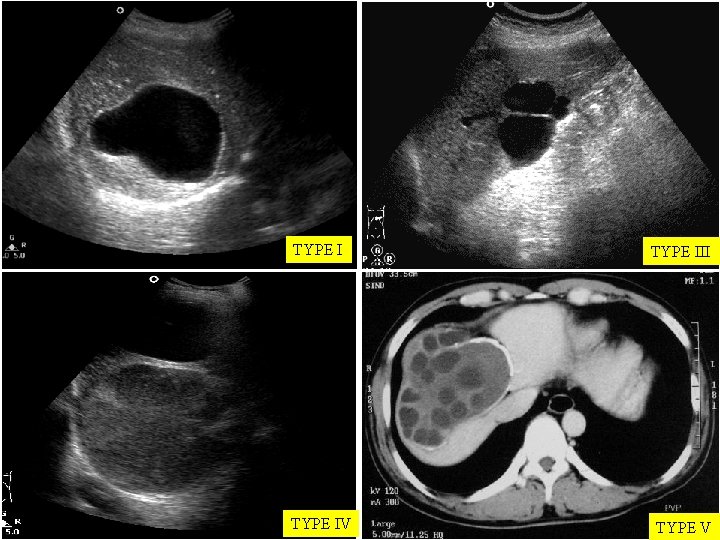
TYPE III TYPE IV TYPE V
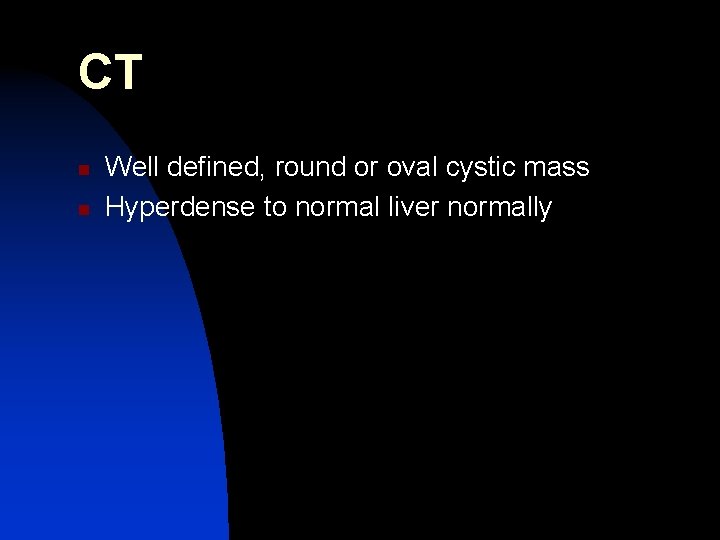
CT n n Well defined, round or oval cystic mass Hyperdense to normal liver normally
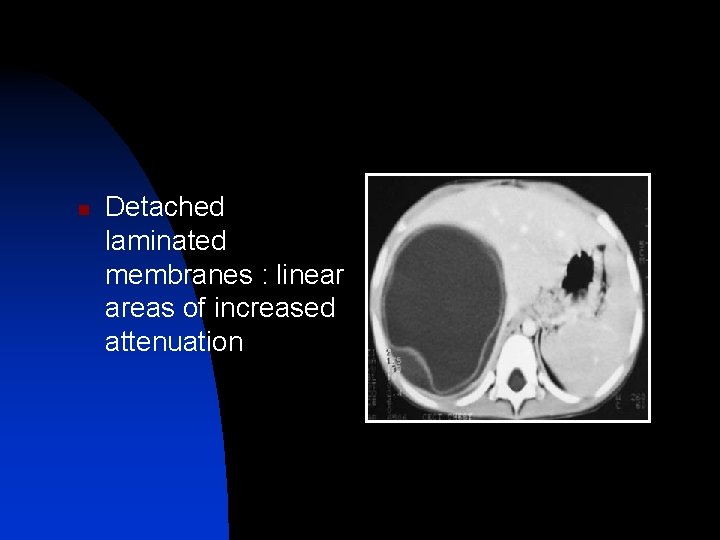
n Detached laminated membranes : linear areas of increased attenuation
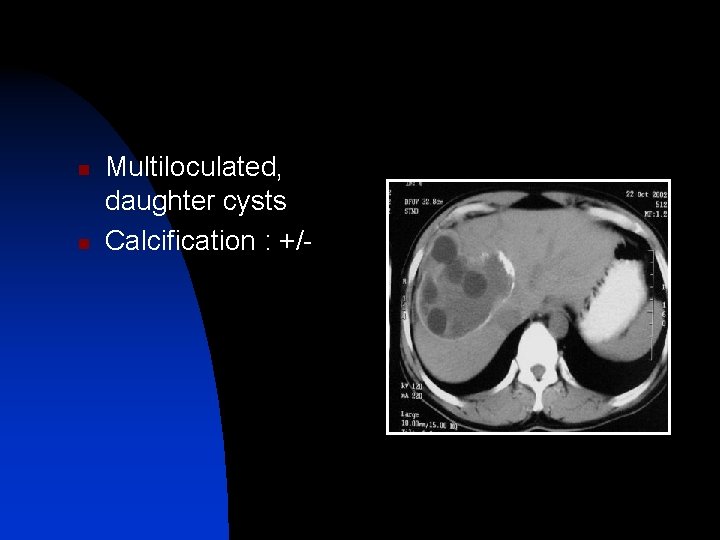
n n Multiloculated, daughter cysts Calcification : +/-
MRI n n n T 1 WI : hypo T 2 WI : hyper Peri cyst has low signal on T 1 and T 2 due to high collagen
Alveolar Echinococcosis • E multilocularis is responsible parasite. • Liver is MC (90%) site of E multilocularis , 70% rt. Lobe. • Foxes - main host , rarely cats & dogs. • Endemic in upper Midwest of USA, Alaska, Canada, Japan, Central Europe, and parts of Russia • Hilar infiltration in 50% of pts – dilatation of intrahepatic bile ducts and invasion of the portal and hepatic veins, with subsequent atrophy of the affected liver segments due to hypoperfusion Mortele KJ et al. Radio. Graphics 2004;
• US - “hailstorm” pattern – multiple echogenic nodules with irregular and indistinct margins - Lesions with central liquefactive necrosis appear hypoechoic, with some internal echoes and an irregular hyperechoic border • CT and MR - multiple irregular, ill-defined lesions scattered throughout the involved liver that are generally hypo at CT and hyperintense at T 2 WI. - This mimic either metastases or pyogenic abscesses. - little or no enhancement. • D/D – Cystadenoma / Ca, peripheral cholangio Ca or metastasis with peripheral bile duct dilatation. Mortele KJ et al. Radio. Graphics 2004;
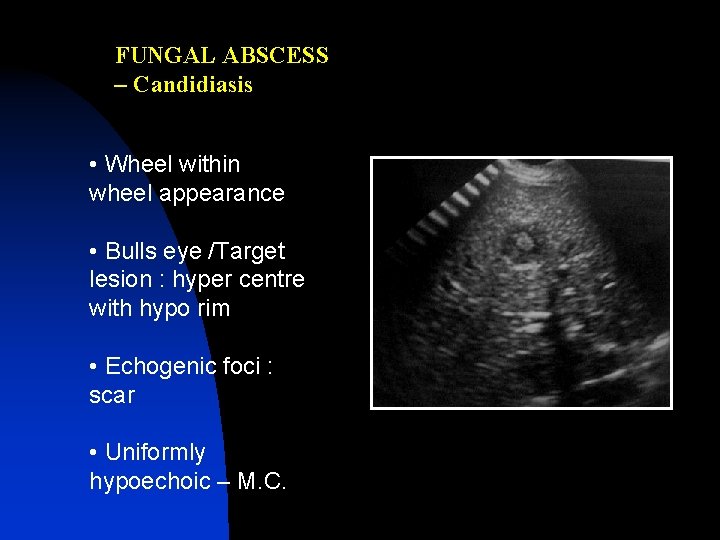
FUNGAL ABSCESS – Candidiasis • Wheel within wheel appearance • Bulls eye /Target lesion : hyper centre with hypo rim • Echogenic foci : scar • Uniformly hypoechoic – M. C.
Radio. Graphics 2001;
Radio. Graphics 2001;
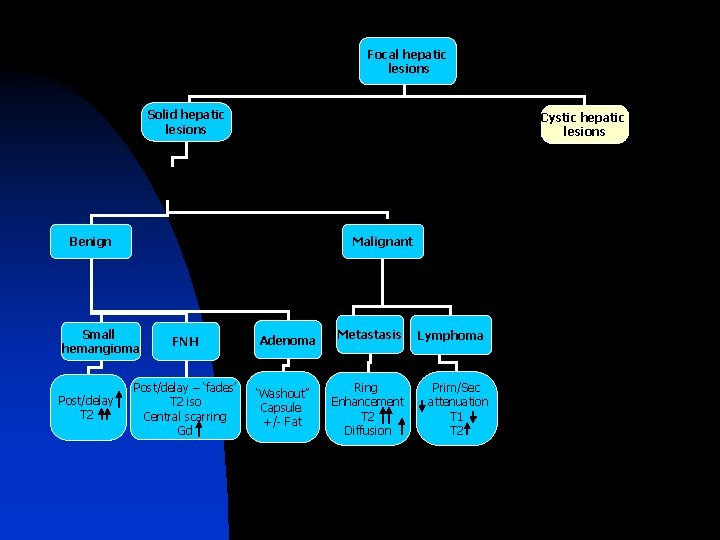
Focal hepatic lesions Solid hepatic lesions Cystic hepatic lesions Benign Malignant Small hemangioma Post/delay T 2 FNH Post/delay – ‘fades’ T 2 iso Central scarring Gd Adenoma ‘Washout’’ Capsule +/- Fat Metastasis Ring Enhancement T 2 Diffusion Lymphoma Prim/Sec attenuation T 1 T 2
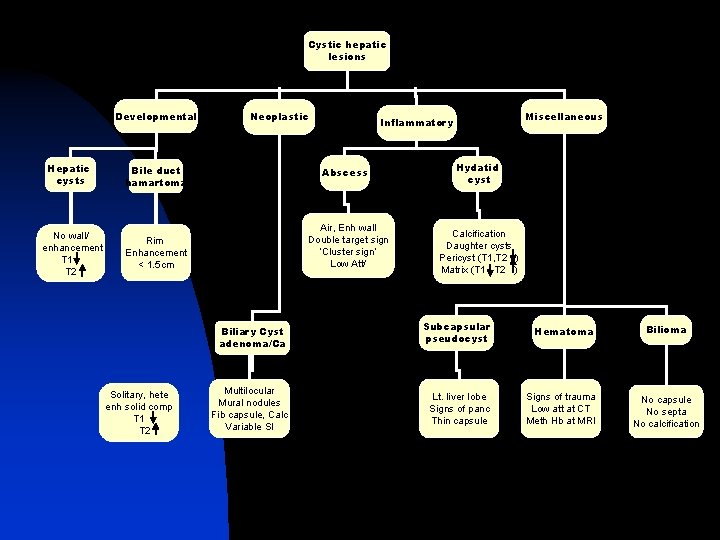
Cystic hepatic lesions Developmental Hepatic cysts No wall/ enhancement T 1 T 2 Neoplastic Bile duct hamartoma Abscess Air, Enh wall Double target sign ‘Cluster sign’ Low Att/ Rim Enhancement < 1. 5 cm Biliary Cyst adenoma/Ca Solitary, hete enh solid comp T 1 T 2 Multilocular Mural nodules Fib capsule, Calc Variable SI Miscellaneous Inflammatory Hydatid cyst Calcification Daughter cysts Pericyst (T 1, T 2 ) Matrix (T 1 T 2 ) Subcapsular pseudocyst Hematoma Lt. liver lobe Signs of panc Thin capsule Signs of trauma Low att at CT Meth Hb at MRI Bilioma No capsule No septa No calcification
D/D : Malignant cystic lesions Cystic metastasis n Ovarian tumors n Teratomas n Squamous cell Ca
Pediatric liver masses • MC liver neoplasm in children, as in adults, is metastasis • Most primary tumors are malignant, 1/3 rd benign • MC benign tumors are IHE, FNH, mesenchymal hamartoma, NRH & hepatocellular adenoma • Malignant – Metasasis, hepatoblastoma, HCC, Lymphoma • Others - Abcesses, hematoma Ellen MC, et al. Radio. Graphics 2010; 30: 801– 826
D/D of Pediatric liver tumors • Age < 5 years-hepatoblastoma , IHE, mesenchymal hamartoma, metastasis. • Age> 5 years : HCC, adenoma and metastasis. • AFP- HCC , hepatoblastoma • Solitary vs multiple SOL- IHE, metastasis, abscess, lymphoproliferative disease, adenoma,
Infantile hemangioendothelioma • 90% before 6 months, F>M • Mesenchymal tumor , vascular channels formed by • • endothelial proliferation Usually presents as hepatomegaly/abdominal mass/congestive heart failure due to AV Shunting in the lesion/ thrombocytopenia due to platelet sequestration (kasabach meritt syndrome ) May be associated with cutaneous hemangiomas Ellen MC, et al. Radio. Graphics 2010; 30: 801– 826
TYPE 1 n Vasc channels lined by endothelial cells supported by reticular fibres TYPE 2 n Large irregular branching spaces lined by immature pleomorphic cells
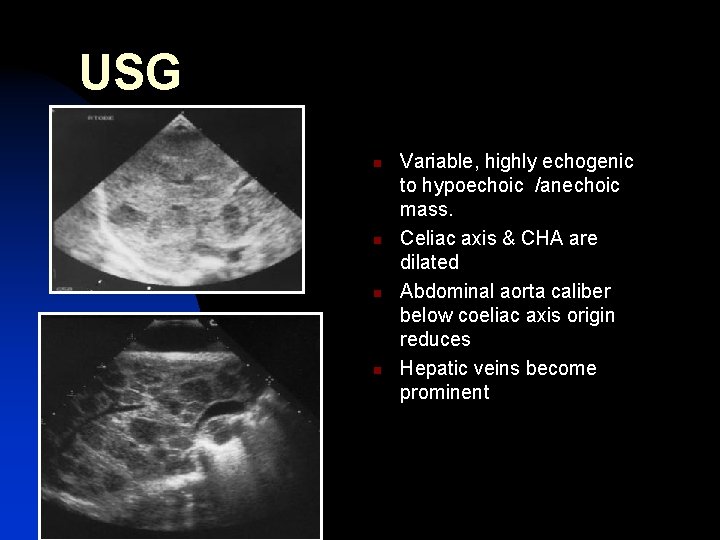
USG n n Variable, highly echogenic to hypoechoic /anechoic mass. Celiac axis & CHA are dilated Abdominal aorta caliber below coeliac axis origin reduces Hepatic veins become prominent
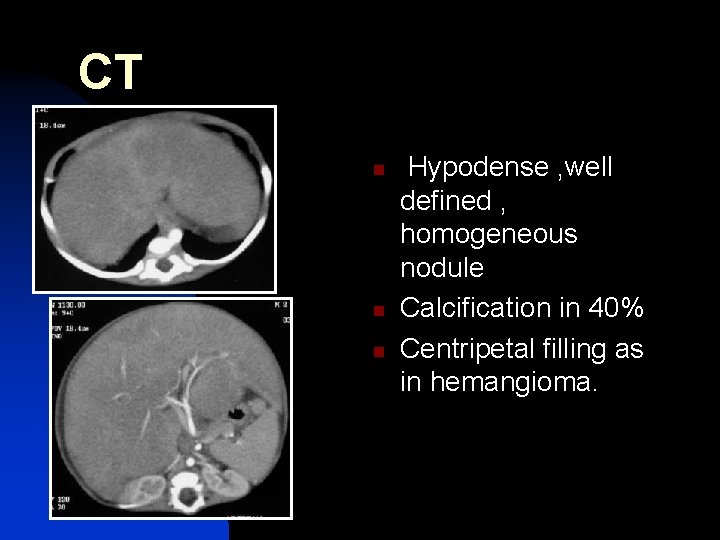
CT n n n Hypodense , well defined , homogeneous nodule Calcification in 40% Centripetal filling as in hemangioma.
MRI • Hypointense on T 1 WI and hyperintense on • • • T 2 W Heterogeneous if necrosis, hemorrage and fibrosis Feeder vessel-flow void Centripetal fill in of contrast post gadolinium
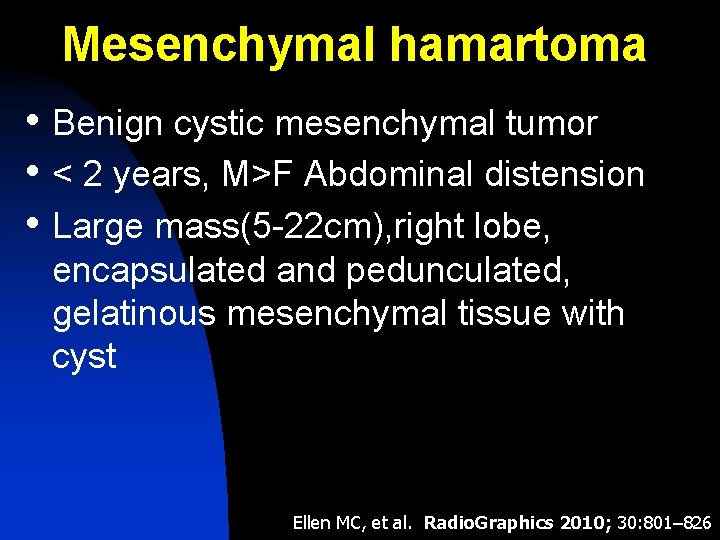
Mesenchymal hamartoma • Benign cystic mesenchymal tumor • < 2 years, M>F Abdominal distension • Large mass(5 -22 cm), right lobe, encapsulated and pedunculated, gelatinous mesenchymal tissue with cyst Ellen MC, et al. Radio. Graphics 2010; 30: 801– 826
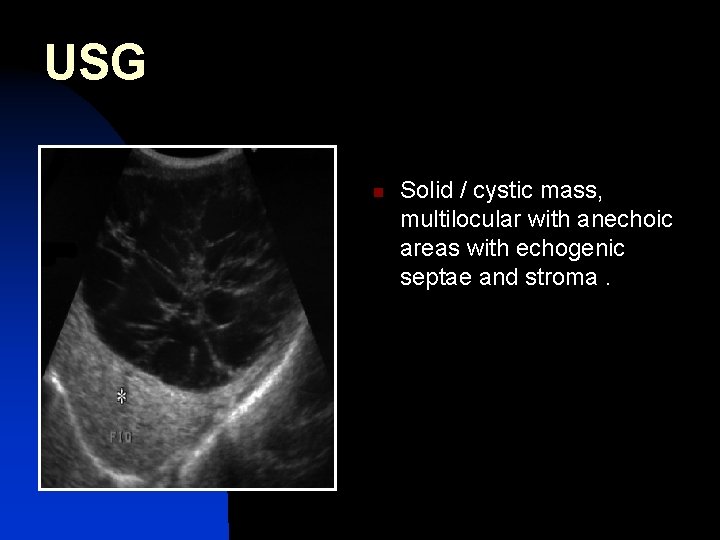
USG n Solid / cystic mass, multilocular with anechoic areas with echogenic septae and stroma.
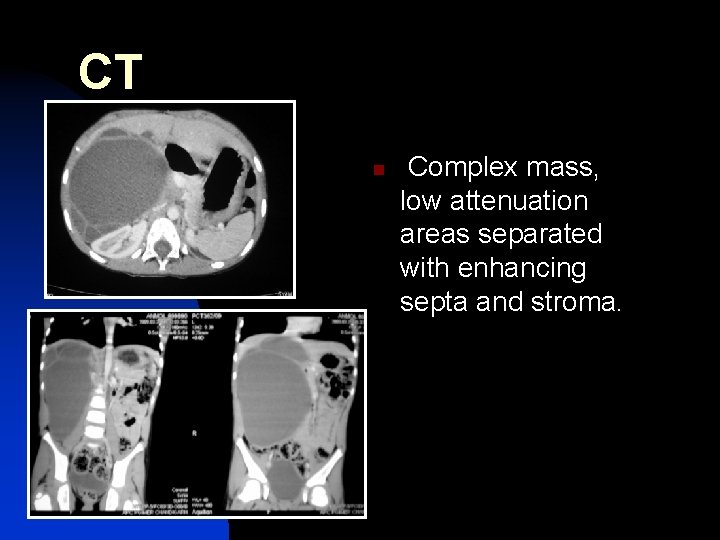
CT n Complex mass, low attenuation areas separated with enhancing septa and stroma.
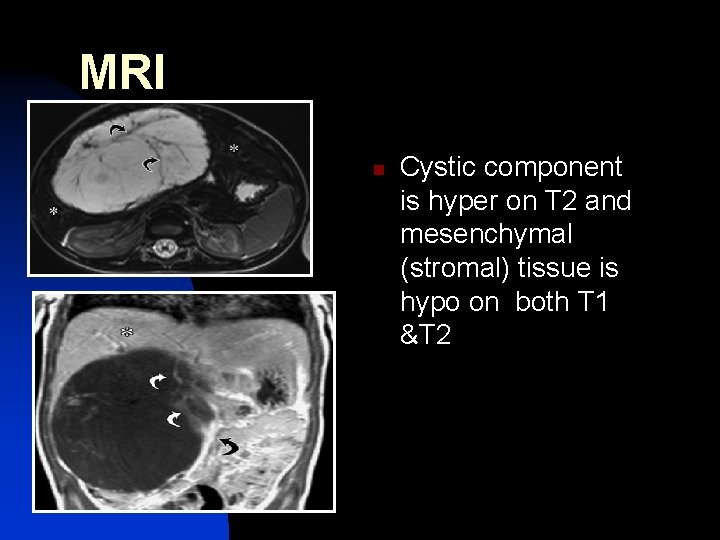
MRI n Cystic component is hyper on T 2 and mesenchymal (stromal) tissue is hypo on both T 1 &T 2
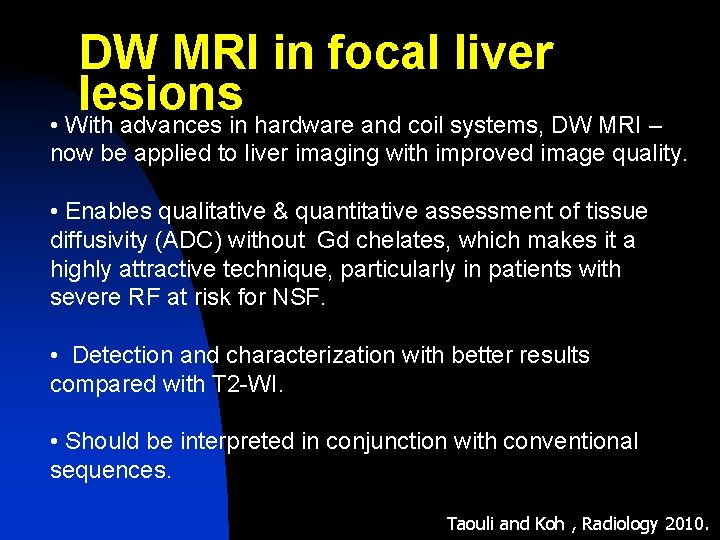
DW MRI in focal liver lesions • With advances in hardware and coil systems, DW MRI – now be applied to liver imaging with improved image quality. • Enables qualitative & quantitative assessment of tissue diffusivity (ADC) without Gd chelates, which makes it a highly attractive technique, particularly in patients with severe RF at risk for NSF. • Detection and characterization with better results compared with T 2 -WI. • Should be interpreted in conjunction with conventional sequences. Taouli and Koh , Radiology 2010.
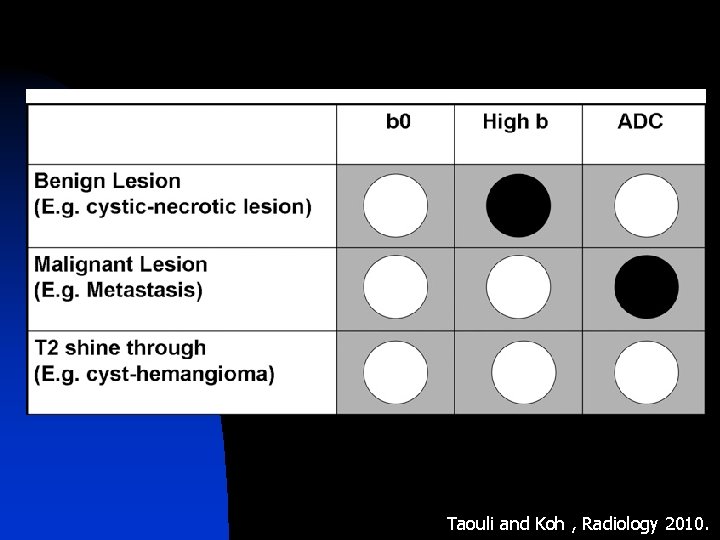
Taouli and Koh , Radiology 2010.
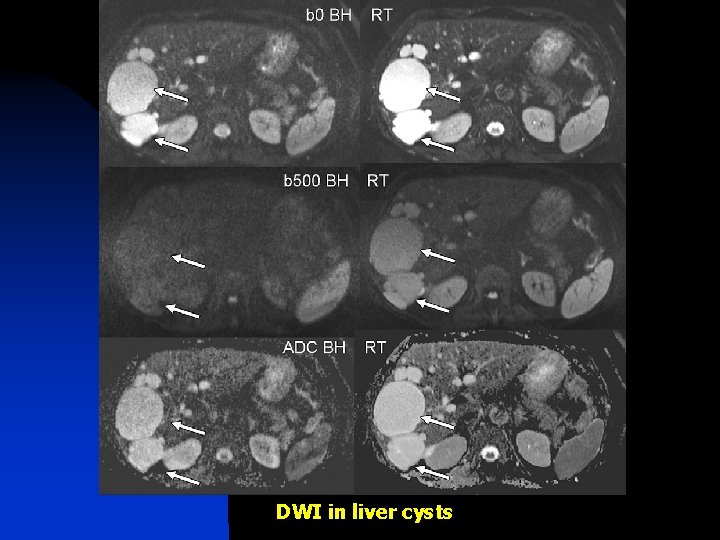
DWI in liver cysts
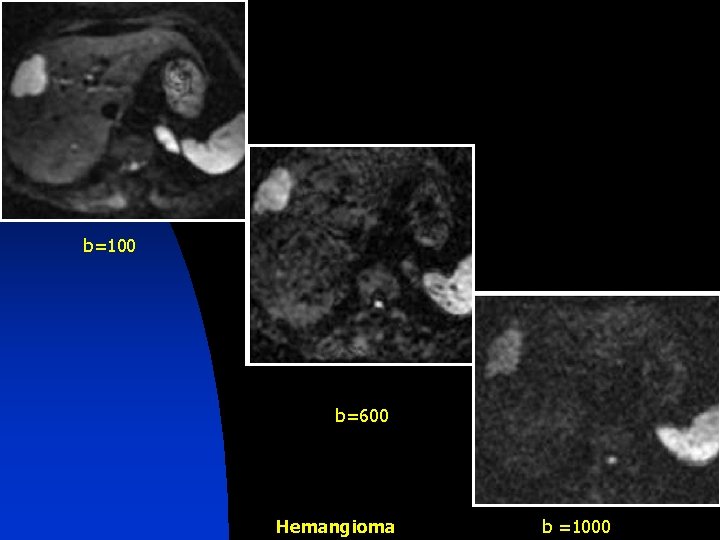
b=100 b=600 Hemangioma b =1000
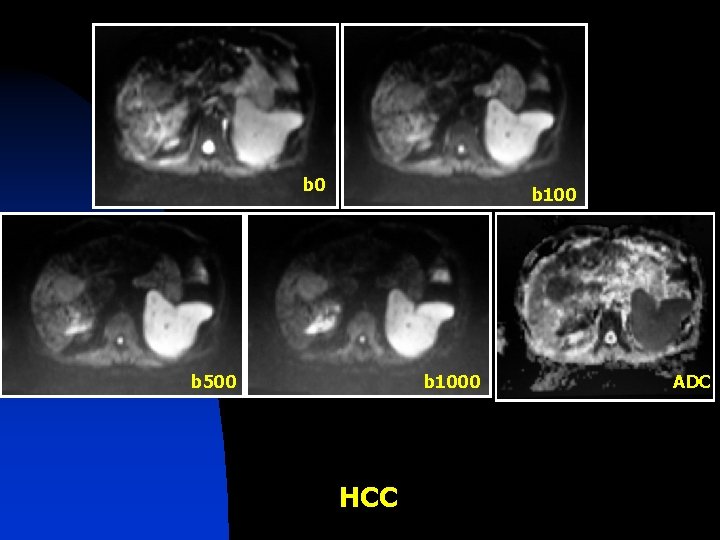
b 0 b 100 b 500 b 1000 HCC ADC
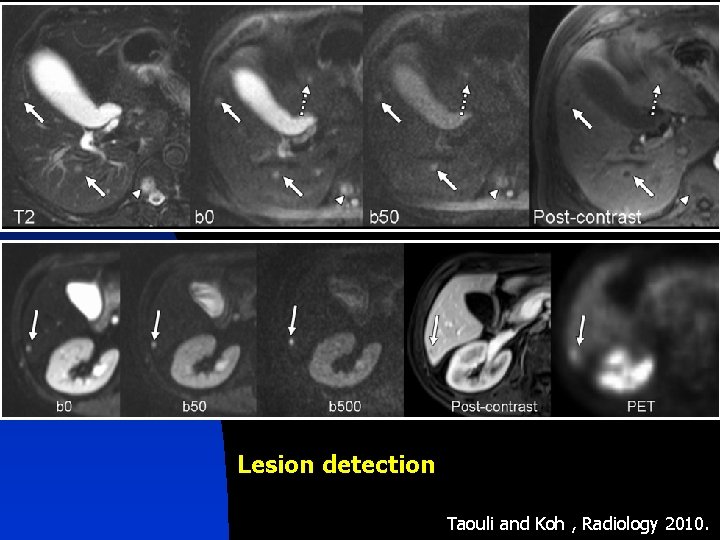
Lesion detection Taouli and Koh , Radiology 2010.
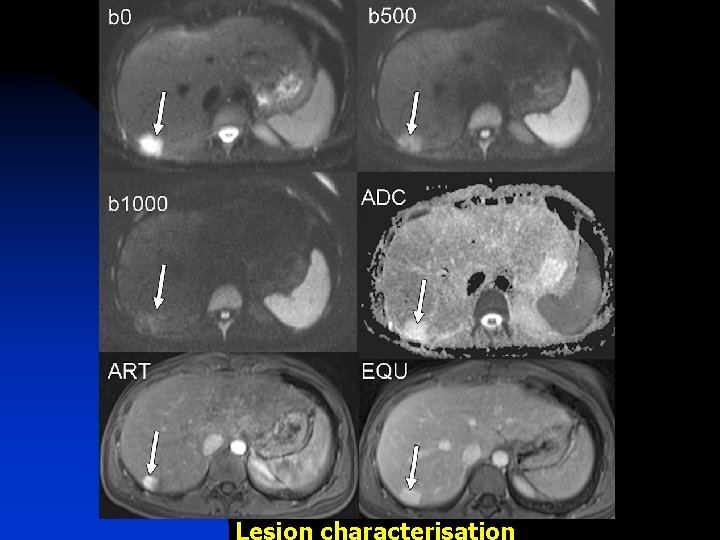
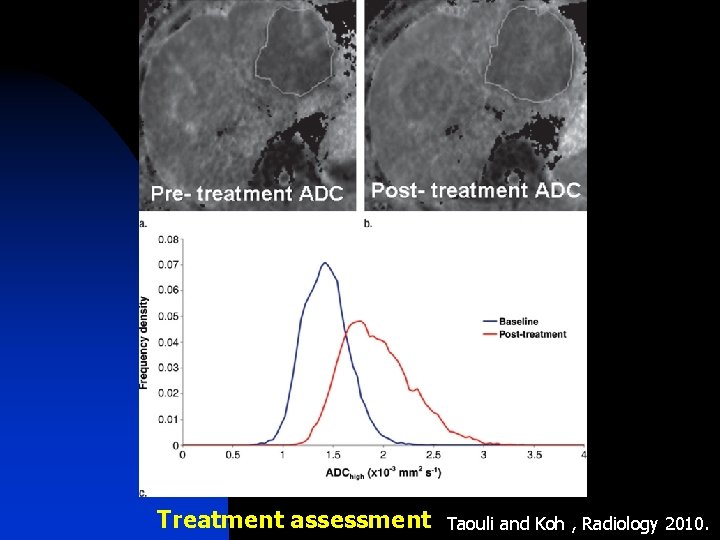
Treatment assessment Taouli and Koh , Radiology 2010.
CONCLUSION • Accurate clinical information needed to select the most appropriate imaging modality • Ultrasound is the initial modality for hepatic imaging • Helical CT/ MRI are able to characterize the hepatic lesions • DW-MRI has the potential to help detect and characterize focal lesions in the liver. • Knowledge of imaging features of liver lesions is essential to avoid unnecessary work-up and to minimize patient anxiety

- Slides: 147