Illustration in Scientific Writing Wasmen Manalu Introduction Illustration


- Slides: 35
Illustration in Scientific Writing Wasmen Manalu
Introduction • Illustration could be in the forms of tables and figures (graphs, photos, diagrams, charts, maps etc). • Do not use a table and a figure with the same contents in the article, choose either of them.
Introduction • In preparing illustrations, please refer to the Instruction for Authors. • Illustrations are supplement to the article. • Illustrations should be narrated in the article. • Refer the illustration by number.
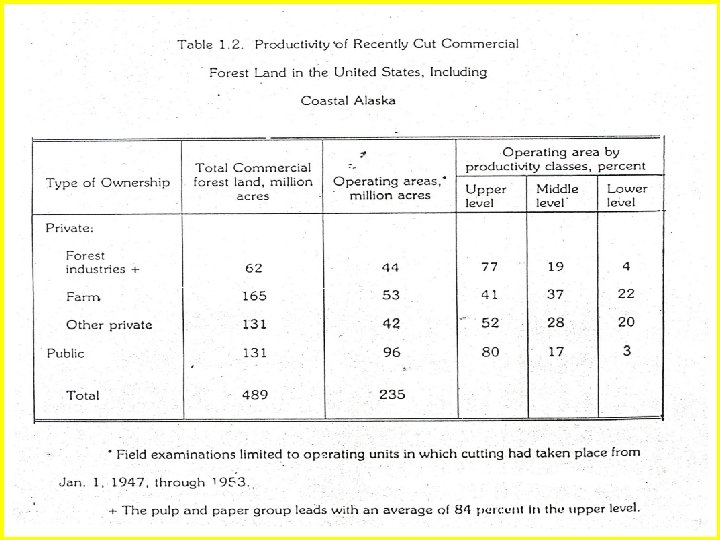
Table • Prepare table in separate page (do not insert into the body of the text) and each table is prepared in separate page. • Give table number in Arabic (1, 2, 3, 4, etc not i, iii, iv, v, vi, etc).
Table • Before preparing a table, please check the general style in the latest issues of the journal. • Generally, only three horizontal lines across the page are allowed, i. e. . , Two on the column heading and one on the bottom of the table.
Table • Vertical lines are not recommended. • Therefore, line default in the computer program should be edited.
Table • Table should have a title on the top of the table. • Consult the latest issues of the journal or the instruction for author formatting the title (justification, centered or left, italic, or capital)
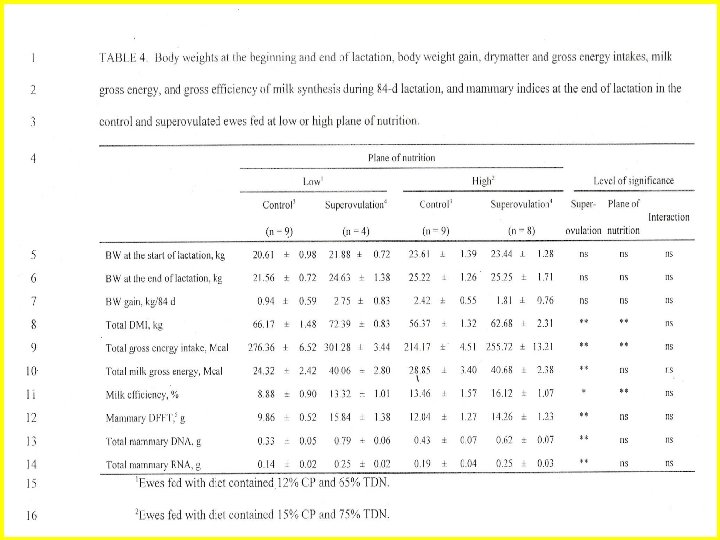
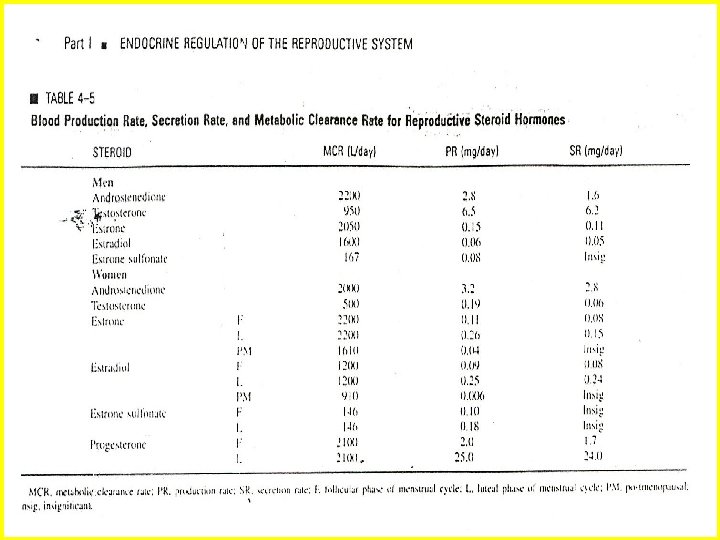
Table • A legend should give enough experimental detail to be understandable without the text. • Each column must have a heading. • Necessary abbreviations should be defined in the legend or in the footnotes
Table • Numbers in a table should be aligned by decimal point. • The significance of the decimal numbers should be checked. • Include SD or SE of the means.
Table • Table should give enough experimental details and explanations (in the legend or in the footnotes) to be understandable without the text. • For simple table, use portrait and for tables requiring many columns, use landscape.
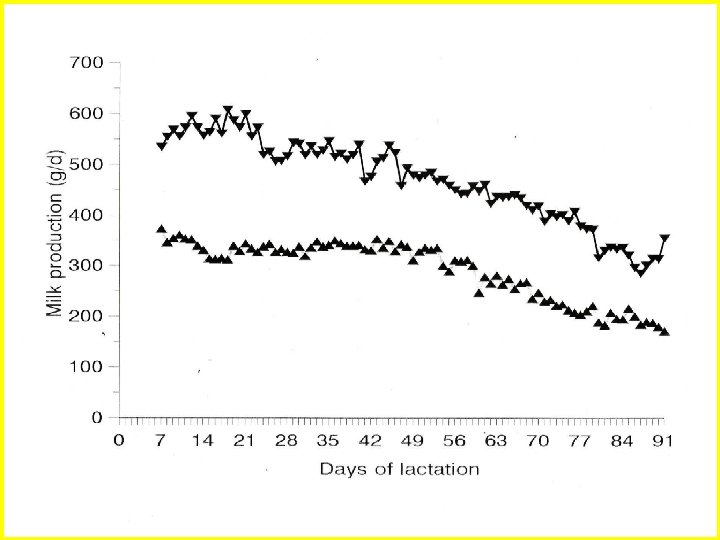
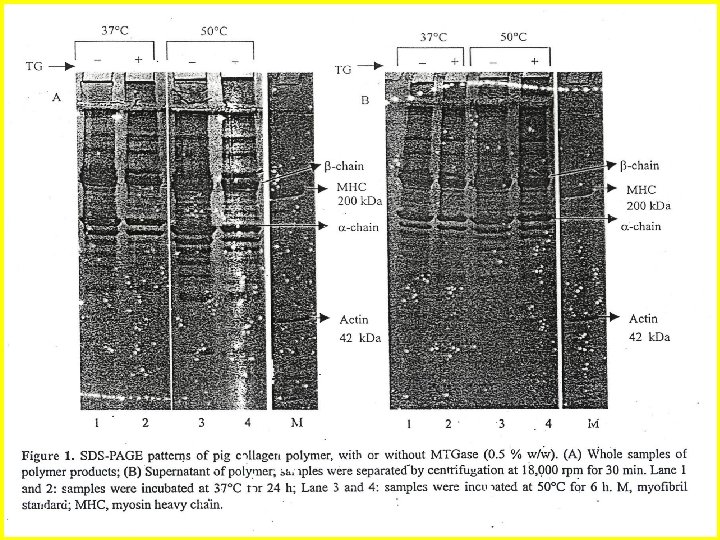
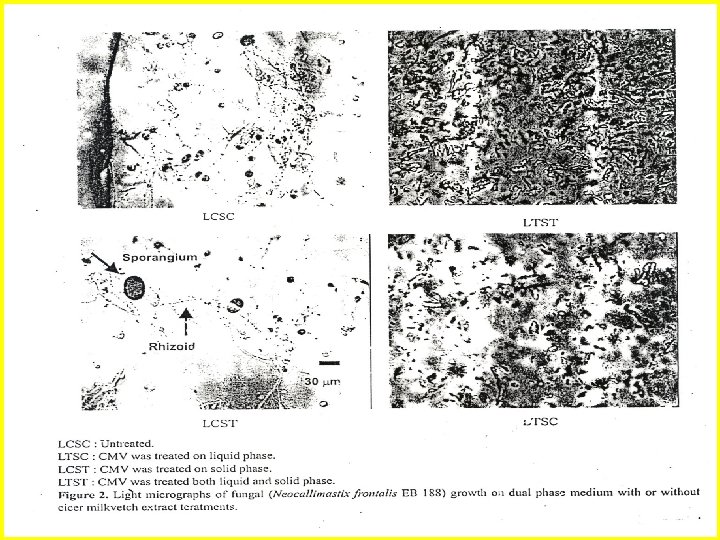
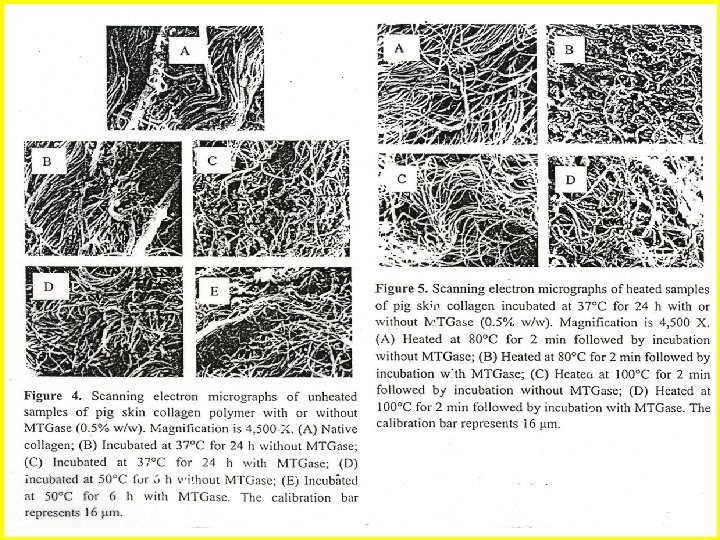
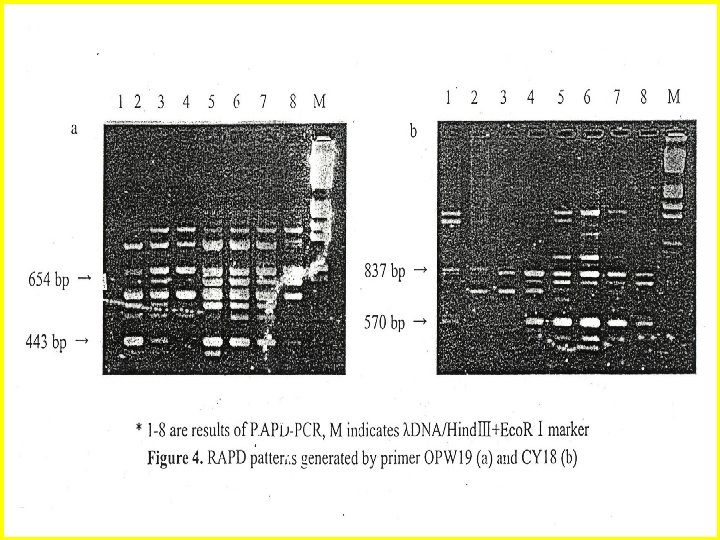
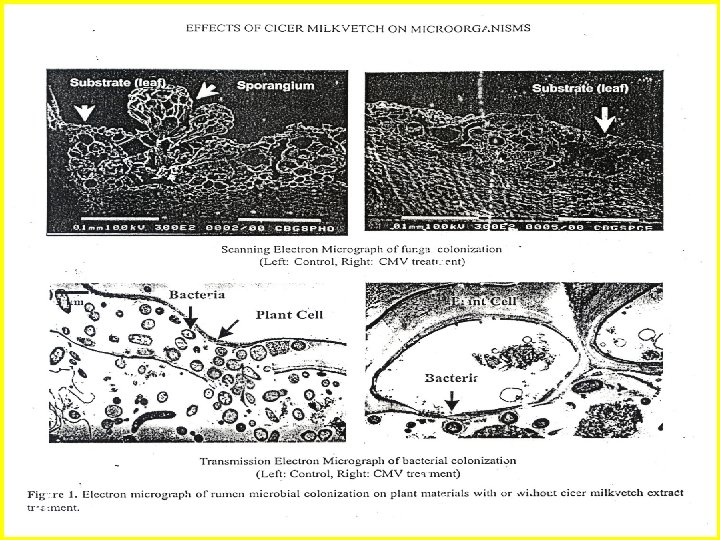
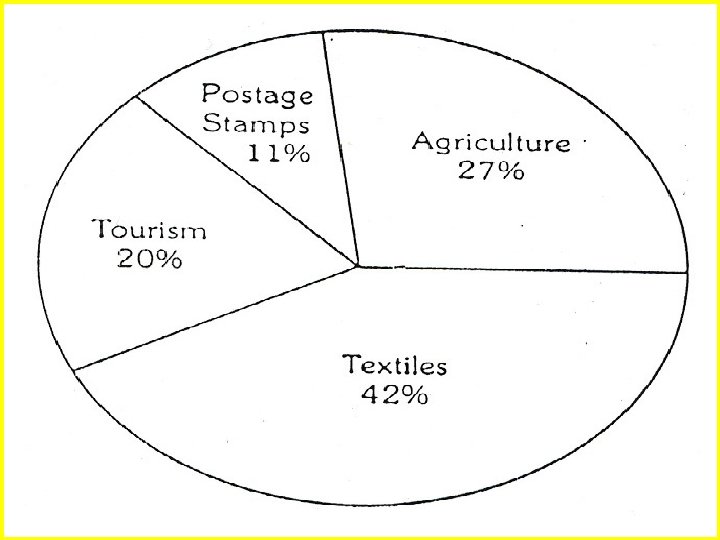
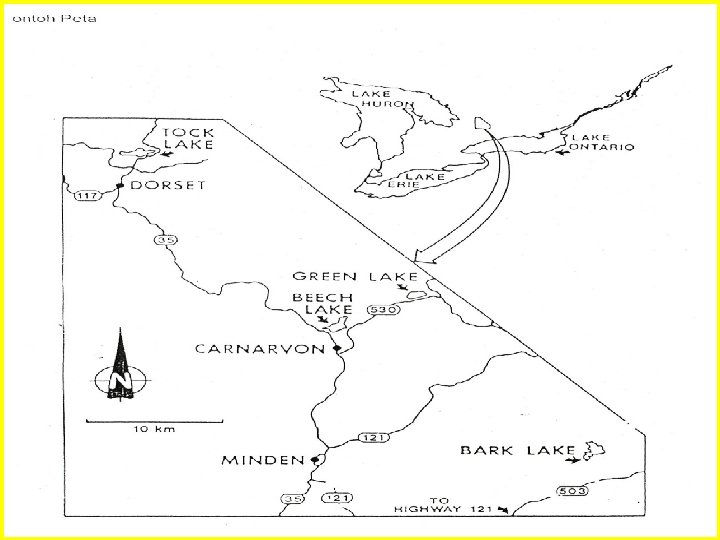
Figure • Figure includes graph, photo, diagram, chart, map, etc. • Discussion will be focused on the graph. • Again, do not use figure plotted from the same numbers in the table already used in the article.
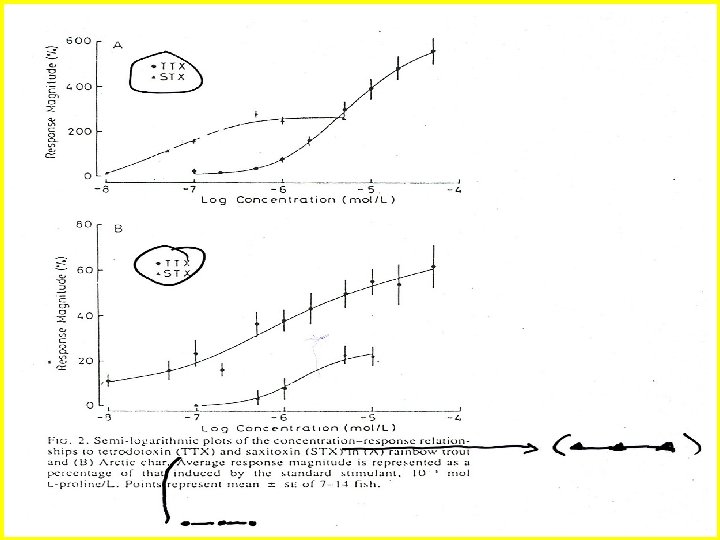
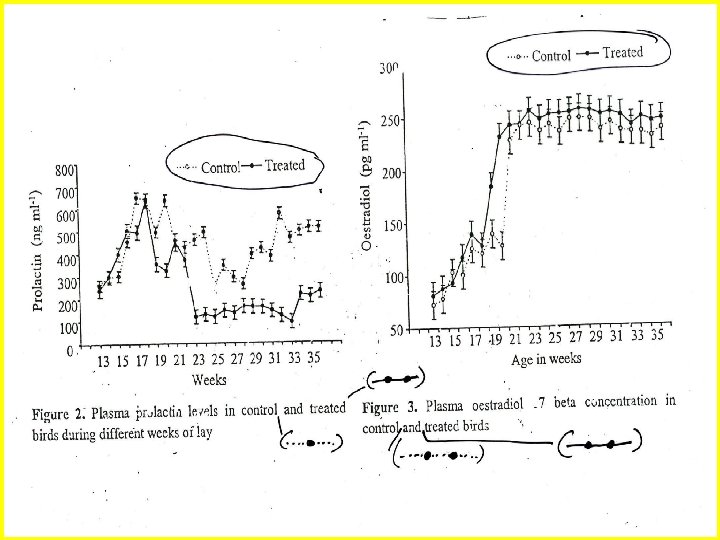
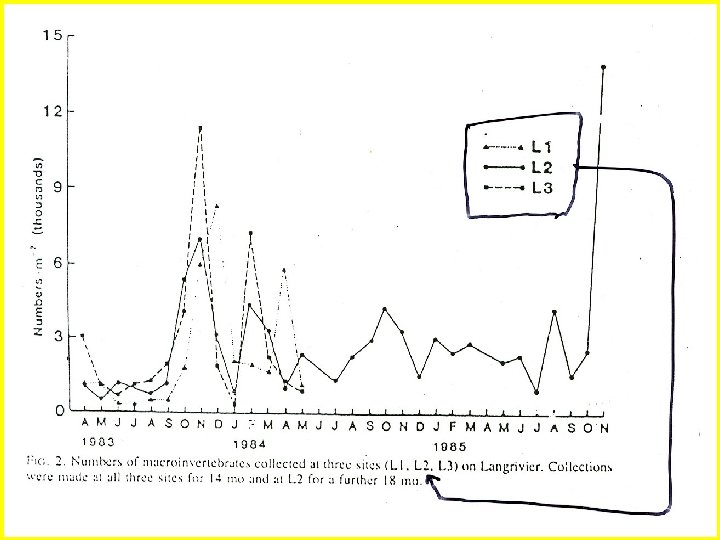
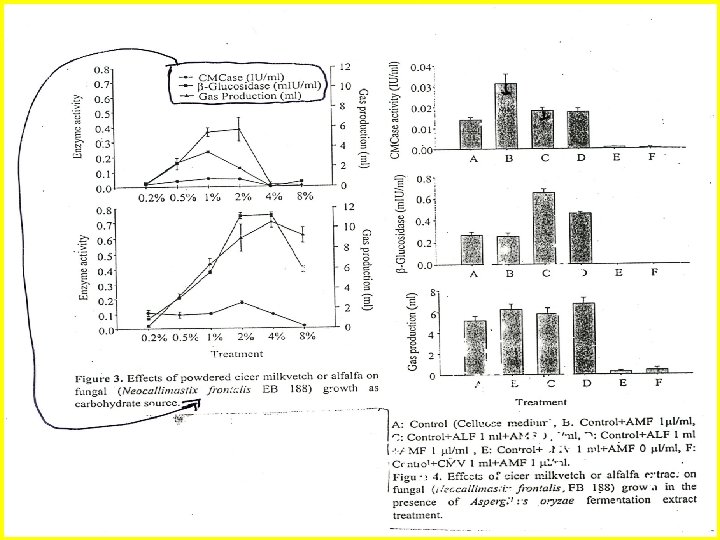
Figure • Figure should have a title. • The legend must contain sufficient detail to make the figure easily understood. • Identify symbols and curves in the legend, not on the figure
Figure • Appropriately sized numbers, letters, and symbols should be used so they are no smaller than 2 mm in size after reduction to a single column width (87 mm), a 1. 5 column width (120 mm), or a full 2 -column width (178 mm). • A figure may be estimated by using a reducing photocopier to see if it can fit into a single column; be sure to look at the smallest letter or symbol to decide what will be legible in print.
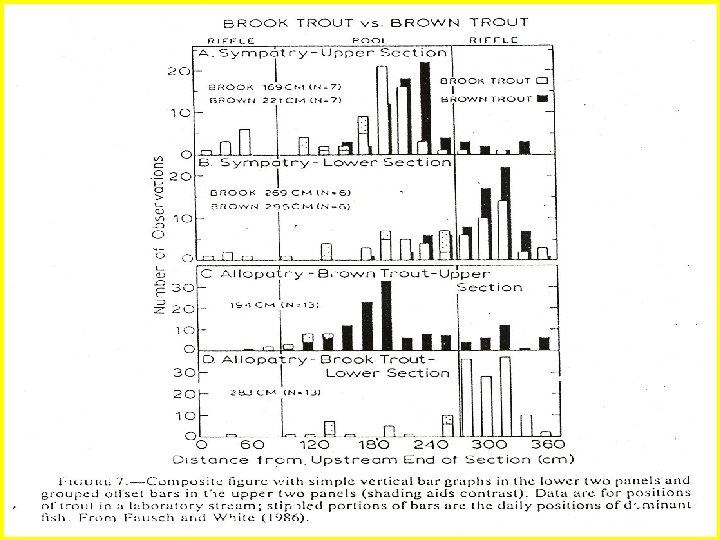
Figure • Numbers, letters, and symbols used in multipaneled figures must be consistent. • The abscissa and the ordinate must be clearly labeled with appropriately sized type, and units of measurement must be given. • In graph illustration, include the SD or SE of the means.
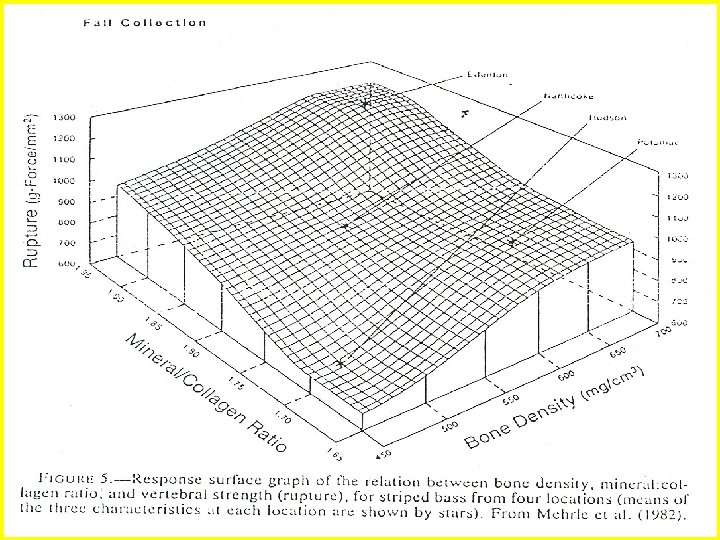
Figure • Figure or graph is used to present a relatively huge data, or to present the pattern or trend, not the absolute numbers. • Each figure is prepared and printed in separate page. • Labeled the back of the figure with the figure number and the author. • Make sure that each figure is labeled appropriately. • Give the position identification (top or bottom) for figure that is not clear.
Figure • Do not add any information or note on the figure. • Do not type the title or legend on the figure. • Type the titles or legends of figures in separate page (generally, after table). • Format the legends or titles according to the Instruction for Authors, or consult the latest issue of the journal.