ILK Kolloquium 2013 Mnster Land change in Brazilian

ILÖK Kolloquium 2013, Münster Land change in Brazilian Amazonia: A case study in nature-society interaction Gilberto Câmara National Institute for Space Research (INPE) Brazil IFGI, University of Münster, Germany http: //www. dpi. inpe. br/gilberto

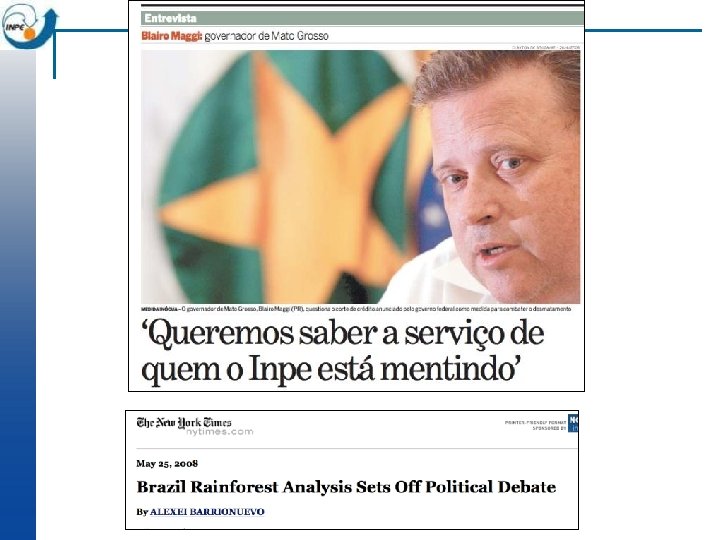
Nature, 29 July 2010

Nature, 29 July 2010 Brazil is the world’s current largest experiment on land change and its effects: will it also happen elsewhere? Today’s questions about Brazil could be tomorrow’s questions for other countries

The challenge: reducing deforestation
")
How can we avoid that the forest…. Source: Carlos Nobre (INPE)
")
Fire. . . … will not become a waste land? Source: Carlos Nobre (INPE)

Amazonia and Europe Brazilian Amazonia : 4. 5 million km 2 European Union: 4. 3 million km 2
 State (power by technical staff) Rule of")
Foundations of modern democracies source: Fukuyama (2011) State (power by technical staff) Rule of law (limits power) Society (public accountability) How the interplay between science, public opinion and government?

INPE: Clear-cut deforestation mapping of Amazonia since 1988 ~230 scenes Landsat/year Yearly detailed estimates of clear-cut areas (wall-to-wall) Data released openly after 2003

How does change occurs? Global. How Change much change is happening? Where are changes taking place? Who is causing change? What are the impacts of public policies? What will happen in the future?

How does deforestation happen? Slash and burn Progressive degradation

Slash and burn Slash: start of dry season Burn: end of dry season
 Selective logging Wood extraction and burning Further burning")
Progressive degradation Barlow and Peters (2008) Selective logging Wood extraction and burning Further burning and pasture Clear cut

How does deforestation happen? T 1 – Selective logging T 2 – Loss of smaller trees T 3 – Loss >50% of forest T 4 – Loss >90% of forest

Final = Clear cut Pasture

INPE’s Monitoring Systems time dialy deforestation alerts Yearly rates of clear cuts Floresta

Real-time Deforestation Monitoring Daily warnings of newly deforested large areas
 – LANDSAT Image – 22 August 2003")
Altamira (Pará) – LANDSAT Image – 22 August 2003
 – MODIS Image – 07 May 2004")
Altamira (Pará) – MODIS Image – 07 May 2004
 – MODIS Image – 22 June 2004 6. 000 hectares deforested in")
Altamira (Pará) – MODIS Image – 22 June 2004 6. 000 hectares deforested in one month!

Go to the field. .

. . . and get the bad guys!

How hard is to use MODIS images to detect deforestation? Landsat/TM Alerta MODIS DETER nov-2007 August 2007 November 2007
 Clear-cut for pasture")
Checking DETER´s data (February 2008) Clear-cut for pasture

How hard is to use MODIS images to detect deforestation? New deforestation shown by DETER Landsat/TM 226/68 17/Ago/2007 DETER out-2007

Intensive timber extraction Exploração – estágio inicial
")
Monitoring forest degradation (S 12, 270 ; W 54, 130)

Reaching out to public policy 500. 000 registrations 46 million protests

Transparency builds credibility “Today, Brazil’s monitoring system is the envy of the world. INPE provides automated bi-weekly alerts that other tropical nations would love to emulate. ”
")
Protected areas and deforestation (1997)
")
Protected areas and deforestation (2000)
")
Protected areas and deforestation (2001)
")
Protected areas and deforestation (2002)
")
Protected areas and deforestation (2003)
")
Protected areas and deforestation (2004)
")
Protected areas and deforestation (2005)
")
Protected areas and deforestation (2006)
")
Protected areas and deforestation (2007)
")
Protected areas and deforestation (2008)

Finding: Protected areas deter deforestation
")
Finding: Deforestation is becoming harder to detect Proportion of clear cuts by size (ha) Clearings less than 50 ha: 35% of total in 2002 to 80% of total in 2010

For a while, everything was well. . .

Then, in January 2008. . .

What do you do when you make an error?

Public opinion – based on open data – forces government to act

Finding: Command control actions are effective means to curb deforestation Almost all deforestation is illegal

Keep watching! Jan-April/2011: 126% increase

Deforestation hotspots: March-May 2011

Deforestation hotspots: June-August 2011

Finding: Markets have a positive rôle

“By 2020, Brazil will reduce deforestation by 80% relative to 2005. ” (pres. Lula in Copenhagen COP-15)
 dropped from 27,")
How does Science influence policy? Deforestation in Brazilian Amazonia (1988 -2012) dropped from 27, 000 km 2 to 4, 800 km 2

“Deforestation in Brazilian Amazonia is down by a whopping 78% from its recent high in 2004. If Brazil can maintain that progress it would be the biggest environmental success in decades” (Nature, Rio + 20 editorial)

How much it takes to survey Amazonia? 116 -112 30 Tb of data 500. 000 lines of code 150 man/years of software dev 200 man/years of interpreters 116 -113 166 -112

What happened with 720. 000 km 2 deforested? Terra. Class - first map of land use and land cover of Amazonia
 e 30 m (LANDSAT) Pasto limpo")
Nível inédito de detalhe espacial: 20 m (CBERS) e 30 m (LANDSAT) Pasto limpo
")
Agriculture (grains)

Cleared pasture

Degraded pasture

Small-scale agriculture

Degraded land

How are we using the forest? 100% 90% 80% 70% Degraded Land 60% Second Veg Degrad Pasture 50% Pasture 40% Small Farms 30% Grains 20% 10% 0% AC MT PA RO

The extent of illegal deforestation
")
Class Clean Pasture Secundary Vegetation Dirty pasture Regeneration with pasture Non-observed areas Agriculture (large-scale) Small farms and settlers Urban areas Mining Degraded areas Others Desflorestation 2008 TOTAL (km 2) 335. 714, 94 150. 815, 31 62. 823, 75 48. 027, 37 45. 406, 27 34. 927, 24 24. 416, 57 3. 818, 14 730, 68 594, 19 477, 88 11. 458, 64 719. 210, 99 46, 7% 21, 0% 8, 7% 6, 3% 4, 9% 3, 4% 0, 5% 0, 1% 1, 6%

Challenges in monitoring Deforestation classes per area 2000 2002 2003 2004 2005 2006 6% 8% 9% 9% 10 a 25 ha 11% 6% 12% 14% 16% 20% 25 a 50 ha 11% 5% 11% 13% 16% 19% 50 a 100 ha 12% 6% 13% 12% 13% 14% 16% 100 a 150 ha 8% 3% 8% 7% 7% 150 a 300 ha 12% 6% 14% 12% 11% 10% More than 300 ha 38% 68% 31% 32% 27% 22% 13% Tendência de Aumento Aproxim. Estável Tendência de Redução 4% Estável 5% Aumento Less than 10 ha 2001

Working hypothesis The Brazilian Amazon has different institutional arrangements that influence the spatial and temporal patterns of deforestation.

Deforestation event detection: coverages and time series 2010 2011

How much it takes to survey Amazonia? 116 -112 30 Tb of data 500. 000 lines of code 150 man-years of software dev 200 man-years of interpreters 116 -113 166 -112

Terra. Amazon: infrastructure for management of deforestation data Fifteen years of remote sensing images, deforestation polygons and forest fire occurrences in a single information system

Geo. DMA: Data mining using geospatial data Classification and clustering of objects extracted from remote sensing images M. Silva et al. , “Remote sensing image mining: detecting agents of land use change in tropical forest areas”. Int Journal Remote Sensing, 29 (16): 4803 – 4822, 2008. T. Korting et al. , “Geo. DMA—Geographic Data Mining Analyst”. Computers & Geosciences, 57: 133– 145, 2013.

Occupation patterns in Amazonia Different human actions, different patterns

Geo. DMA: Classification of patterns of deforestation Map shows main patterns in a 50 km x 50 km cell

Terra. ME: nature-society modelling Agent Space Nature represented in cellular spaces, society represented as agents T. Carneiro, P. Andrade, et al. , “An extensible toolbox for modeling nature-society interactions”. Enviromental Modelling and Software, 2013 (Two Ph. Ds).

Deforestation: simulated x observed
, pre-frontier (light red), frontier (light green)")
Frontier evolution in Sao Felix Consolidated (dark red), pre-frontier (light red), frontier (light green) and post-frontier (dark green).
 State (power by technical staff) Science State")
Foundations of modern democracies source: Fukuyama (2011) State (power by technical staff) Science State Institutions Rule of law (limits power) Society (public accountability)
: “Brazil´s monitoring")
Finding: Transparency builds governance! CBERS image Degradation Deforestation Science (27 April 2007): “Brazil´s monitoring system is the envy of the world”.
- Slides: 78