
IL BILANCIO EUROPEO E LA PAC Felice Assenza
IL BILANCIO EUROPEO E LA PAC Felice Assenza Ⓒ Olof S. Dirigente Ufficio Rapporti Internazionali Direzione generale delle Politiche Comunitarie e Internazionali di Mercato
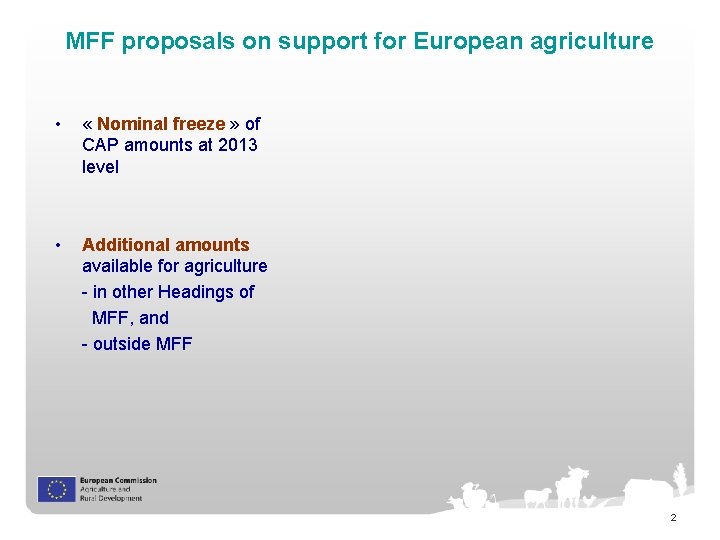
MFF proposals on support for European agriculture • « Nominal freeze » of CAP amounts at 2013 level • Additional amounts available for agriculture - in other Headings of MFF, and - outside MFF 2
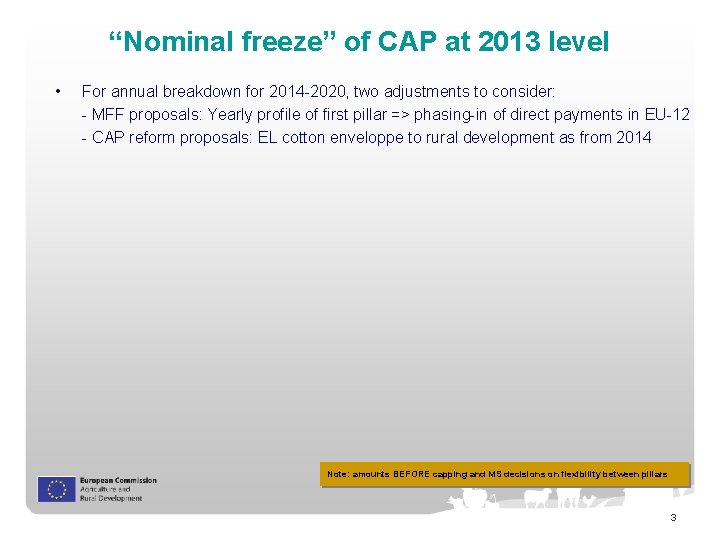
“Nominal freeze” of CAP at 2013 level • For annual breakdown for 2014 -2020, two adjustments to consider: - MFF proposals: Yearly profile of first pillar => phasing-in of direct payments in EU-12 - CAP reform proposals: EL cotton enveloppe to rural development as from 2014 Note: amounts BEFORE capping and MS decisions on flexibility between pillars 3
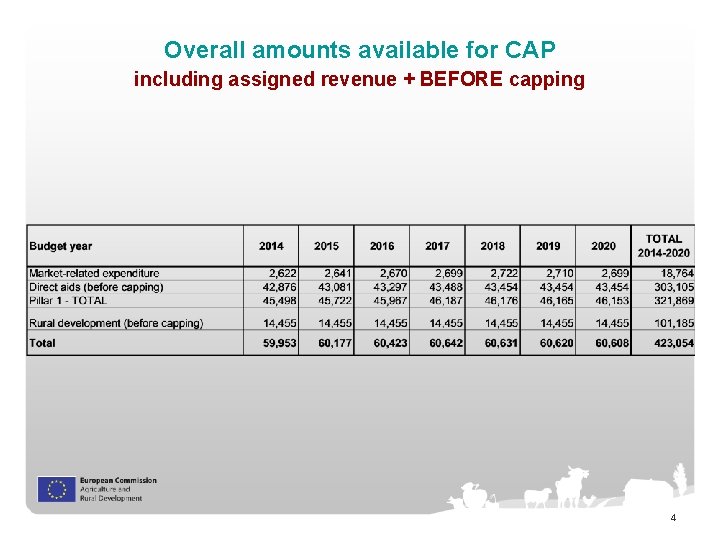
Overall amounts available for CAP including assigned revenue + BEFORE capping 4
Crises reserve Draft Inter-Institutional Agreement - COM(2011)403 final • Reserve is intended to provide additional support to agricultural sector • In case of major crises affecting agricultural production or distribution • In case measures cannot be financed within limits of EAGF sub-ceiling • Maximum annual amount = 500 million (2011 prices) • Commission to present proposal to Budgetary Authority for transfer from Reserve to corresponding budget lines Art 159 of draft Single CMO • Additional support in circumstances going beyond normal market developments • In particular for: exceptional measures, public intervention, private storage, refunds 5
Direct payments: convergence (NB: claim year 2014 = budget year 2015, etc. ) Basis for calculating the redistribution needs = direct payments envelopes after phasing-in • These correspond to: Total gross ceilings for Single Payment Scheme (Annex VIII of Council Regulation 73/2009 as per claim year 2016 + estimated amount for wine grubbing-up 2012) reduced by amounts of compulsory modulation as per budget year 2013 • Amounts not subject to redistribution: – Crop specific payment for cotton – POSEI and Smaller Aegean Islands programmes Calculation of average levels of direct payments per hectare: • Direct payments envelopes divided by potentially eligible area (PEA) as declared by Member States in IACS statistics for claim year 2009 Convergence of direct payments: • MS with direct payments below the level of 90% of EU average should close 1/3 of the gap between their current level as calculated above and this level • MS that are above the average will contribute proportionally to this convergence 6
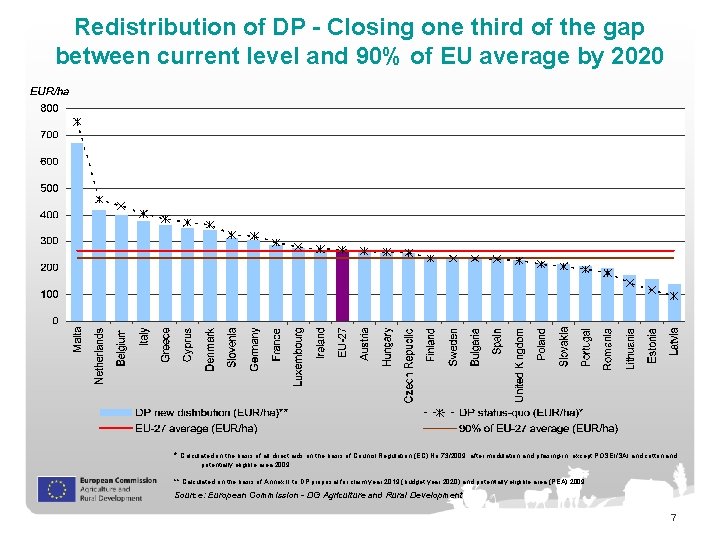
Redistribution of DP - Closing one third of the gap between current level and 90% of EU average by 2020 * Calculated on the basis of all direct aids on the basis of Council Regulation (EC) No 73/2009, after modulation and phasing-in, except POSEI/SAI and cotton and potentially eligible area 2009 ** Calculated on the basis of Annex II to DP proposal for claim year 2019 (budget year 2020) and potentially eligible area (PEA) 2009 Source: European Commission - DG Agriculture and Rural Development 7
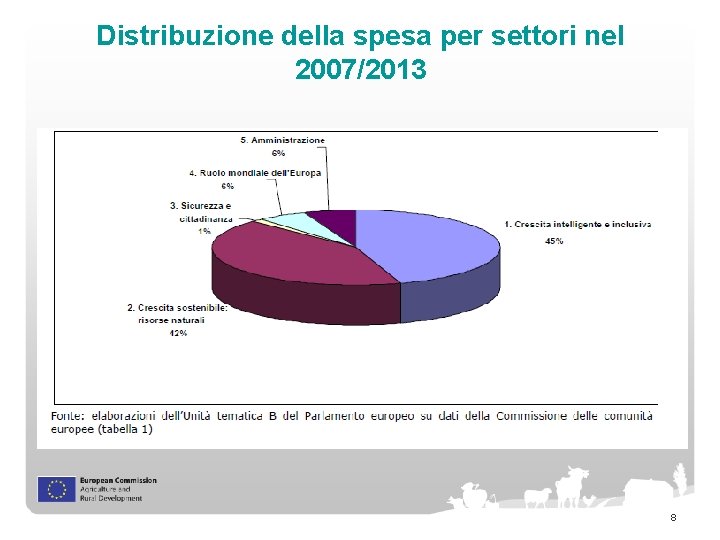
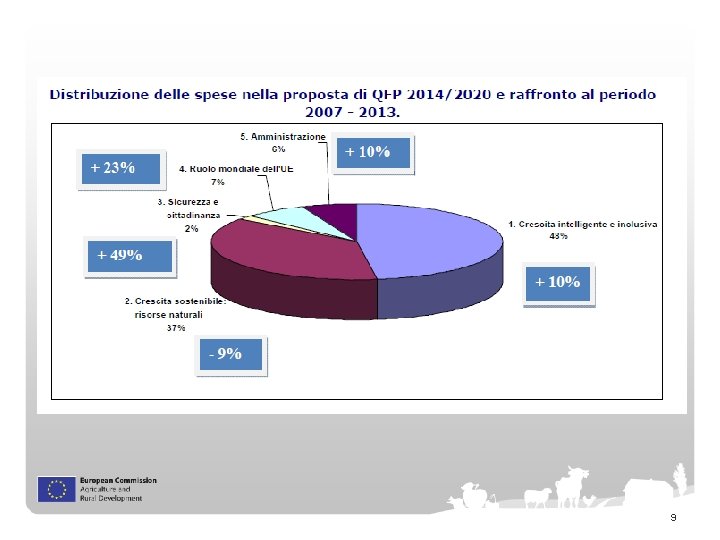
Distribuzione della spesa per settori nel 2007/2013 8
9
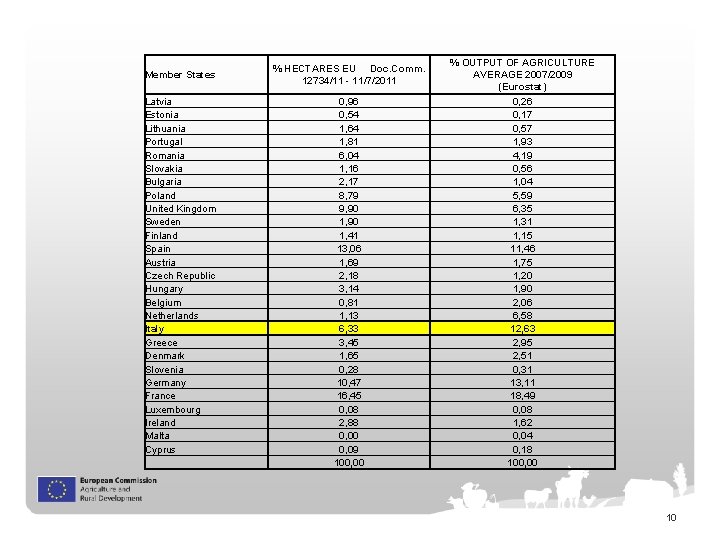
Member States % HECTARES EU Doc. Comm. 12734/11 - 11/7/2011 Latvia Estonia Lithuania Portugal Romania Slovakia Bulgaria Poland United Kingdom Sweden Finland Spain Austria Czech Republic Hungary Belgium Netherlands Italy Greece Denmark Slovenia Germany France Luxembourg Ireland Malta Cyprus 0, 96 0, 54 1, 64 1, 81 6, 04 1, 16 2, 17 8, 79 9, 90 1, 41 13, 06 1, 69 2, 18 3, 14 0, 81 1, 13 6, 33 3, 45 1, 65 0, 28 10, 47 16, 45 0, 08 2, 88 0, 00 0, 09 100, 00 % OUTPUT OF AGRICULTURE AVERAGE 2007/2009 (Eurostat) 0, 26 0, 17 0, 57 1, 93 4, 19 0, 56 1, 04 5, 59 6, 35 1, 31 1, 15 11, 46 1, 75 1, 20 1, 90 2, 06 6, 58 12, 63 2, 95 2, 51 0, 31 13, 11 18, 49 0, 08 1, 62 0, 04 0, 18 100, 00 10
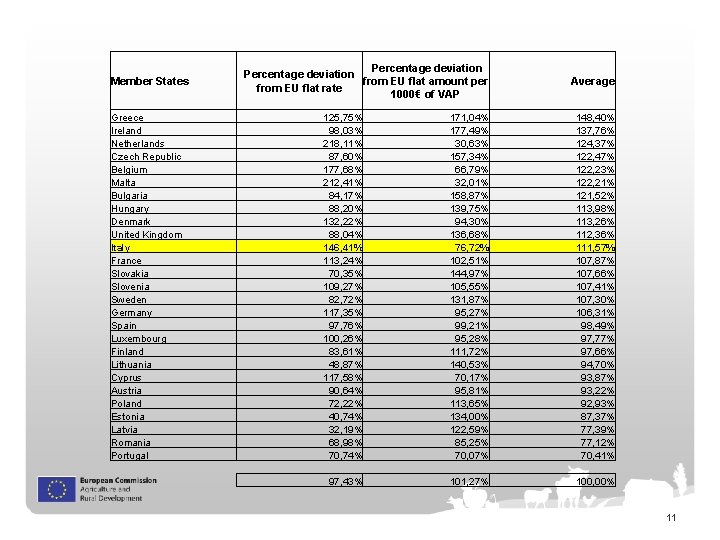
Member States Greece Ireland Netherlands Czech Republic Belgium Malta Bulgaria Hungary Denmark United Kingdom Italy France Slovakia Slovenia Sweden Germany Spain Luxembourg Finland Lithuania Cyprus Austria Poland Estonia Latvia Romania Portugal Percentage deviation from EU flat amount per from EU flat rate 1000€ of VAP Average 125, 75% 98, 03% 218, 11% 87, 60% 177, 68% 212, 41% 84, 17% 88, 20% 132, 22% 88, 04% 146, 41% 113, 24% 70, 35% 109, 27% 82, 72% 117, 35% 97, 76% 100, 26% 83, 61% 48, 87% 117, 58% 90, 64% 72, 22% 40, 74% 32, 19% 68, 98% 70, 74% 171, 04% 177, 49% 30, 63% 157, 34% 66, 79% 32, 01% 158, 87% 139, 75% 94, 30% 136, 68% 76, 72% 102, 51% 144, 97% 105, 55% 131, 87% 95, 27% 99, 21% 95, 28% 111, 72% 140, 53% 70, 17% 95, 81% 113, 65% 134, 00% 122, 59% 85, 25% 70, 07% 148, 40% 137, 76% 124, 37% 122, 47% 122, 23% 122, 21% 121, 52% 113, 98% 113, 26% 112, 36% 111, 57% 107, 87% 107, 66% 107, 41% 107, 30% 106, 31% 98, 49% 97, 77% 97, 66% 94, 70% 93, 87% 93, 22% 92, 93% 87, 37% 77, 39% 77, 12% 70, 41% 97, 43% 101, 27% 100, 00% 11
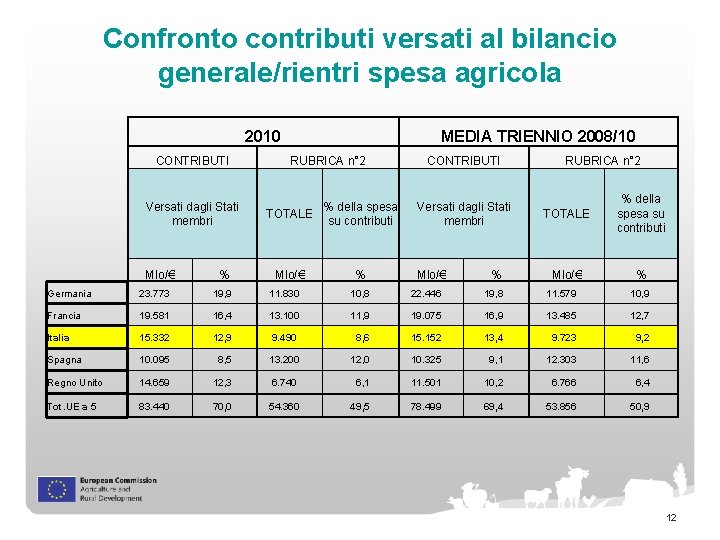
Confronto contributi versati al bilancio generale/rientri spesa agricola 2010 CONTRIBUTI Versati dagli Stati membri Mlo/€ % MEDIA TRIENNIO 2008/10 RUBRICA n° 2 CONTRIBUTI % della spesa TOTALE su contributi Mlo/€ % Versati dagli Stati membri Mlo/€ % RUBRICA n° 2 TOTALE % della spesa su contributi Mlo/€ % Germania 23. 773 19, 9 11. 830 10, 8 22. 446 19, 8 11. 579 10, 9 Francia 19. 581 16, 4 13. 100 11, 9 19. 075 16, 9 13. 485 12, 7 15. 332 12, 9 8, 6 15. 152 13, 4 9. 723 9, 2 Spagna 10. 095 8, 5 13. 200 12, 0 10. 325 9, 1 12. 303 11, 6 Regno Unito 14. 659 12, 3 6. 740 6, 1 11. 501 10, 2 6. 766 6, 4 Tot. UE a 5 83. 440 70, 0 54. 360 49, 5 78. 499 69, 4 53. 856 50, 9 Italia 9. 490 12
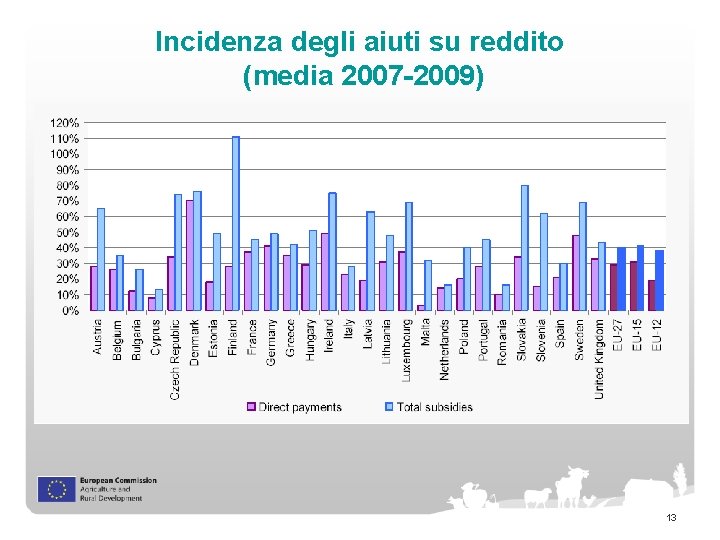
Incidenza degli aiuti su reddito (media 2007 -2009) 13
- Slides: 13