II The light reactions of photosynthesis Objectives are
 Variation in energy")
II. The light reactions of photosynthesis Objectives are to understand: 1) Variation in energy of different forms of light 2) Light absorption by photosynthetic pigments 3) Energy transduction - conversion of light energy 4) to chemical energy as ATP and NADPH

Why did we calculate the energy of a photon or mole of photons? • This is the energy that is absorbed by plants and used to power photosynthesis! • It is the energy of each photon, the quantum energy, that slams into the photosynthetic pigments and excites raises the energy state - of electrons. • We need to know the input of energy to understand the energetics of photosynthesis. e. g. How efficient is photosynthesis? efficiency = energy output/energy input

1. Light absorption by photosynthetic pigments

Fig 7. 15

grana lamellae Fig 7. 16

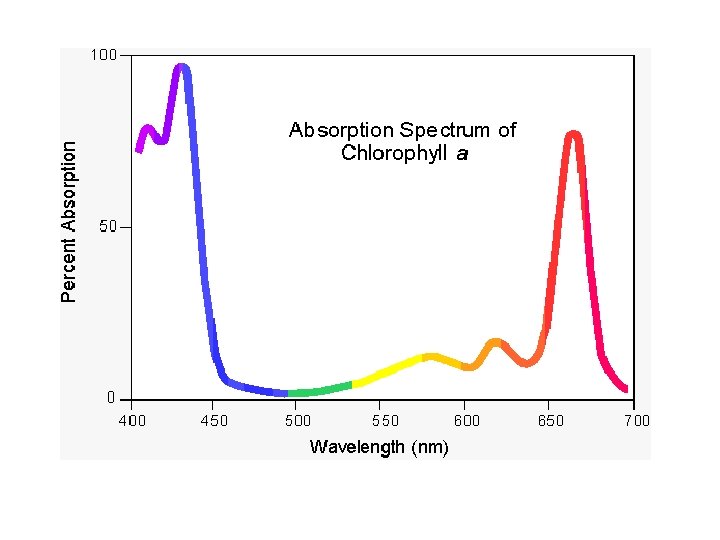
Light absorption by photosynthetic pigments • Much of the light energy reaching Earth’s surface is in the visible portion of the EMR spectrum. • Chlorophyll absorbs strongly in this region of the spectrum. Fig. 7. 3
 2. carotenoids Fig. 7.")
Photosynthetic pigments of higher plants 1. chlorophylls (a & b) 2. carotenoids Fig. 7. 6

The interaction of photosynthetic pigments Antennae transfer light energy to reaction centers
 Energy transduction - conversion of light energy to chemical energy as ATP and")
3) Energy transduction - conversion of light energy to chemical energy as ATP and NADPH a. Absorption and action spectra b. Key experiments in understanding the light reactions c. The “Z scheme” of electron transfer and energy capture. d. Putting it all together - organization of the light harvesting antennas and photochemical reaction centers.

a. absorption and action spectra How light absorption characteristics are measured. Measuring an absorption spectrum using a spectrophotometer Fig. 7. 4 (blue or green or red, etc. )

High Fig. 7. 7 2 = chl a 3 = chl b 5 = beta carotene Low
 of")
Action spectra describe the relationship of the effect (e. g. O 2 production) of light absorption to wavelength.

An early action spectrum using a bioassay. Engelmann, 1800 s Fig. 7. 9

Pond scum or a beautiful green alga?

b. Key experiments in understanding the light reactions Emerson-Arnold expt. 1932 O 2 production depended on amount of light. Highest efficiency at low light “quantum yield” O 2 production saturated at high light. Fig. 7. 11 One O 2 was produced per 2500 chlorophyll molecules.

“Quantum yield” is the term given to describe the maximum yield of O 2 per photons absorbed by the leaf (or extracted chloroplast preparations). It is equal to the slope of the photosynthetic light response curve at low light levels. The quantum yield is an efficiency term: Efficiency = output (O 2 production) input (light absorbed)

The “red drop” experiments - Emerson again. Observation: Quantum yield dropped off sharply beyond 680 nm. Why was efficiency reduced greatly in the “far red” portion of the spectrum (beyond 680 nm or so)?

Red drop experiments suggested that the energy in light particles beyond the red portion of the spectrum was insufficient to drive photosynthesis.

Emerson “enhancement effect” Far red and red light separately gave same rate of O 2 production. Both given together gave much greater O 2 production. What could explain this behavior? Fig. 7. 13

Emerson’s “enhancement effect” experiments suggested the existence of two interacting photosystems with different wavelength optima.
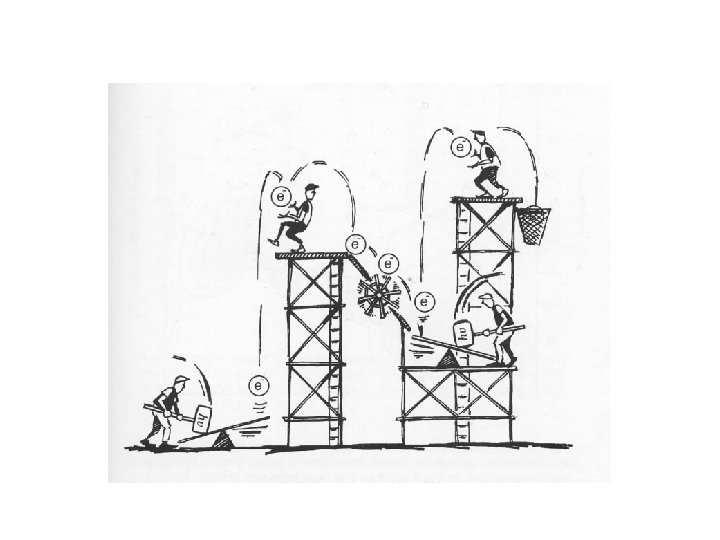

c. The “Z scheme” of electron transfer and energy capture. Fig. 7. 14
- Slides: 23