II Energy Flow Through An Ecosystem A Main


 must obtain food from their environment 1. Herbivores - Eat plants/producers")

 relationships: 1. Direction of energy flow: sun producers consumers decomposers 2.")


- Slides: 10
II. Energy Flow Through An Ecosystem A. Main source of energy for life on Earth is sunlight B. Producers (autotrophs) use energy to make their own food 1. Plants, some protists (such as algae) and some bacteria are producers. 2. Photosynthesis: Uses sun’s energy to make their own food sunlight CO 2 + H 2 O Glucose + O 2
3. Chemosynthesis: Uses substances from environment to make food H 2 S + CO 2 + O 2 Carbohydrates + Sulfur compounds • performed by extremophiles found in marshes, hot springs, ocean vents, etc.
C. Consumers (heterotrophs) must obtain food from their environment 1. Herbivores - Eat plants/producers Ex. Cow 2. Carnivores - Eat meat a. Predators: hunt & kill their food (prey) Ex. Lion, Owl b. Scavengers: eat dead animals they find Ex. Vultures 3. Omnivores - Eat both plants and meat Ex. Humans
4. Decomposers Secrete enzymes to break down, absorb, and RECYCLE organic matter (dead organisms and wastes nutrients in the soil) Ex. Bacteria, Mushroom 5. Detritivores Eat decaying remains of plants and animals (detritus) *Similar to decomposers, but more complex Ex. Snails, Earthworms, Crabs
D. Nutritional (feeding) relationships: 1. Direction of energy flow: sun producers consumers decomposers 2. Food Chain: Linear direction of energy flow Ex. energy SUN energy GRASSHOPPER …gets eaten by… SNAKE HAWK
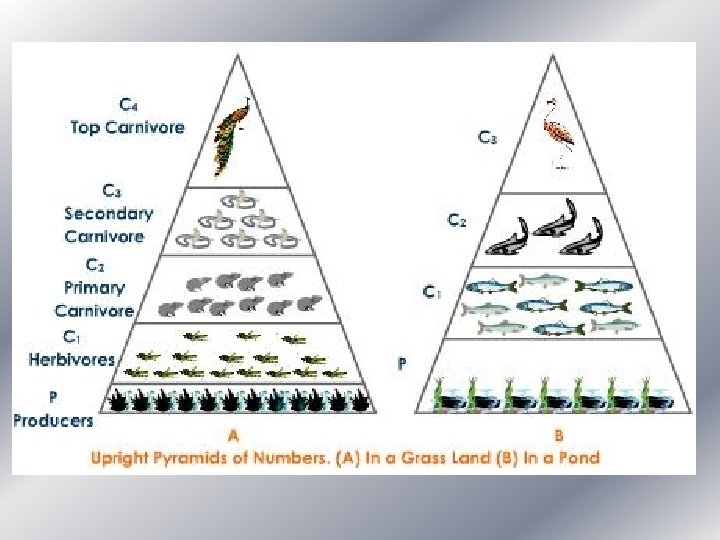
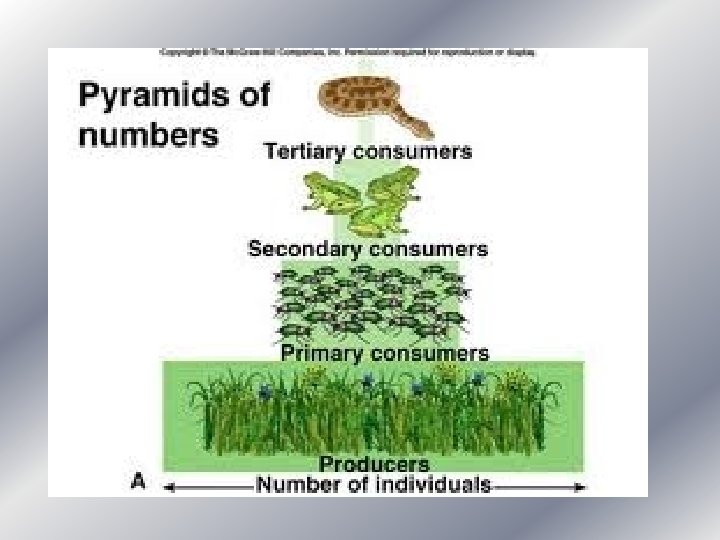
3. Food Web • Many interacting food chains within an ecosystem • More stable than a food chain because there are many possible directions for energy to flow. Ex. Raccoon Worm Hawk Frog Snake Grasshopper Grass Bacteria 4. Trophic levels: steps in a food chain/web Level 3 2 nd order consumers Level 2 1 st order consumers Level 1 producers
E. Ecological Pyramids: Show relative amounts of energy or matter within each trophic level of a food chain 1. Energy Pyramid - Organisms use about 90% of their stored energy and convert it to heat energy; only about 10% is passed on from one trophic level to the next. 90% heat energy 90% 1% original 2 nd order energy consumers 1 st order consumers producers 10% original energy 100% original energy
2. Biomass Pyramid - The total amount of living tissue in a trophic level (g/unit area). *indicates the amount of biomass needed for one trophic level to support the level above it.