
IGERT Sustainable Urban Infrastructure Anu Ramaswami Program Director
IGERT: Sustainable Urban Infrastructure Anu Ramaswami, Program Director College of Engineering John Brett, Health & Behavioral Sciences Debbi Main, Family Medicine Brian Muller, College of Architecture & Planning Paul Teske, School of Public Affairs University of Colorado Denver
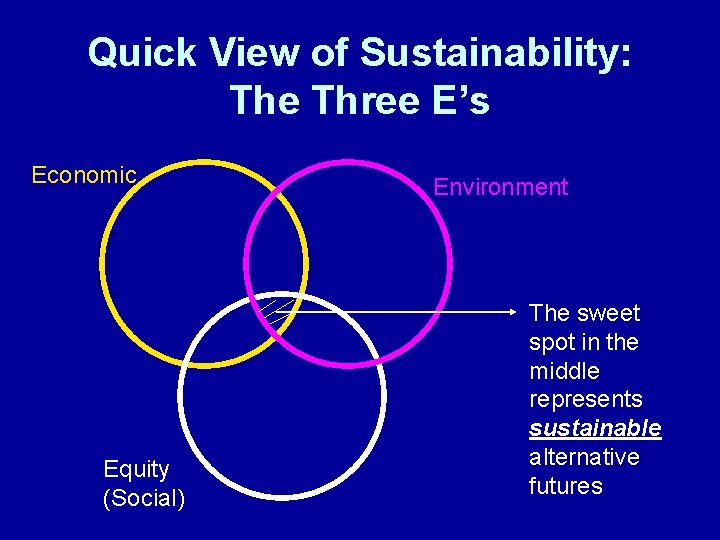
Quick View of Sustainability: The Three E’s Economic Equity (Social) Environment The sweet spot in the middle represents sustainable alternative futures
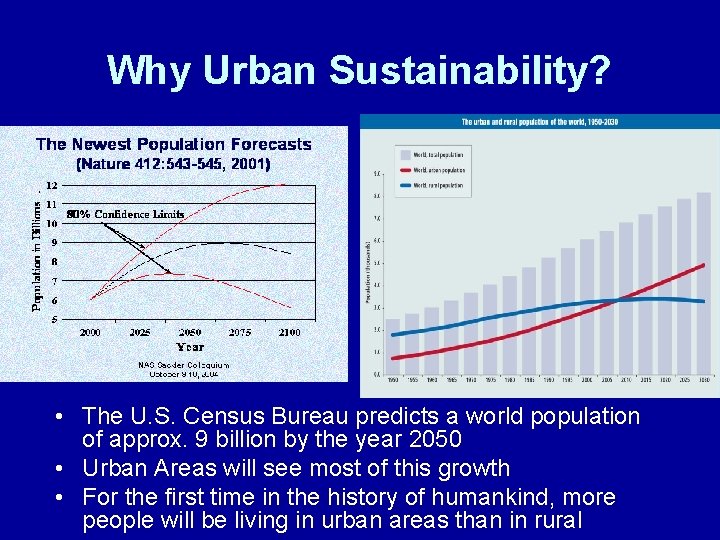
Why Urban Sustainability? • The U. S. Census Bureau predicts a world population of approx. 9 billion by the year 2050 • Urban Areas will see most of this growth • For the first time in the history of humankind, more people will be living in urban areas than in rural
Can we achieve urban sustainability?
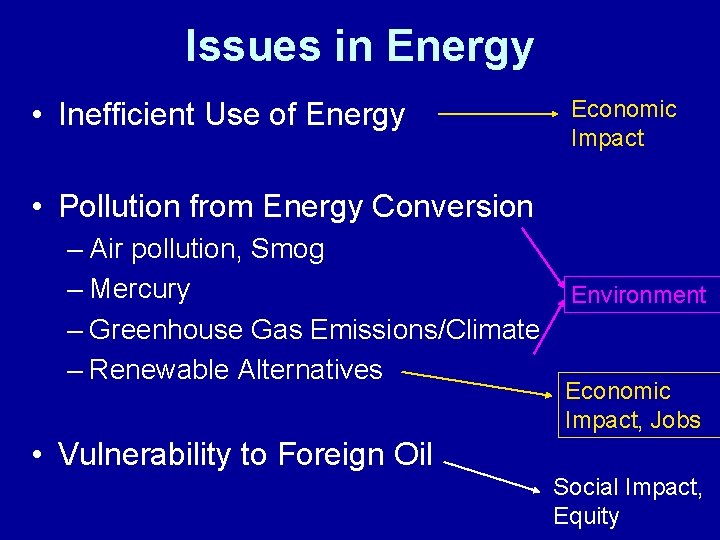
Issues in Energy • Inefficient Use of Energy Economic Impact • Pollution from Energy Conversion – Air pollution, Smog – Mercury – Greenhouse Gas Emissions/Climate – Renewable Alternatives Environment Economic Impact, Jobs • Vulnerability to Foreign Oil Social Impact, Equity
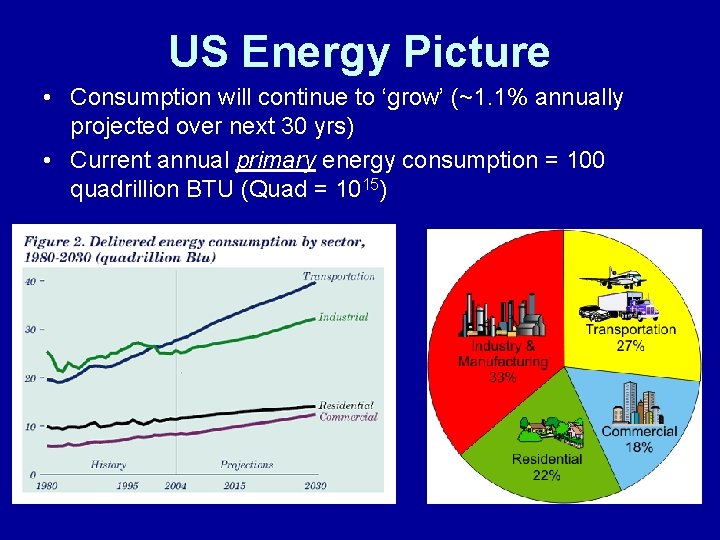
US Energy Picture • Consumption will continue to ‘grow’ (~1. 1% annually projected over next 30 yrs) • Current annual primary energy consumption = 100 quadrillion BTU (Quad = 1015)
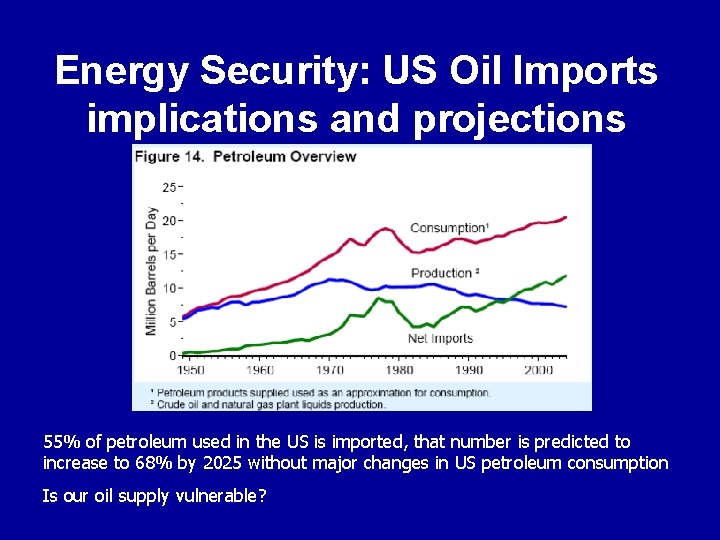
Energy Security: US Oil Imports implications and projections 55% of petroleum used in the US is imported, that number is predicted to increase to 68% by 2025 without major changes in US petroleum consumption Is our oil supply vulnerable?
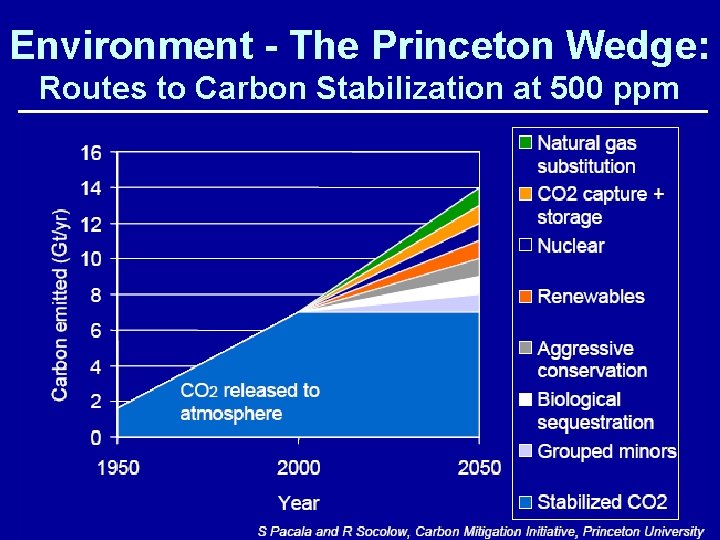
Environment - The Princeton Wedge: Routes to Carbon Stabilization at 500 ppm
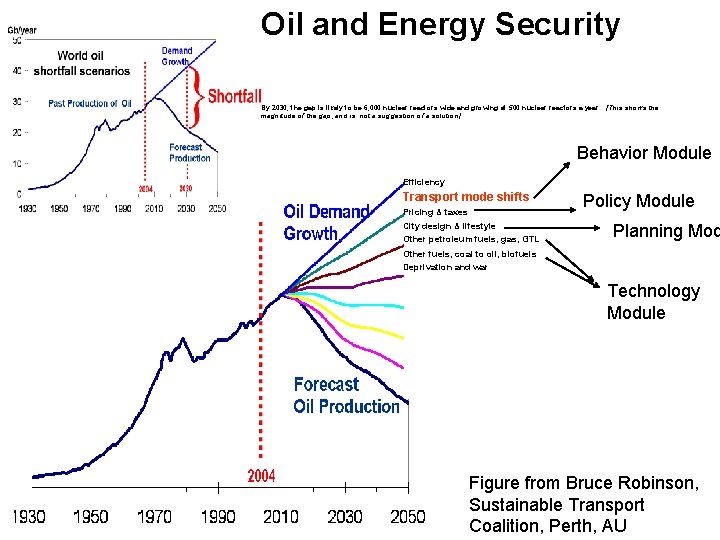
Oil and Energy Security By 2030, the gap is likely to be 6, 000 nuclear reactors wide and growing at 500 nuclear reactors a year. [This shows the magnitude of the gap, and is not a suggestion of a solution] Behavior Module Efficiency Transport mode shifts Pricing & taxes City design & lifestyle Other petroleum fuels, gas, GTL Policy Module Planning Mod Other fuels, coal to oil, biofuels Deprivation and war Technology Module Figure from Bruce Robinson, Sustainable Transport Coalition, Perth, AU
Sustainability Challenge • No single path, no silver bullet • Context and region is important – E. g. , water needs for biofuels • Unintended consequences – Food versus fuel debate, Pb vs GHG • Scale-up issues important – Battery use if all cars are electric • Public Engagement Needed – Efficiency, Conservation, Wind Sites, CCS, Water Reuse
Systems Tools Needed • Life Cycle Assessment – Environmental Impact over life cycle • Material Flow Analysis – Critical materials shortage globally • Carbon Accounting – Good accounting principles, benchmarking • Decision Support Tools – Trade-off between money, pollutants, etc. • Multi-Criteria Decision Analysis – Values explicit, policy applications • Public Engagement and Communication
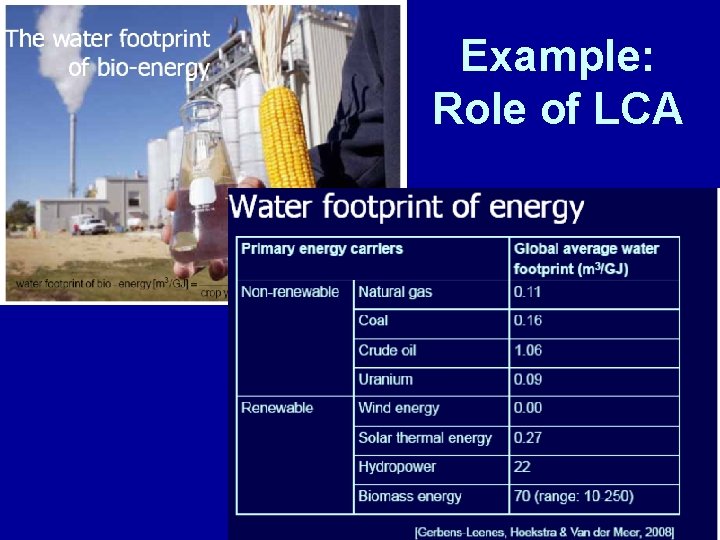
Example: Role of LCA
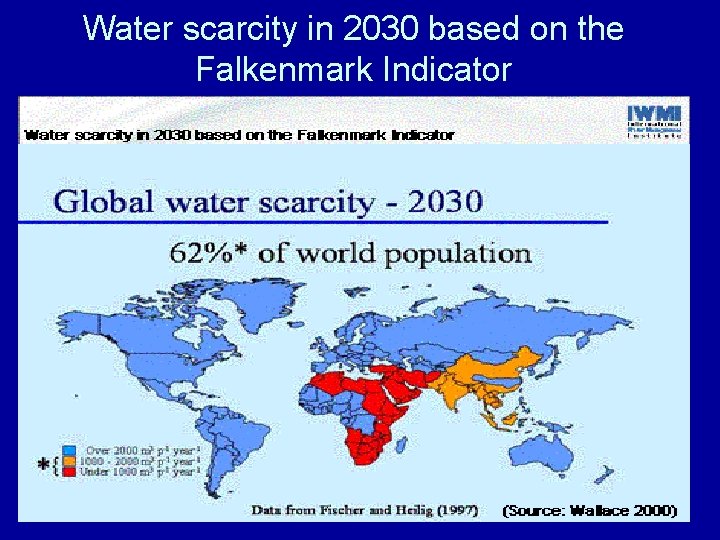
Water scarcity in 2030 based on the Falkenmark Indicator
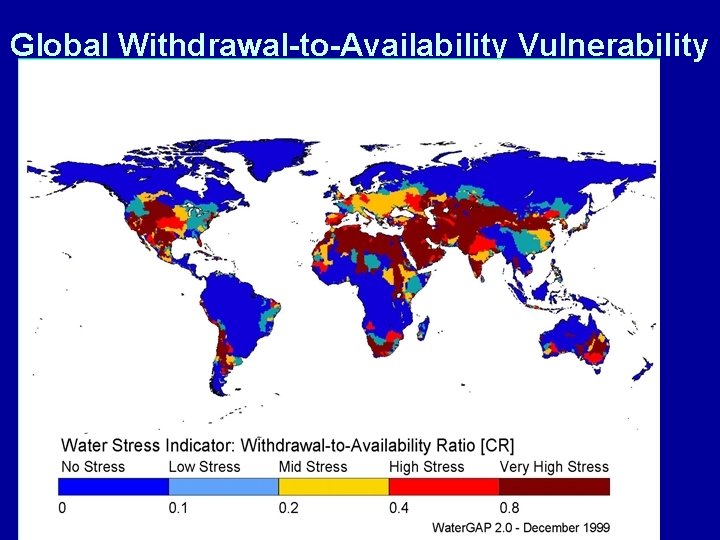
Global Withdrawal-to-Availability Vulnerability
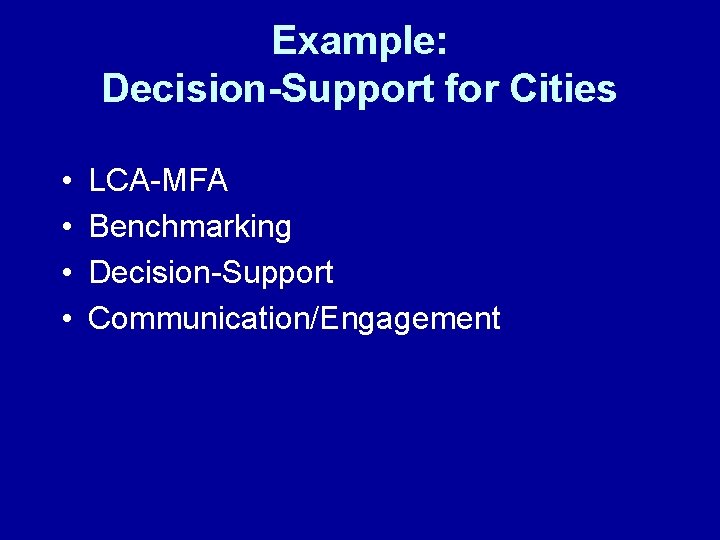
Example: Decision-Support for Cities • • LCA-MFA Benchmarking Decision-Support Communication/Engagement
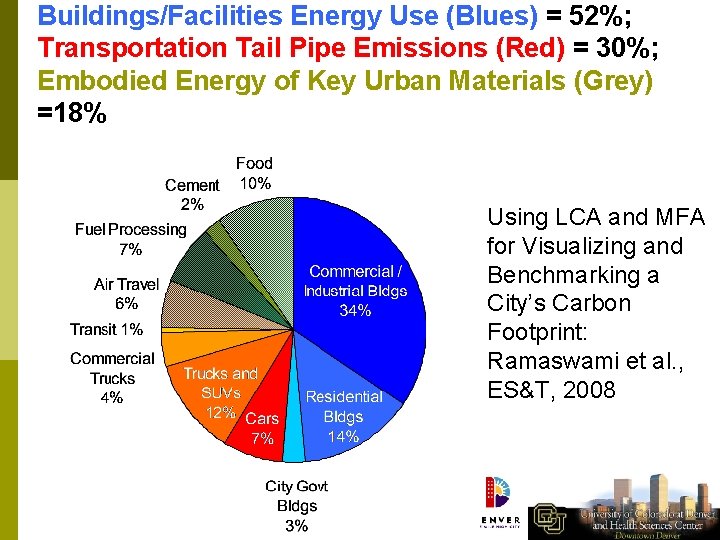
Buildings/Facilities Energy Use (Blues) = 52%; Transportation Tail Pipe Emissions (Red) = 30%; Embodied Energy of Key Urban Materials (Grey) =18% Using LCA and MFA for Visualizing and Benchmarking a City’s Carbon Footprint: Ramaswami et al. , ES&T, 2008
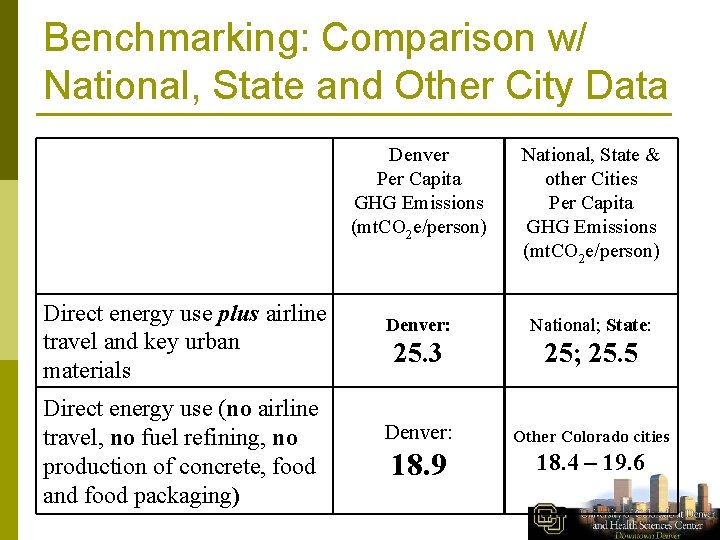
Benchmarking: Comparison w/ National, State and Other City Data Direct energy use plus airline travel and key urban materials Direct energy use (no airline travel, no fuel refining, no production of concrete, food and food packaging) Denver Per Capita GHG Emissions (mt. CO 2 e/person) National, State & other Cities Per Capita GHG Emissions (mt. CO 2 e/person) Denver: National; State: 25. 3 25; 25. 5 Denver: Other Colorado cities 18. 9 18. 4 – 19. 6
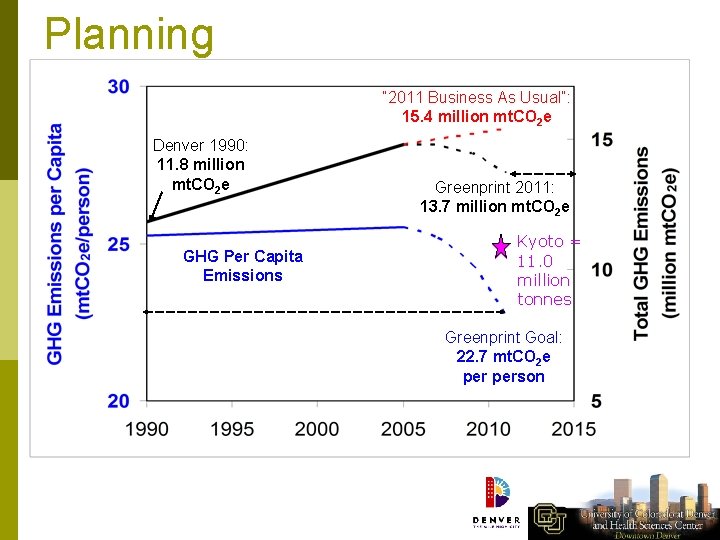
Planning “ 2011 Business As Usual”: 15. 4 million mt. CO 2 e Denver 1990: 11. 8 million mt. CO 2 e GHG Per Capita Emissions Greenprint 2011: 13. 7 million mt. CO 2 e Kyoto = 11. 0 million tonnes Greenprint Goal: 22. 7 mt. CO 2 e person
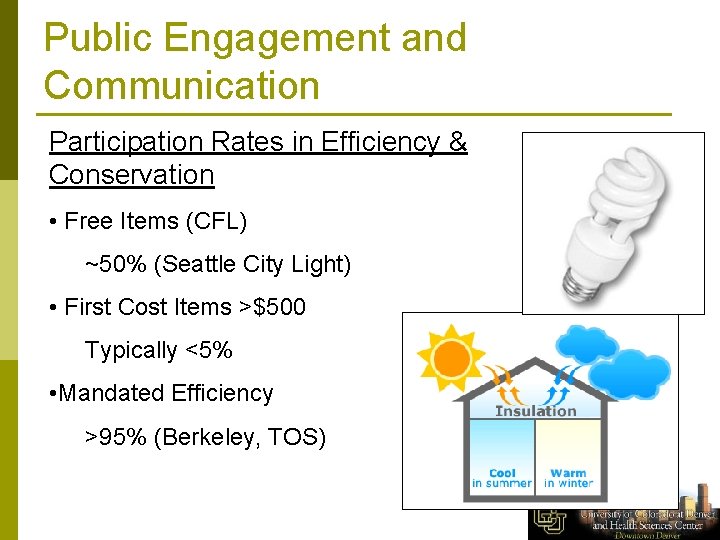
Public Engagement and Communication Participation Rates in Efficiency & Conservation • Free Items (CFL) ~50% (Seattle City Light) • First Cost Items >$500 Typically <5% • Mandated Efficiency >95% (Berkeley, TOS)
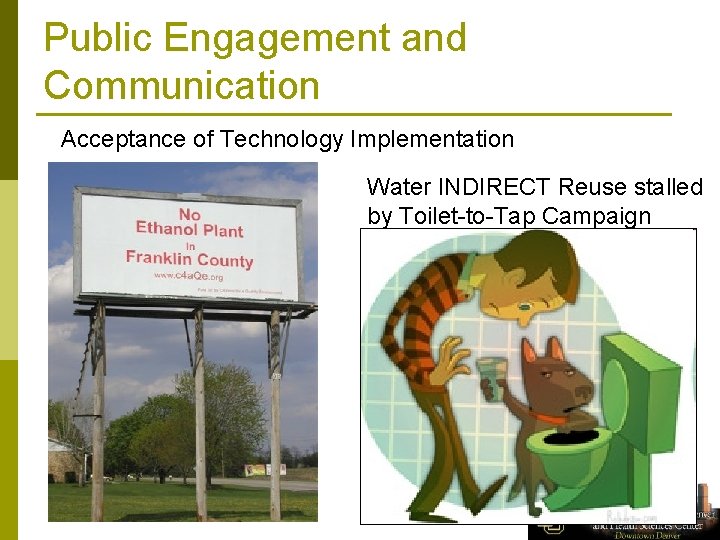
Public Engagement and Communication Acceptance of Technology Implementation Water INDIRECT Reuse stalled by Toilet-to-Tap Campaign
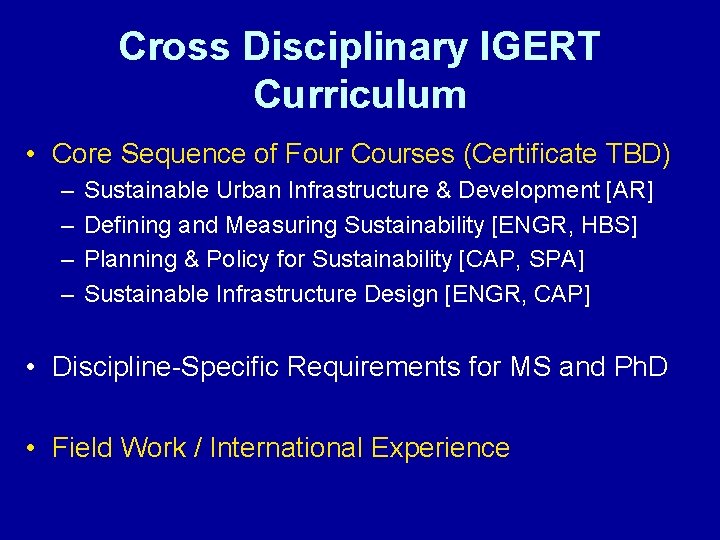
Cross Disciplinary IGERT Curriculum • Core Sequence of Four Courses (Certificate TBD) – – Sustainable Urban Infrastructure & Development [AR] Defining and Measuring Sustainability [ENGR, HBS] Planning & Policy for Sustainability [CAP, SPA] Sustainable Infrastructure Design [ENGR, CAP] • Discipline-Specific Requirements for MS and Ph. D • Field Work / International Experience

IGERT Fieldwork Partners • City & County of Denver • Indian Institute of Technology – Madras, Chennai, India • Parallel Sustainable Infrastructure Assessments in Denver and Chennai
- Slides: 22