If the CPU is so fast why are



- Slides: 43

If the CPU is so fast, why are the programs running so slowly? CS 614 Lecture – Fall 2007 – Thursday September 20, 2007 By Jonathan Winter

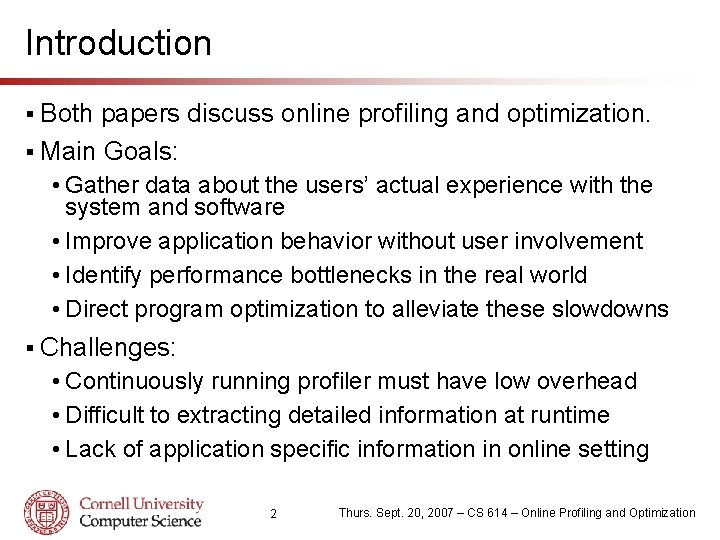
Introduction § Both papers discuss online profiling and optimization. § Main Goals: • Gather data about the users’ actual experience with the system and software • Improve application behavior without user involvement • Identify performance bottlenecks in the real world • Direct program optimization to alleviate these slowdowns § Challenges: • Continuously running profiler must have low overhead • Difficult to extracting detailed information at runtime • Lack of application specific information in online setting 2 Thurs. Sept. 20, 2007 – CS 614 – Online Profiling and Optimization

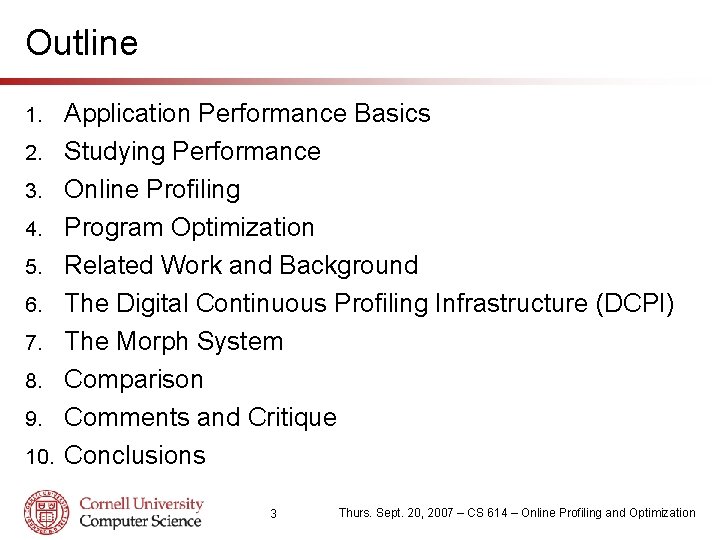
Outline 1. 2. 3. 4. 5. 6. 7. 8. 9. 10. Application Performance Basics Studying Performance Online Profiling Program Optimization Related Work and Background The Digital Continuous Profiling Infrastructure (DCPI) The Morph System Comparison Comments and Critique Conclusions 3 Thurs. Sept. 20, 2007 – CS 614 – Online Profiling and Optimization

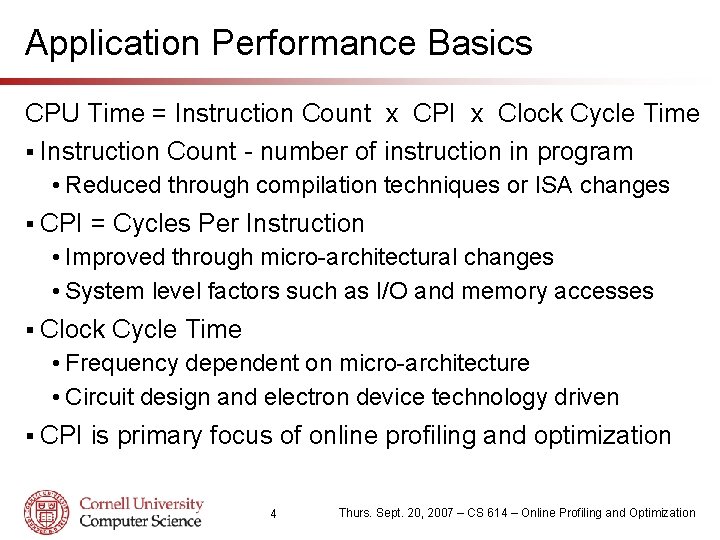
Application Performance Basics CPU Time = Instruction Count x CPI x Clock Cycle Time § Instruction Count - number of instruction in program • Reduced through compilation techniques or ISA changes § CPI = Cycles Per Instruction • Improved through micro-architectural changes • System level factors such as I/O and memory accesses § Clock Cycle Time • Frequency dependent on micro-architecture • Circuit design and electron device technology driven § CPI is primary focus of online profiling and optimization 4 Thurs. Sept. 20, 2007 – CS 614 – Online Profiling and Optimization

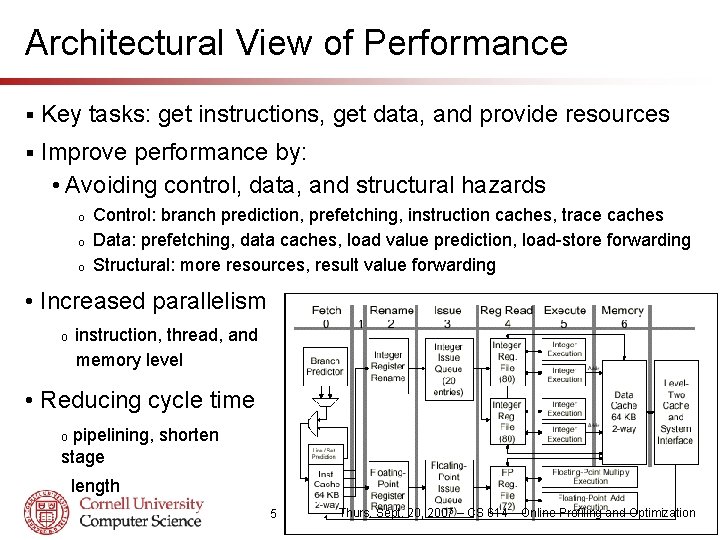
Architectural View of Performance § Key tasks: get instructions, get data, and provide resources § Improve performance by: • Avoiding control, data, and structural hazards o o o Control: branch prediction, prefetching, instruction caches, trace caches Data: prefetching, data caches, load value prediction, load-store forwarding Structural: more resources, result value forwarding • Increased parallelism o instruction, thread, and memory level • Reducing cycle time pipelining, shorten stage o length 5 Thurs. Sept. 20, 2007 – CS 614 – Online Profiling and Optimization

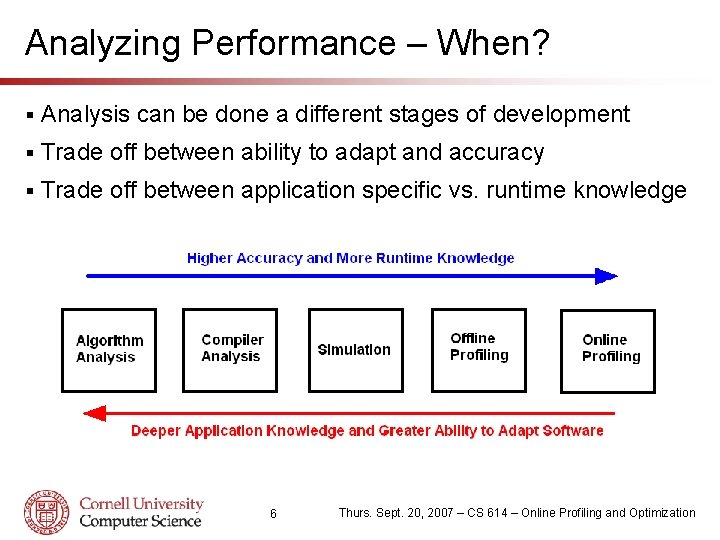
Analyzing Performance – When? § Analysis can be done a different stages of development § Trade off between ability to adapt and accuracy § Trade off between application specific vs. runtime knowledge 6 Thurs. Sept. 20, 2007 – CS 614 – Online Profiling and Optimization

Analyzing Performance – How? §A number of mechanisms can be used. • Static program analysis • Simulation - full system or CPU cycle accurate • Binary instrumentation • Performance counters • Operating system involvement § Major factors are: • Accuracy vs. Speed vs. Coverage • Overhead and behavior perturbation • Ease of implementation 7 Thurs. Sept. 20, 2007 – CS 614 – Online Profiling and Optimization

Online Profiling § Requires hardware and software support • Processor must monitor and track hardware events o Performance counters has become dominant method • Operating system or application must access counters o o Use special purpose registers/memory space Typically microprocessor vendors provide special libraries § Challenges: • Poor portability across hardware platforms and OS • Continuous profiling requires low overhead o Gathering, moving, and processing data can have high cost • Source code and application information not available o Makes analyzing performance bottlenecks difficult. • Transparent to system users 8 Thurs. Sept. 20, 2007 – CS 614 – Online Profiling and Optimization

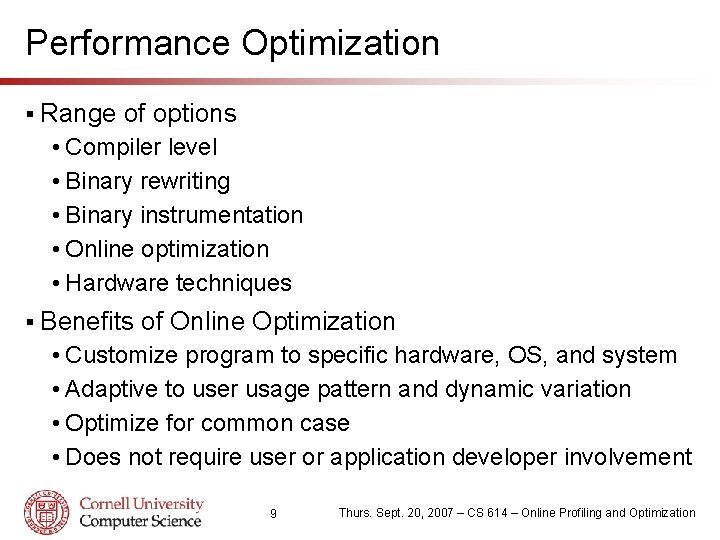
Performance Optimization § Range of options • Compiler level • Binary rewriting • Binary instrumentation • Online optimization • Hardware techniques § Benefits of Online Optimization • Customize program to specific hardware, OS, and system • Adaptive to user usage pattern and dynamic variation • Optimize for common case • Does not require user or application developer involvement 9 Thurs. Sept. 20, 2007 – CS 614 – Online Profiling and Optimization

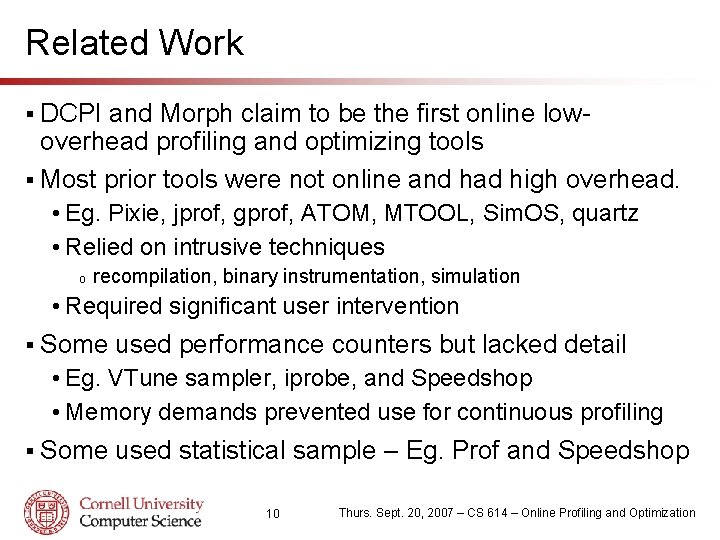
Related Work § DCPI and Morph claim to be the first online lowoverhead profiling and optimizing tools § Most prior tools were not online and had high overhead. • Eg. Pixie, jprof, gprof, ATOM, MTOOL, Sim. OS, quartz • Relied on intrusive techniques o recompilation, binary instrumentation, simulation • Required significant user intervention § Some used performance counters but lacked detail • Eg. VTune sampler, iprobe, and Speedshop • Memory demands prevented use for continuous profiling § Some used statistical sample – Eg. Prof and Speedshop 10 Thurs. Sept. 20, 2007 – CS 614 – Online Profiling and Optimization

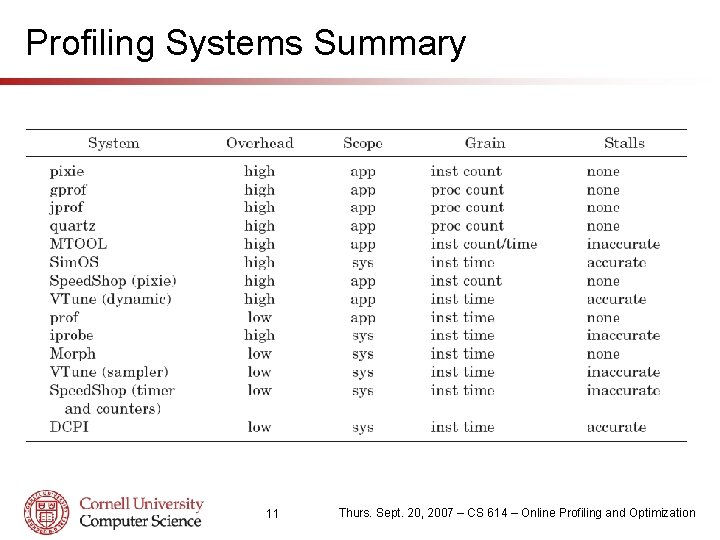
Profiling Systems Summary 11 Thurs. Sept. 20, 2007 – CS 614 – Online Profiling and Optimization

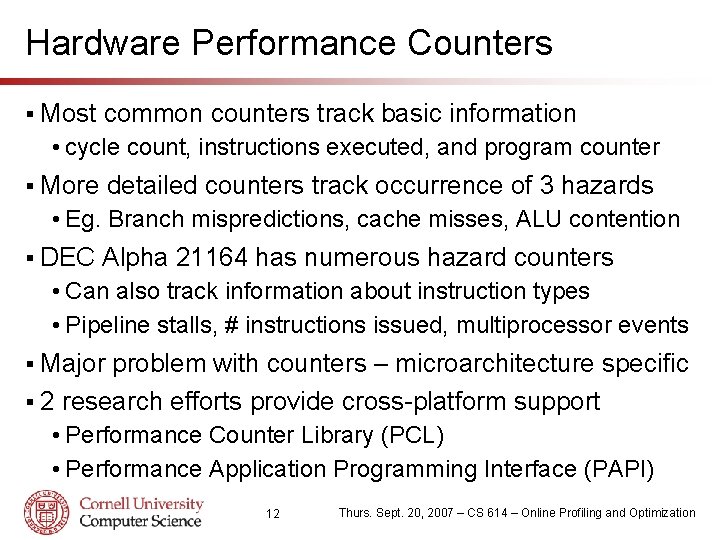
Hardware Performance Counters § Most common counters track basic information • cycle count, instructions executed, and program counter § More detailed counters track occurrence of 3 hazards • Eg. Branch mispredictions, cache misses, ALU contention § DEC Alpha 21164 has numerous hazard counters • Can also track information about instruction types • Pipeline stalls, # instructions issued, multiprocessor events § Major problem with counters – microarchitecture specific § 2 research efforts provide cross-platform support • Performance Counter Library (PCL) • Performance Application Programming Interface (PAPI) 12 Thurs. Sept. 20, 2007 – CS 614 – Online Profiling and Optimization

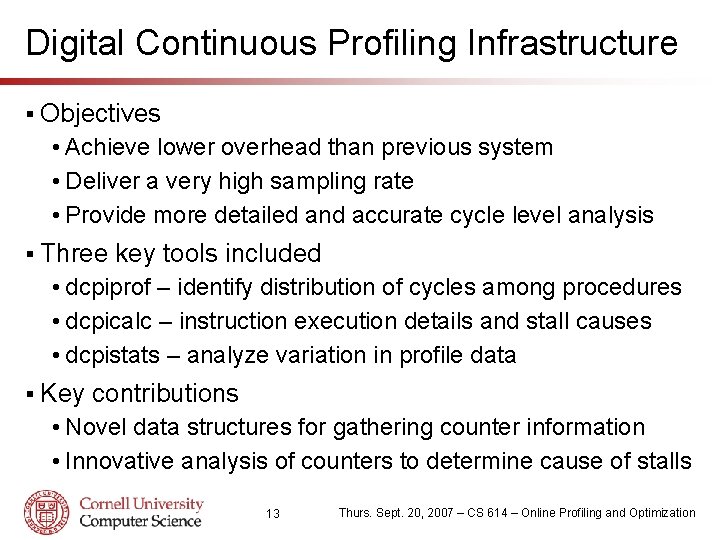
Digital Continuous Profiling Infrastructure § Objectives • Achieve lower overhead than previous system • Deliver a very high sampling rate • Provide more detailed and accurate cycle level analysis § Three key tools included • dcpiprof – identify distribution of cycles among procedures • dcpicalc – instruction execution details and stall causes • dcpistats – analyze variation in profile data § Key contributions • Novel data structures for gathering counter information • Innovative analysis of counters to determine cause of stalls 13 Thurs. Sept. 20, 2007 – CS 614 – Online Profiling and Optimization

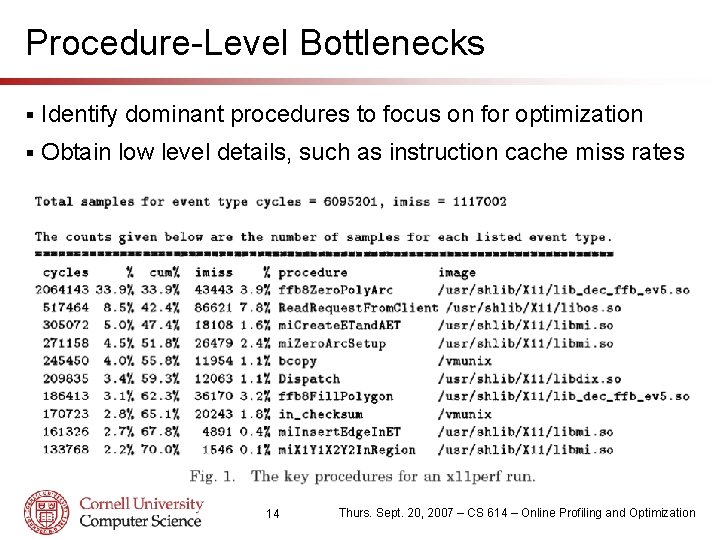
Procedure-Level Bottlenecks § Identify dominant procedures to focus on for optimization § Obtain low level details, such as instruction cache miss rates 14 Thurs. Sept. 20, 2007 – CS 614 – Online Profiling and Optimization

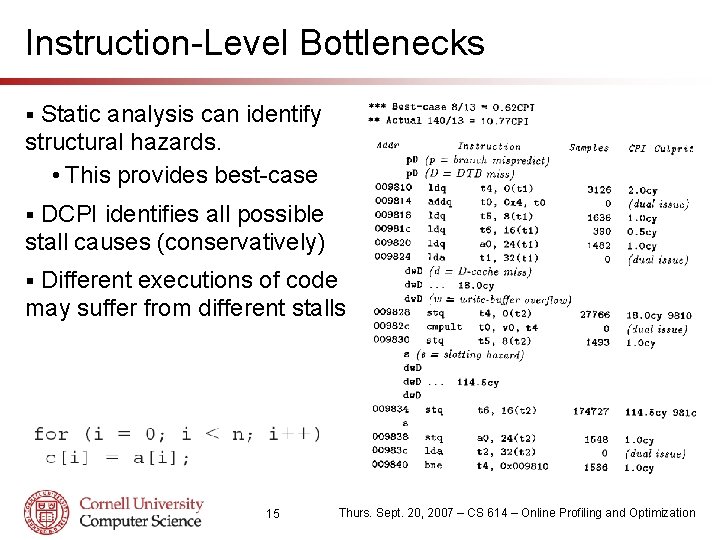
Instruction-Level Bottlenecks Static analysis can identify structural hazards. • This provides best-case § DCPI identifies all possible stall causes (conservatively) § Different executions of code may suffer from different stalls § 15 Thurs. Sept. 20, 2007 – CS 614 – Online Profiling and Optimization

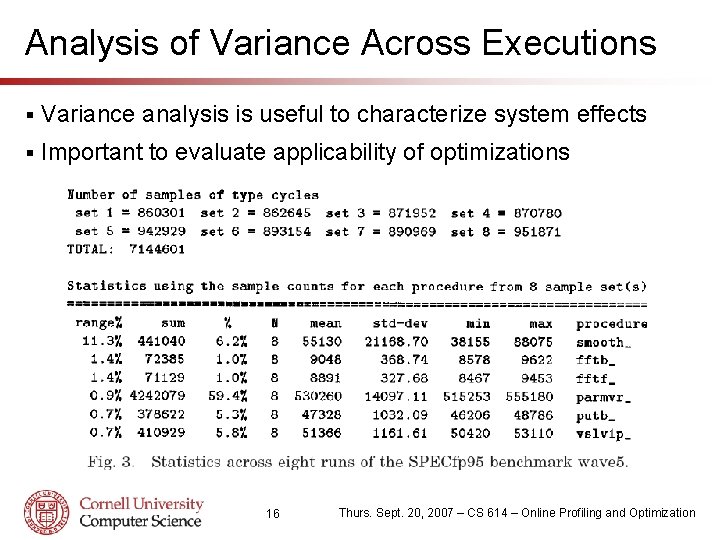
Analysis of Variance Across Executions § Variance analysis is useful to characterize system effects § Important to evaluate applicability of optimizations 16 Thurs. Sept. 20, 2007 – CS 614 – Online Profiling and Optimization

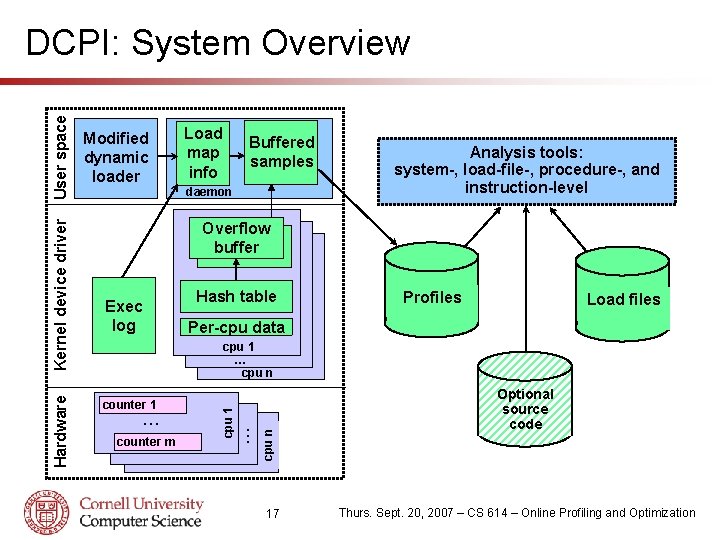
Modified dynamic loader Load map info Buffered samples daemon Analysis tools: system-, load-file-, procedure-, and instruction-level Overflow buffer Exec log Hash table Profiles Load files Per-cpu data . . . counter m . . . counter 1 cpu n cpu 1 … cpu n cpu 1 Hardware Kernel device driver User space DCPI: System Overview 17 Optional source code Thurs. Sept. 20, 2007 – CS 614 – Online Profiling and Optimization

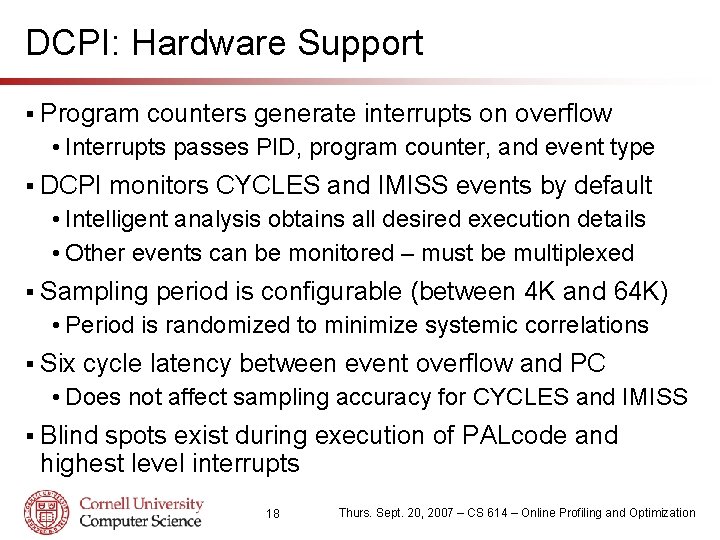
DCPI: Hardware Support § Program counters generate interrupts on overflow • Interrupts passes PID, program counter, and event type § DCPI monitors CYCLES and IMISS events by default • Intelligent analysis obtains all desired execution details • Other events can be monitored – must be multiplexed § Sampling period is configurable (between 4 K and 64 K) • Period is randomized to minimize systemic correlations § Six cycle latency between event overflow and PC • Does not affect sampling accuracy for CYCLES and IMISS § Blind spots exist during execution of PALcode and highest level interrupts 18 Thurs. Sept. 20, 2007 – CS 614 – Online Profiling and Optimization

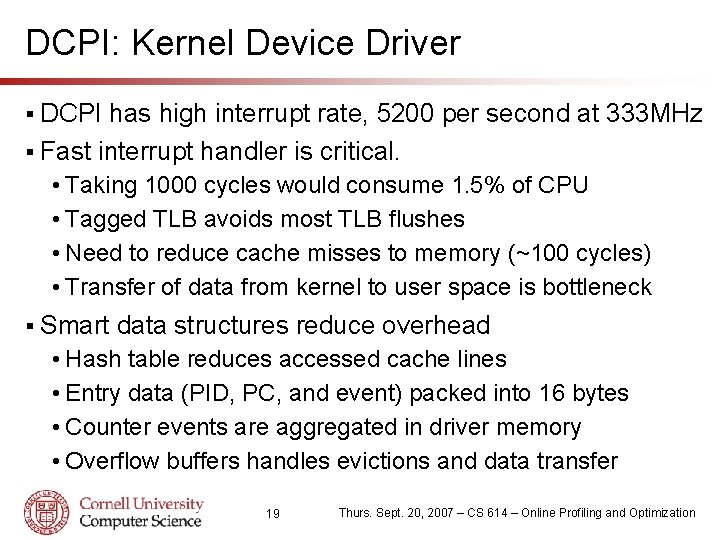
DCPI: Kernel Device Driver § DCPI has high interrupt rate, 5200 per second at 333 MHz § Fast interrupt handler is critical. • Taking 1000 cycles would consume 1. 5% of CPU • Tagged TLB avoids most TLB flushes • Need to reduce cache misses to memory (~100 cycles) • Transfer of data from kernel to user space is bottleneck § Smart data structures reduce overhead • Hash table reduces accessed cache lines • Entry data (PID, PC, and event) packed into 16 bytes • Counter events are aggregated in driver memory • Overflow buffers handles evictions and data transfer 19 Thurs. Sept. 20, 2007 – CS 614 – Online Profiling and Optimization

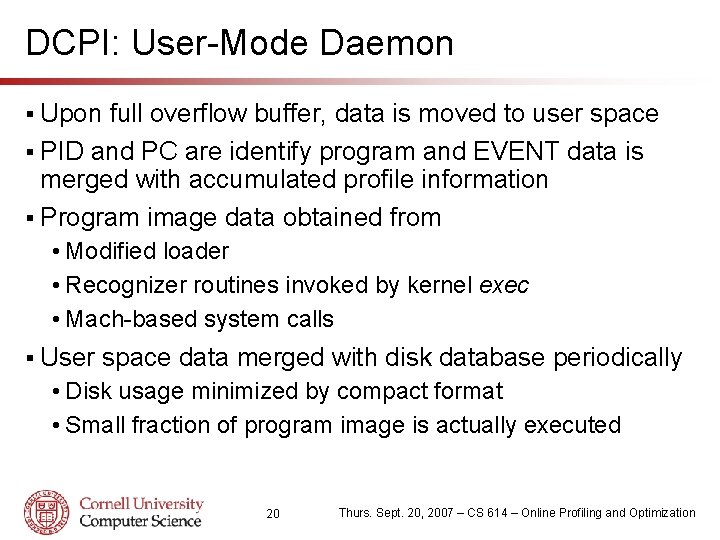
DCPI: User-Mode Daemon § Upon full overflow buffer, data is moved to user space § PID and PC are identify program and EVENT data is merged with accumulated profile information § Program image data obtained from • Modified loader • Recognizer routines invoked by kernel exec • Mach-based system calls § User space data merged with disk database periodically • Disk usage minimized by compact format • Small fraction of program image is actually executed 20 Thurs. Sept. 20, 2007 – CS 614 – Online Profiling and Optimization

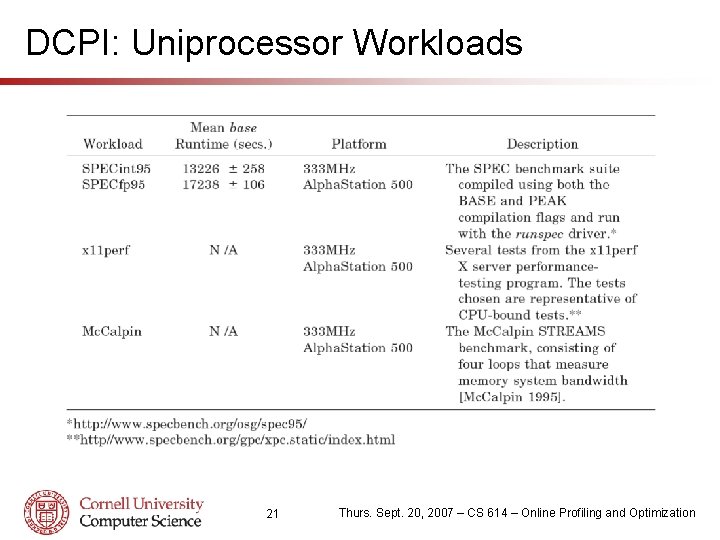
DCPI: Uniprocessor Workloads 21 Thurs. Sept. 20, 2007 – CS 614 – Online Profiling and Optimization

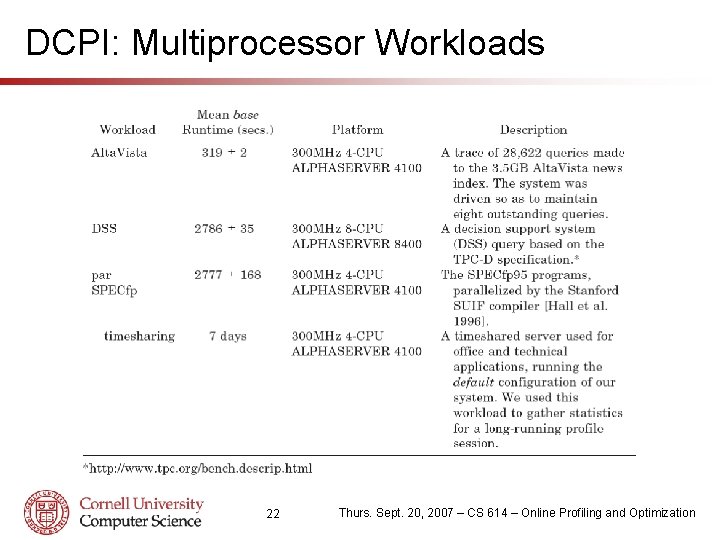
DCPI: Multiprocessor Workloads 22 Thurs. Sept. 20, 2007 – CS 614 – Online Profiling and Optimization

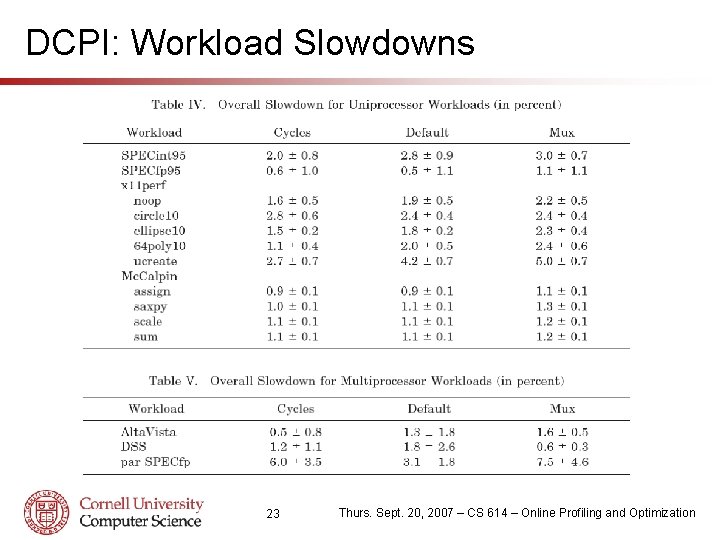
DCPI: Workload Slowdowns 23 Thurs. Sept. 20, 2007 – CS 614 – Online Profiling and Optimization

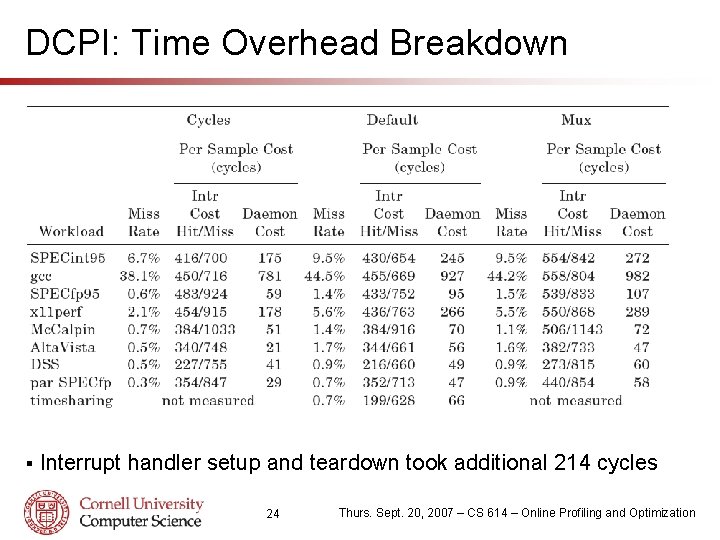
DCPI: Time Overhead Breakdown § Interrupt handler setup and teardown took additional 214 cycles 24 Thurs. Sept. 20, 2007 – CS 614 – Online Profiling and Optimization

DCPI: Space Overhead Breakdown Device driver has two 8 K entry overflow buffers and a 16 K entry hash table, totaling 512 KB of kernel memory. § 25 Thurs. Sept. 20, 2007 – CS 614 – Online Profiling and Optimization

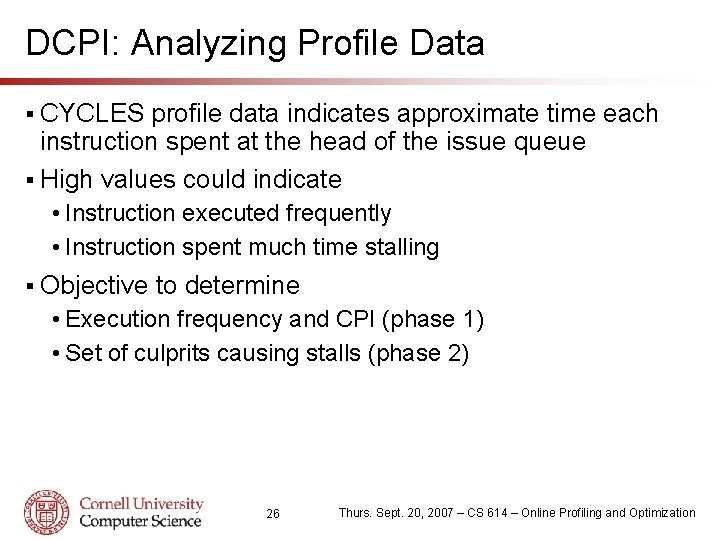
DCPI: Analyzing Profile Data § CYCLES profile data indicates approximate time each instruction spent at the head of the issue queue § High values could indicate • Instruction executed frequently • Instruction spent much time stalling § Objective to determine • Execution frequency and CPI (phase 1) • Set of culprits causing stalls (phase 2) 26 Thurs. Sept. 20, 2007 – CS 614 – Online Profiling and Optimization

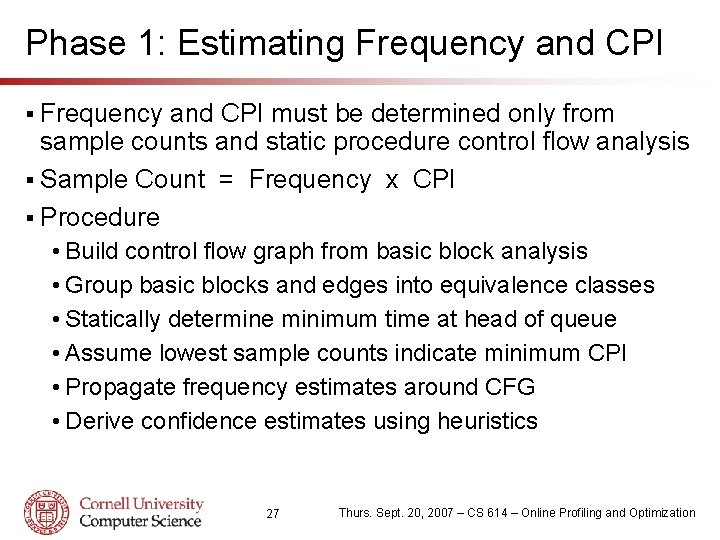
Phase 1: Estimating Frequency and CPI § Frequency and CPI must be determined only from sample counts and static procedure control flow analysis § Sample Count = Frequency x CPI § Procedure • Build control flow graph from basic block analysis • Group basic blocks and edges into equivalence classes • Statically determine minimum time at head of queue • Assume lowest sample counts indicate minimum CPI • Propagate frequency estimates around CFG • Derive confidence estimates using heuristics 27 Thurs. Sept. 20, 2007 – CS 614 – Online Profiling and Optimization

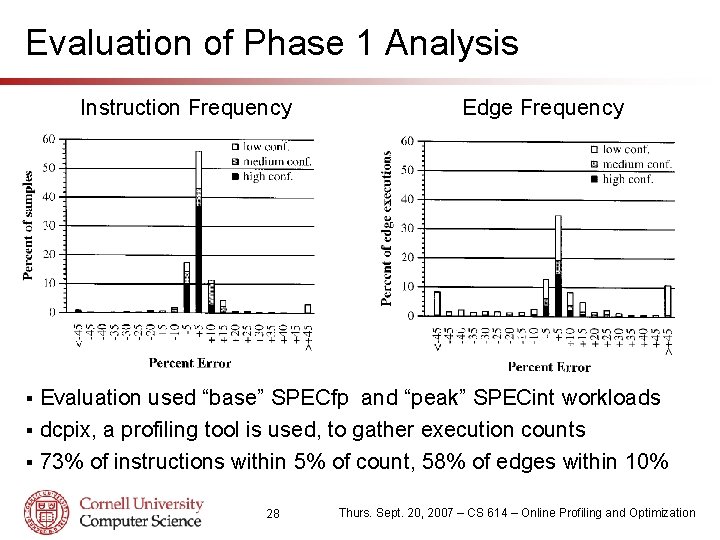
Evaluation of Phase 1 Analysis Instruction Frequency Edge Frequency Evaluation used “base” SPECfp and “peak” SPECint workloads § dcpix, a profiling tool is used, to gather execution counts § 73% of instructions within 5% of count, 58% of edges within 10% § 28 Thurs. Sept. 20, 2007 – CS 614 – Online Profiling and Optimization

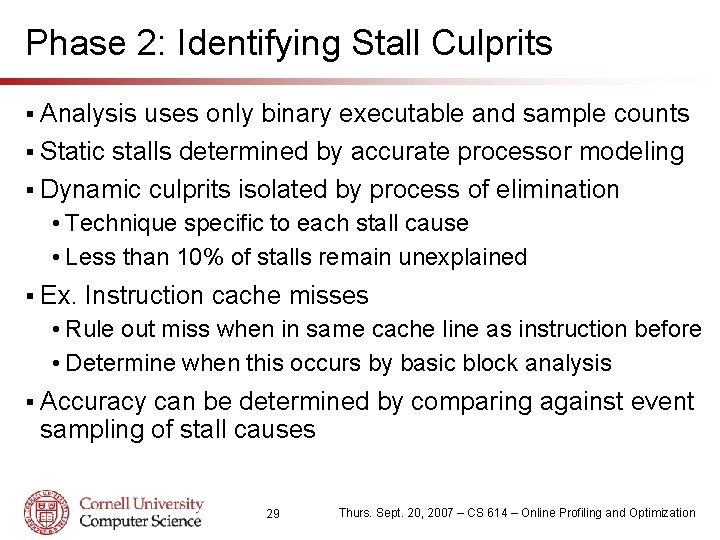
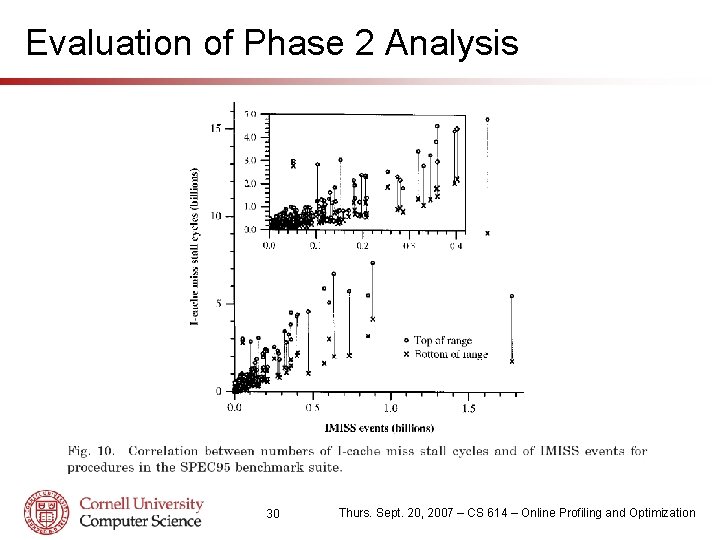
Phase 2: Identifying Stall Culprits § Analysis uses only binary executable and sample counts § Static stalls determined by accurate processor modeling § Dynamic culprits isolated by process of elimination • Technique specific to each stall cause • Less than 10% of stalls remain unexplained § Ex. Instruction cache misses • Rule out miss when in same cache line as instruction before • Determine when this occurs by basic block analysis § Accuracy can be determined by comparing against event sampling of stall causes 29 Thurs. Sept. 20, 2007 – CS 614 – Online Profiling and Optimization

Evaluation of Phase 2 Analysis 30 Thurs. Sept. 20, 2007 – CS 614 – Online Profiling and Optimization

The Morph System § Objectives • Provide user and machine specific optimization capability • Optimizations should not require source code • Profiling and optimization process should be transparent § Key Components • Morph Monitor – online gathering of counter information • Morph Manager – process and prepare data for optimization • Morph Editor – conducts optimizations on intermediate form § Contributions • Develops full system with code layout optimizations as case study 31 Thurs. Sept. 20, 2007 – CS 614 – Online Profiling and Optimization

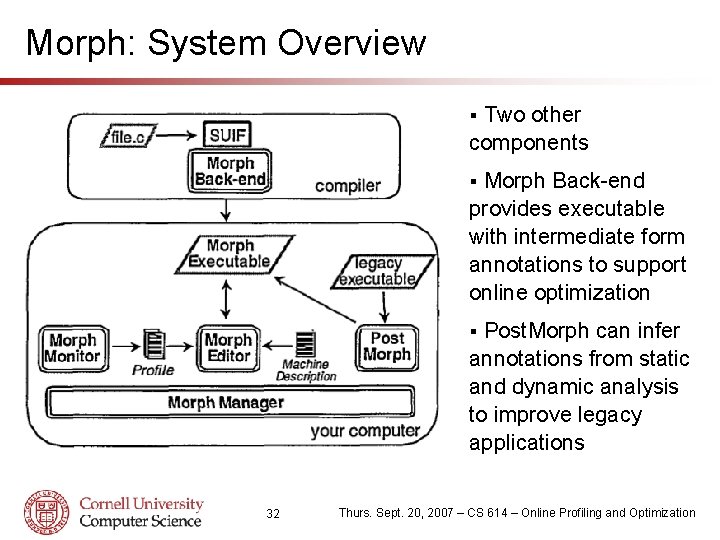
Morph: System Overview Two other components § Morph Back-end provides executable with intermediate form annotations to support online optimization § Post. Morph can infer annotations from static and dynamic analysis to improve legacy applications § 32 Thurs. Sept. 20, 2007 – CS 614 – Online Profiling and Optimization

The Morph Monitor § Program activity gauged by low-cost statistical sampling § Modified clock interrupt routine collects samples • Interrupt rate of 1024 Hz producing 8 byte samples • Claim that synchronization with clock is not deterimental § Monitor requires 256 KB of kernel memory • Transfer of data to Morph Manager occurs every 30 seconds § Small modifications to OS required • exec() and mmap() changed to provide address space data • exit() modified to log process termination events • Context switch information must also be logged 33 Thurs. Sept. 20, 2007 – CS 614 – Online Profiling and Optimization

The Morph Manager § Manager must compile sample data from multiple sample sets and execution modules § During program updates, sample data must be ignored § Program counter samples must be interpreted • Intermediate representation contains CFG information • PC samples are scaled for basic block size • Aggregate basic block execution profile is created § Morph does not compensate for CPI • Authors argue that time-based approach is not detrimental § Profiles from multiple inputs must be combined • Morph combines information weighted by execution length 34 Thurs. Sept. 20, 2007 – CS 614 – Online Profiling and Optimization

The Morph Editor § Implemented as a composition of SUIF compiler passes § Intermediate representation is modified low-level SUIF § Three code layout optimizations performed: • Branch alignment • Fluff removal • Procedure layout § Optimizations require basic block execution counts and CFG edge frequencies (calculated by Morph Editor) § Profile information used to optimize for common case § Optimization reduce control hazards such as branch mispredictions, misfetches, and improve cache locality 35 Thurs. Sept. 20, 2007 – CS 614 – Online Profiling and Optimization

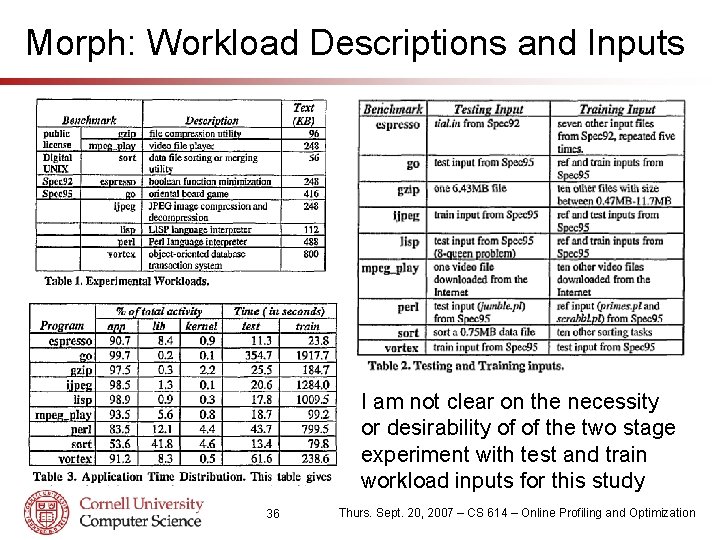
Morph: Workload Descriptions and Inputs I am not clear on the necessity or desirability of of the two stage experiment with test and train workload inputs for this study 36 Thurs. Sept. 20, 2007 – CS 614 – Online Profiling and Optimization

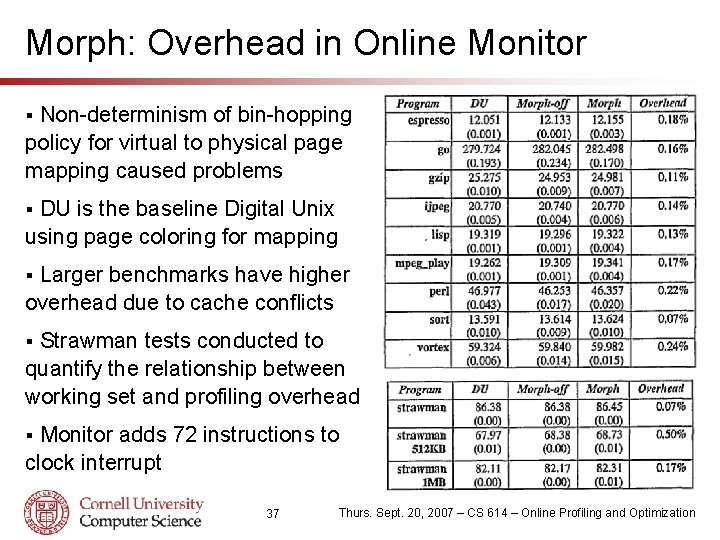
Morph: Overhead in Online Monitor Non-determinism of bin-hopping policy for virtual to physical page mapping caused problems § DU is the baseline Digital Unix using page coloring for mapping § Larger benchmarks have higher overhead due to cache conflicts § Strawman tests conducted to quantify the relationship between working set and profiling overhead § Monitor adds 72 instructions to clock interrupt § 37 Thurs. Sept. 20, 2007 – CS 614 – Online Profiling and Optimization

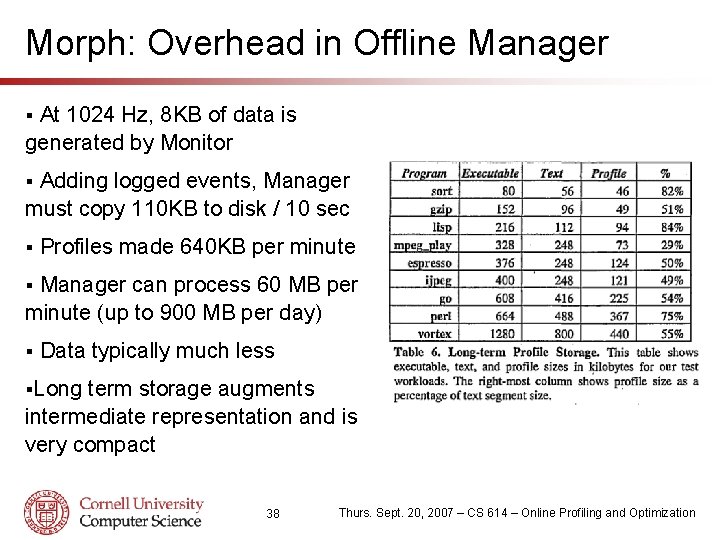
Morph: Overhead in Offline Manager At 1024 Hz, 8 KB of data is generated by Monitor § Adding logged events, Manager must copy 110 KB to disk / 10 sec § § Profiles made 640 KB per minute Manager can process 60 MB per minute (up to 900 MB per day) § § Data typically much less §Long term storage augments intermediate representation and is very compact 38 Thurs. Sept. 20, 2007 – CS 614 – Online Profiling and Optimization

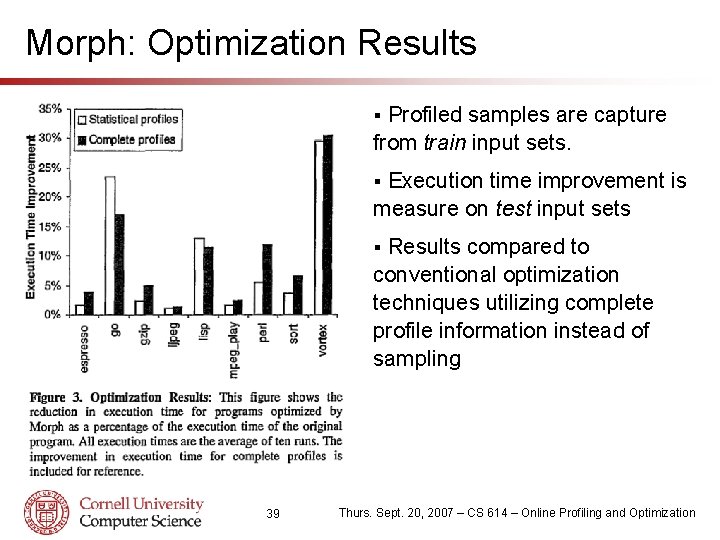
Morph: Optimization Results Profiled samples are capture from train input sets. § Execution time improvement is measure on test input sets § Results compared to conventional optimization techniques utilizing complete profile information instead of sampling § 39 Thurs. Sept. 20, 2007 – CS 614 – Online Profiling and Optimization

DCPI and Morph Comparison - Similarities § Both target DEC Alpha processors • Same available hardware and OS support (Digital Unix) § First two works proposing low overhead online profiling § Both employ statistical sampling of processor activity • Program counter samples provide bulk of insight § Common infrastructure design and division of labor • Light-weight kernel process for counter collection o Acts like device driver for performance counters • Slower user-mode daemon for processing data § Comparable performance • 1 -3% for DCPI (5 x faster sampling) and 0. 3% for Morph 40 Thurs. Sept. 20, 2007 – CS 614 – Online Profiling and Optimization

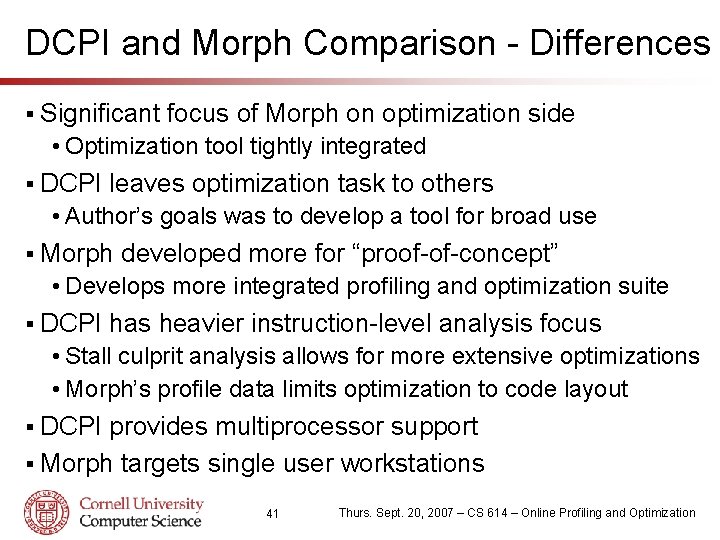
DCPI and Morph Comparison - Differences § Significant focus of Morph on optimization side • Optimization tool tightly integrated § DCPI leaves optimization task to others • Author’s goals was to develop a tool for broad use § Morph developed more for “proof-of-concept” • Develops more integrated profiling and optimization suite § DCPI has heavier instruction-level analysis focus • Stall culprit analysis allows for more extensive optimizations • Morph’s profile data limits optimization to code layout § DCPI provides multiprocessor support § Morph targets single user workstations 41 Thurs. Sept. 20, 2007 – CS 614 – Online Profiling and Optimization

Comments and Critique § Proposed methodology lacks portability • Profiling infrastructure tied to DEC Alpha and Digital Unix • Common infrastructure (PCL & PAPI) seem more promising § Ability to infer stall causes from PC counts limited to inorder processors • Out-of-order execution poses serious problem § Papers focus on processor core and memory hierarchy • Interconnect performance and I/O critical in multi-core § Would have liked to see more detail on optimization side • How is the profile and optimization cycle automated? 42 Thurs. Sept. 20, 2007 – CS 614 – Online Profiling and Optimization

Conclusions § Systems research must be reconciliated with performance profiling § Low-level architectural events are responsible for significant performance losses § Critical to consider low-level impact of OS/system design • OS level changes could affect pipeline stalls • Perceived gains or losses could be accidental side-effect § Are high level performance measurements of virtualization or μKernel overhead meaningful? § Performance results must be taken with grain of salt • Lots of salt, of many different origins 43 Thurs. Sept. 20, 2007 – CS 614 – Online Profiling and Optimization