If precipitation is nonuniform and rain gages are


 is used when the normal annual precipitation at any of")


- Slides: 20
If precipitation is nonuniform and rain gages are unevenly distributed within the area, the precipitation at each gauge may be weighted in proportion to the area the station is assumed to represent. Methods used to convert point rainfall values at different rain gauge stations into an average value over a catchment include Arithmetical Average Method Thiessen Polygon Method Isohyetal Method
Arithmetic Average Method • This technique calculates area precipitation using the arithmetic mean of all the point or area measurements considered in the analysis.
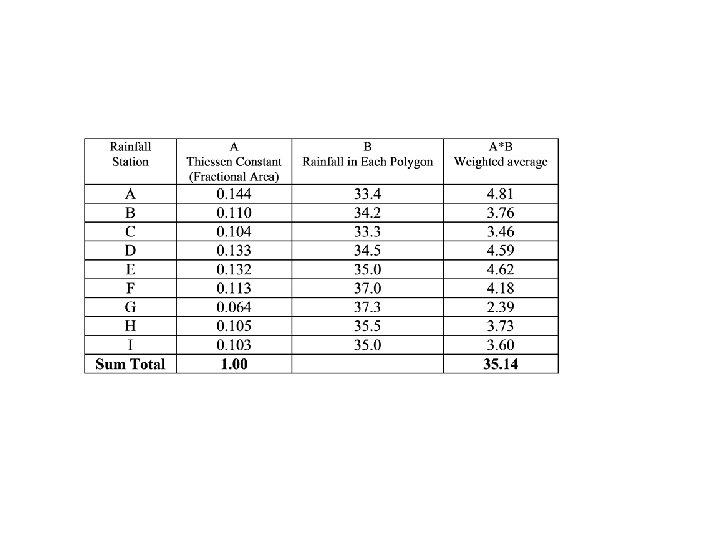
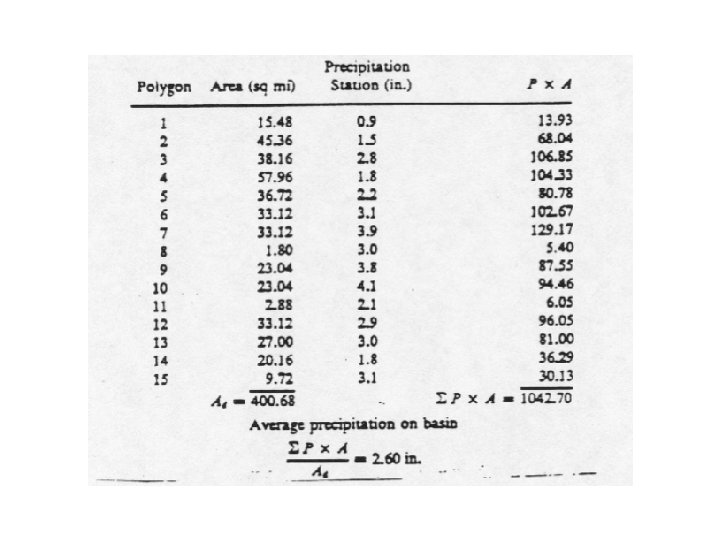
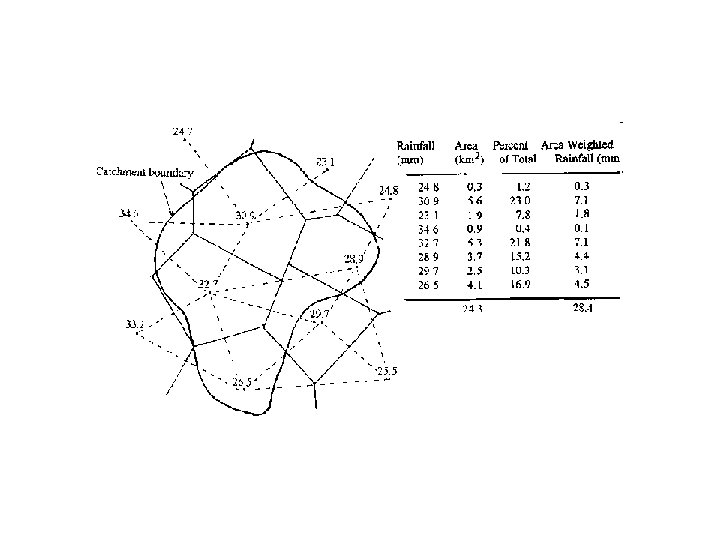
Thiessen Polygon Method
Thiessen Polygon Method
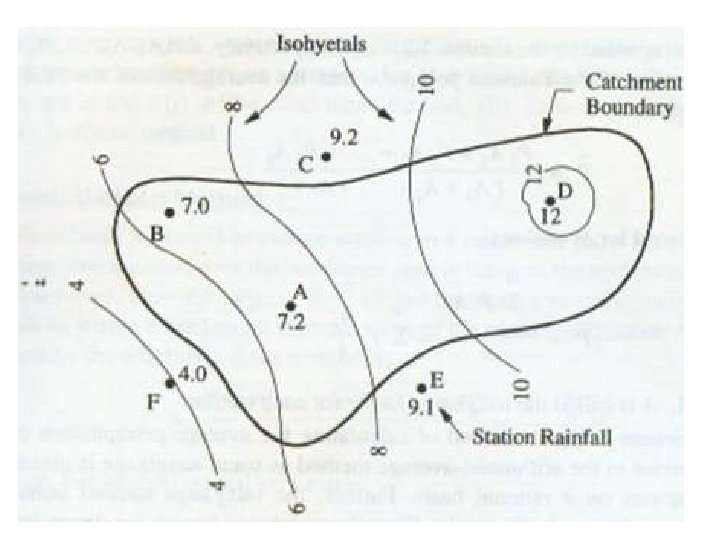
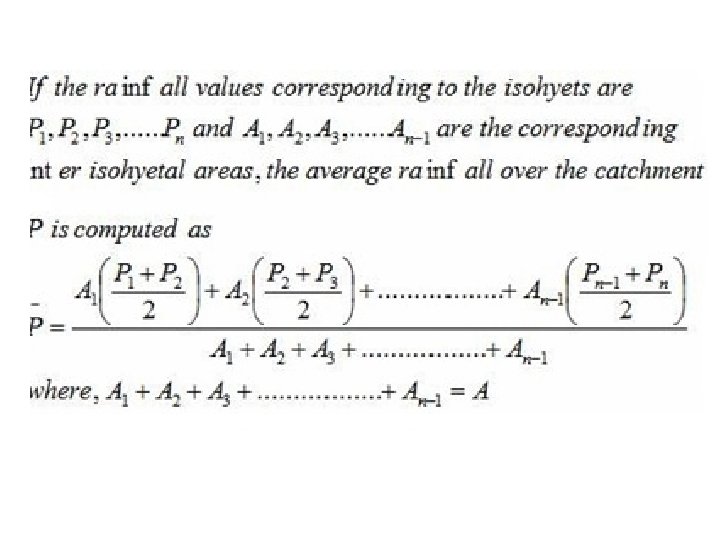
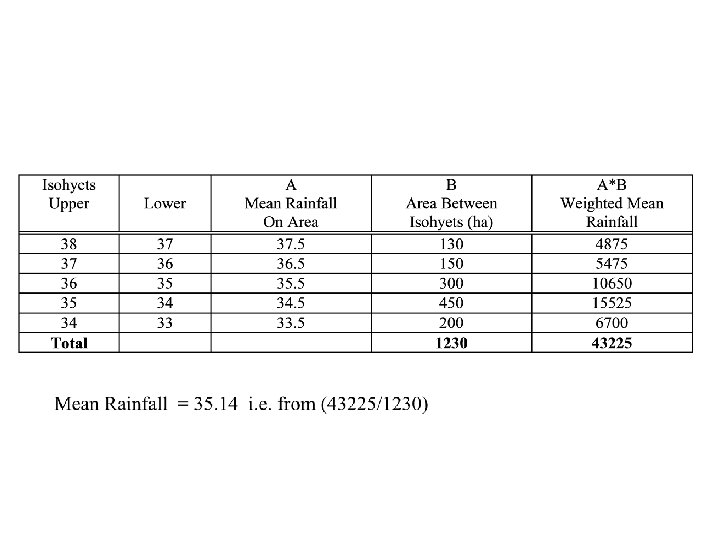
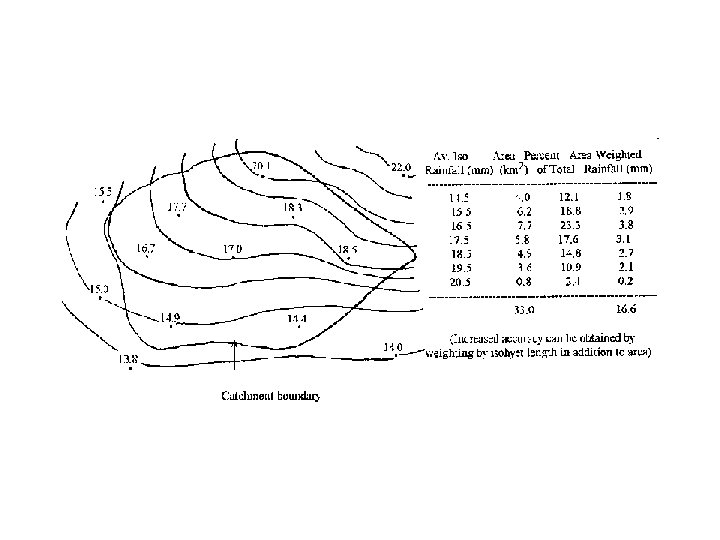
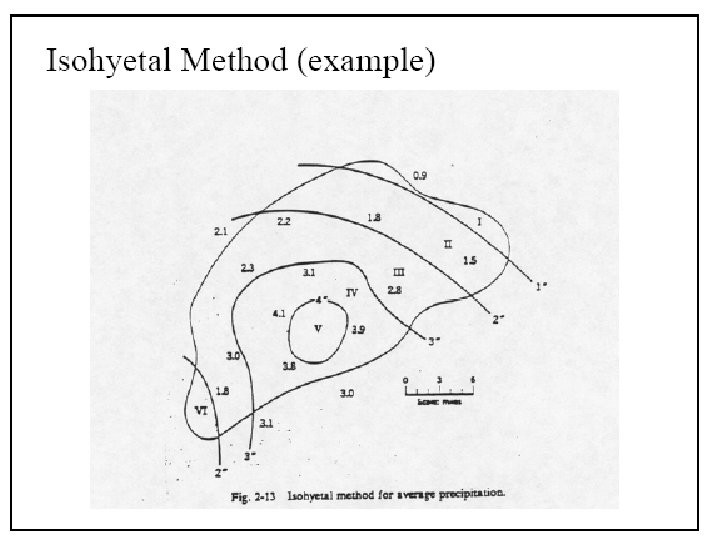
Isohyetal Method • Isohyet – It is a line joining points of equal rainfall magnitude • The catchment area is drawn to scale and the rain gauge stations are marked on it • The recorded rainfall values for which areal average is to determined are marked at the respective stations • Neighbouring stations outside the catchment are also considered • Taking point rainfall values as the guide, ishohyets of different rainfall values are drawn (similar to drawing contours based on spot levels) The area between adjacent isohyets is measured using a planimeter. • If isohyets go out of the catchment, the catchment boundary is used as the bounding line. It is assumed that the average value of rainfall indicated by two isohyets acts over the inter isohyetal area • This method is considered superior to the previous methods when the number of raingauge stations are large
Area = area between isohyets Pave = average of P for zone within bounding isohyets
Typically used to determine rainfall at a gauge which is missing data or at a specified point of interest. Normal Ratio Method Quadrant Method
Normal ratio method (NRM) is used when the normal annual precipitation at any of the index station differs from that of the interpolation station by more than 10%. In this method, the precipitation amounts at the index stations are weighted by the ratios of their normal annual precipitation data in a relationship of the form: Where: Pm = precipitation at the missing location Pi = precipitation at index station Nm = average annual rain at ‘missing data’ gauge Ni = average annual rain at gauge N = number of rain gauges
Quadrant Method is used to calculate quickly the average rainfall for hourly time intervals. The method takes into account the nonlinearity of the rainfall distribution over the basin area. The basin is divided in a network of square elements with a fixed step size. The rainfall is calculated in each node using interpolation, as a function of the measured values at the adjacent stations.
Quadrant Method Procedure: • Divide area around gauge of interest into four quadrants • Using records at nearest station in each quadrant • Compute missing precipitation amount: Where: Pi = rainfall recorded by gauge i Xi = distance from gauge i to missing data point
Consistency of Precipitation Data A double-mass curve is used to check the consistency of a rain gauge record: • compute cumulative rainfall amounts for suspect gauge and check gauges • plot cumulative rainfall amounts against each other (divergence from a straight line indicates error) • multiplying erroneous data after change by a correction factor k where
• • • http: //gs. riverdale. k 12. or. us/~simonc 17/panama/ http: //www. geography. hunter. cuny. edu/~tbw/wc. notes/5. cond. precip/sleet_formation. htm http: //ww 2010. atmos. uiuc. edu/%28 Gh%29/guides/mtr/cld/prcp/rnhl. rxml http: //en. wikipedia. org/wiki/Dew http: //www. egr. msu. edu/~northco 2/BE 481/HW 1. htm http: //theconstructor. org/water-resources/mean-precipitation-calculation-over-anarea/4500/ http: //www. aboutcivil. com/measurement-of-precipitation. html http: //echo 2. epfl. ch/VICAIRE/mod_1 a/chapt_3/main. htm http: //www. greenstone. org/greenstone 3/nzdl; jsessionid=30 A 7616109 C 05 E 596 B 19423862 F 261 F 1 ? a=d&c=cdl&d=HASH 20 df 2 bee 4882705 a 3 d 73 c 1. 11. 2. np&sib=1&p. s=Classifier. Browse&p. sa=&p. a=b