IET 419 Fall 2016 Group 1 Terri Belcher

IET 419 Fall 2016 Group 1 Terri Belcher Kelsey Bradley David Marcum Jacob Marler

“When our service is as boundless as your freedom: That’s feel the drive. ”

About Webasto:

Webasto locations in the USA:

History of Webasto : 1901: Foundation At the age of 55, Wilhelm Baier founds a company that goes by the name of: „Esslinger Draht und Eisenwarenfabrik Wilhelm Baier, Esslingen/Neckar“. 1908: Move to Stockdorf/ Bavaria One profits from the proximity to the North-Italian bike industry and uses the power of the river Würm to drive machines, splashguards and racks are part of the portfolio. 1932: Steel plate and fabric In the middle of the 30 s the first folding roof of Webasto – the so-called “Baier folding roof” – is assembled into a panorama bus. 1935: Webasto puts the heating on Development of the first heater for buses as well as engine-independent heaters for passenger cars. 1952: More than hot air Development of the first heater for buses as well as engine-independent heaters for passenger cars. 1956: Pioneer work Webasto delivers the first steel sunroof to Daimler-Benz – on order for the types 180 till 220 as well as for the 300 er special class („Adenauer"). 1974: The start of the glass roof's success story A glass roof in the Ford Fiesta brings light and a feeling of space into the car. 5 years later the first serial pop-up sliding glass roof is installed. 1986: Foundation of the expansion Webasto becomes a corporation. The Webasto AG Fahrzeugtechnik grows continuously and begins the sunroof production in the new plant in Schierling (near Regensburg). 1989: Light and air The Audi A 80 Coupé is equipped with the first sunroof with mono-crystalline solar cells for parking ventilation, which provides ventilation while closed. 1992: Neubrandenburg – new perspectives Mit dem Bau einer neuen Produktionsstätte wandelt sich der ehemalige VEB Sirokko zu einem modernen Werk für Standheizungen
 History of Webasto : 2000: Smart Convertible Roof An attractive, small and modern")
(Cont’d) History of Webasto : 2000: Smart Convertible Roof An attractive, small and modern car: the first convertible roof from Webasto is one of the most up-todate of its time. It can be opened and closed during travel – just like a sliding roof. 2007: Big things for the little one Der Smart fortwo trägt das weltweit größte Panoramadach aus Polycarbonat von Webasto. 2008: Expansion Opening of the new headquarters of Thermo & Comfort in Gilching. 2009: Acquisition despite the crisis Acquisition of the convertible division of Edscha – the largest acquisition of Webasto. 2010: Expansion with full pressure With the aquisition of Karmann North America Webasto extended its position as market leader for convertible roofs. For the first time ever the group achieved sales of around 2 billion Euros. 2010: Next-generation parking heater The new Thermo Top Evo automobile heaters are the lightest in their class. 2011: 25 years convertible feeling The story of the Convertible Roofs unit began with the start of production for the BMW 3 series convertible. 2012: 75 years sunroof systems Starting with the first folding roof for a manufacturer in 1937, the Webasto automotive history began. 2012: Diavia Acquisition of the Diavia air conditioning division for off-road and special-purpose vehicles from Delphi Italia Automotive Systems. New locations in Molinella (Italy) and Madrid (Spain). 2012: New Corporate Structure Divestment of Roof and Heating Systems to the independent operating companies: Webasto Roof & Components SE and Webasto Thermo & Comfort SE. Conversion of Webasto AG to Webasto SE.

Webasto Vision:

Webasto Vision:

Webasto Goals:

Webasto Quality:

Webasto Environmental and Energy Principles:

Webasto Safety Principles:

Webasto Future:

International Standards Organization 14001: 2004 :

Webasto Awards:

Continuous Improvement :

Continuous Improvement :

Continuous Improvement :

WPS Webasto-Production-System Plan Do Study Act Plan: State the objective. Establish plans to implement test, observations or collect data (who? , what? , when? , where? ) PLAN Do: Try out the test on a small scale and begin data analysis ACT PDSA Cycle STUDY DO Study: Try the actions on a small scale. Complete the analysis of the data. Compare the data to your predictions. Act: Review the results and continue the cycle. Determine modifications. Make preparations for the next activities PDSA: often referred to as the Deming cycle and is a model that outlines a process for continuous improvement. This came from PDCA (Plan Do Check Act) referred to as the Shewhart cycle.

WPS Webasto-Production-System 5 Why Technique – Step Diagram First level cause Begin with a clear definition of the problem Why Ask “why this happen” FIVE times Why The 5 Why technique helps to think through and identify the root cause. 1. Determine the starting point of the analysis End with something or some action that you can take Why 2. Ask “ why is this a cause of the original problem” 3. For each new answer repeat the question Why 4. This method often requires five “whys” Root Cause

WPS Webasto-Production-System 5 Why Technique – Example Machine Failure Action must be taken at each cause but the root cause has yet to be identified Why Cylinder Broke Example of action: A new pump will fix the problem but with out a good PM Process a worn pump will be repeated resulting in downtime Why Hydraulic Pressure Fluctuates The 5 Why technique: 1. Determine the starting point of the analysis Why 2. Ask “ why is this a cause of the original problem” 3. For each new answer repeat the question Worn Pump Why 4. This method often requires five “whys” Note: This is often difficult as colleagues want to jump to the solution and fix causes they have identified. Take the time to follow the process and answer the 5 why’s Lack of PM Why The root cause tells us the process for PM need addressed

Webasto-Production-System Problem Solving Steps for 5 Why Grasp the Situation Problem Description Problem Definition Locate point of cause Why? Po. C Why? Direct Cause Why? Cause Investigation 5 Why Investigation to Root Cause Why? Root Cause Counter Measure Follow-up Evaluate Standardize The Toyota Way by Jeffery Liker Basic Cause / Effect Investigation Pla n WPS Do Check Act
 Materials People Problem Description (Effect) Measurement")
WPS Webasto-Production-System Environment Cause and Effect Diagram (Generic) Materials People Problem Description (Effect) Measurement Machine Causes 1. 2. 3. 4. 5. Method Note: These are the six categories that can Impact the problem Identify the problem Record the problem statement Label the categories / draw the bones Brainstorm all possible causes of the problem Identify the most likely cause and develop a second level diagram

5 Why Technique WPS Reverse Test for Logic Webasto-Production-System Result The milk was spoiled Why SO Left it in the fridge too long Why Work the logic back to verify the fix SO We didn’t drink it fast enough Why SO We had more milk than we needed Why The reverse test ensures that you are using the 5 Why Technique in a logical way SO We bought more cartons than we needed Why SO There was a sale on milk Root Cause

WPS Webasto-Production-System 5 Why Analysis Template Using the template as a guide: • Identify root cause of how the problem occur • Why the problem was not detected • Why the system allowed the problem to occur Define Problem ID the specific nonconformance Why Id why problem was not detected ID the Systemic root cause Why Why Why Why Once the factors are gathered then enter the corrective actions to each root cause

Standardized Work WPS Webasto-Production-System

WPS Standardized Work Webasto-Production-System Purpose Ø To standardize work flow in order to produce a quality part every time, safely, and with less expense due to waste. Ø To document best practices as standardized work to provide a baseline for further kaizen activity (continuous improvement) That the operating time of both man and machine is made transparent so waste is made visible and variation is minimized. Ø Background Ø Managed production is a standard; it detects abnormalities more quickly and more efficiently. ØClear identification of normal and abnormal conditions is necessary to recognize and address problem(s) as quickly as possible. Premise Ø Work is human centered Ø Work content consists of repetitive work cycles

Standardized Work WPS Webasto-Production-System 3 Elements of Standardized Work 1. Takt Time 2. Work Sequence 3. Standard Work in Process – SWIP (NOTE: this not the same as Work in Process - WIP) Sustainable improvement without standardized work cannot be attained

Takt Time WPS Webasto-Production-System TAKT TIME: the rate of market demand. Available Operational Time: Amount of time available for production per shift • Case by 1 or 2 shifts: 450 minutes / shift (w/no changeover) • Case by 3 shifts: 430 minutes / shift (w/no changeover) Start -up mee ting Lunch time 30 min. Break time 10 min. 510 - 60 = 450 min. 10 Brea min. k time (510 -60)X 2 = 900 min. 10 min. Lunch time 20 min. (480 -50)X 3 = 1290 min.

Work Sequence WPS Webasto-Production-System The work sequence is the operator’s order of work – Work Instruction Lexington division Rochester Hills division
: the amount of")
WPS Standard Work in Process Webasto-Production-System Standard Work in Process (SWIP): the amount of material that must remain in a process to enable smooth operation Example: A process requires 15 seconds to apply and 285 seconds to cure an adhesive, though the process Takt Time is only 80 seconds. The SWIP in this case would be calculated as: SWIP = 285 seconds / 80 seconds = 3. 56 units Since we cannot have 0. 56 units, we round up to define the SWIP for this process as 4 units required between the adhesive application and the next value added step in the process. Standard Work in Process is a defined quantity based on this calculation and must not be increased randomly creating unnecessary buffers.

WPS Standardized Work Webasto-Production-System Tools used to visualize a process: Process Flow Line Balance Chart Spaghetti Chart Standardized Work Combination Table

WPS Process Flow Chart Webasto-Production-System Visual representation of the work areas in a process
: Used to provide")
WPS Line Balance Chart Webasto-Production-System Line Balance Chart (Overall Cycle Time): Used to provide an overall view of a work cell’s individual stations to identify overall line balance effectiveness and identify bottleneck processes
 Scaled diagram")
WPS Spaghetti Chart Webasto-Production-System 1. Spaghetti Chart (each person / each process) Scaled diagram of a process showing the actual physical path and distances travelled during a product cycle
")
WPS Standardized Work Chart Webasto-Production-System 1. Standardized Work Chart (each person / each process) 1. Fill in header 2. Draw layout 3. Draw sequence steps (do not use arrows, return route is a dotted line) 4. Enter Standard WIP 5. Enter quality checks 6. Enter safety devices 7. Note process bottlenecks Goal is to visualize process, define standard work using Takt, sequence and SWIP, and provide a basis for kaizen

WPS Webasto-Production-System Standardized Work Combination Table

Charts On the next slide you will see some data we collected from Webasto and you will see how that data looks when charted out. The data/chart are based on Overall line efficiency. The CW in the data stands for Calendar Week.
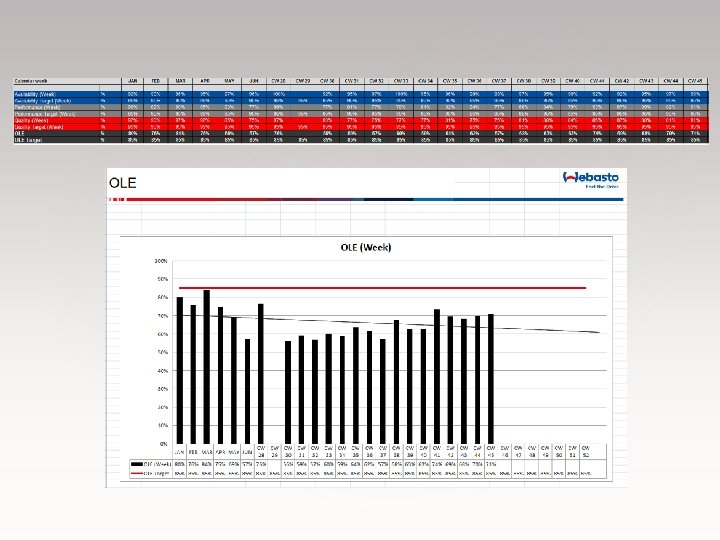

Analyses of Data Collected The dated collect from Webasto was in percentages of availability, performance, quality and each of there targets. That compiled, gives you the overall line efficiency. The availability target was 95% and they hit or exceeded that target 18 times. The performance target is 95% and the closest they came to that was 93% one time. The quality target is also 95% and they met or exceeded it twice. The target for overall line efficiency is 85%. You can see from the data and the charts that they never actually meet that 85%. The closest that they got was 84% one time. Since they never met the OLE target, we believe there is a lot of room for improvement. The biggest problem we see is the performance. If they could get there performance numbers up, and possibly even boost quality a little bit; we believe they could reach the OLE target they have set.

Recommendations for Webasto TQM Practices: We would like to start by saying that Webasto seems to use several TQM tools all ready, and are also not far off on hitting their targets. The types of charts they use are good. The tools they use for root cause, and continuous improvement are also solid. At this point our recommendations would be to continue gathering data, studying it and trying different things to push their performance to the top. They can’t go wrong with continuous improvement and kaizen activities either. If they keep these things up, we really believe they will rise to the top of their own expectations. It also seems like they need to take the performance studies they took, and re-visit them. That would give them the ability to break that down further to see where their performance issues really lie.

Websites: • • • https: //www. webasto-group. com/int/ https: //www. webasto. com/us/about-webasto/quality-environment/ https: //www. webastogroup. com/fileadmin/webasto_files/documents/international/grou p/certification/iso 14001_and_50001/Amerika/iso-14001 -wrsilexington-e-2018. pdf https: //www. webasto. com/us/markets-products/car/factory-roofsystems-for-automotive-industry/roof-systems-with-lightweighttechnology/ http: //www. techwebasto. com/ https: //start. cortera. com/company/research/k 2 k 4 nws 8 j/webastosunroofs-inc/
- Slides: 42