
IENG 486 Lecture 17 Control Charts for Individuals



- Slides: 38
IENG 486 - Lecture 17 Control Charts for Individuals (Measuring Each Unit) 11/23/2020 IE 355: Quality & Applied Statistics I 1
Assignment w Reading: n Chapter 6 l n Section 6. 4: pp. 259 - 265 Chapter 9 l l l Sections 9. 1 – 9. 1. 5: pp. 399 - 410 Sections 9. 2 – 9. 2. 4: pp. 419 - 425 Sections 9. 3: pp. 428 - 430 w Homework: n CH 9 Textbook Problems: l 11/23/2020 1 a, 17, 26 Hint: Use Excel charts! IE 355: Quality & Applied Statistics I 2
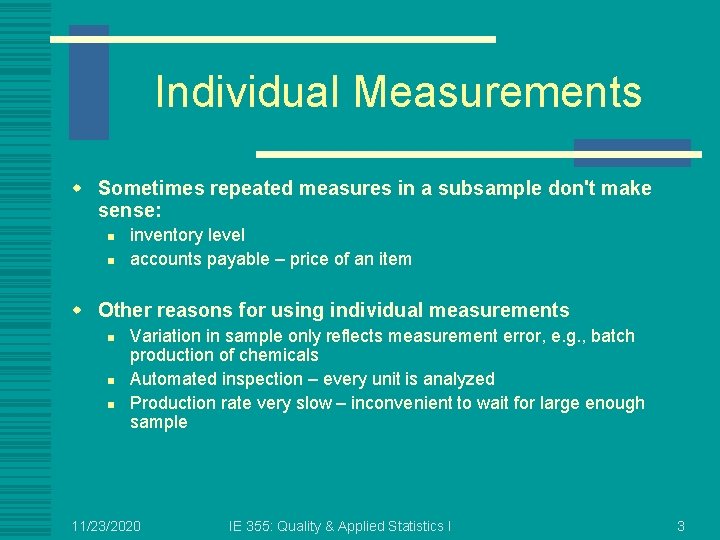
Individual Measurements w Sometimes repeated measures in a subsample don't make sense: n n inventory level accounts payable – price of an item w Other reasons for using individual measurements n n n Variation in sample only reflects measurement error, e. g. , batch production of chemicals Automated inspection – every unit is analyzed Production rate very slow – inconvenient to wait for large enough sample 11/23/2020 IE 355: Quality & Applied Statistics I 3
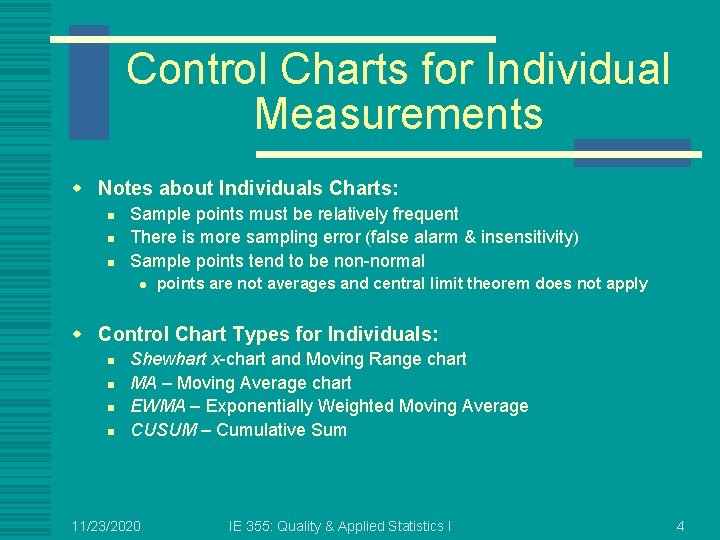
Control Charts for Individual Measurements w Notes about Individuals Charts: n n n Sample points must be relatively frequent There is more sampling error (false alarm & insensitivity) Sample points tend to be non-normal l points are not averages and central limit theorem does not apply w Control Chart Types for Individuals: n n Shewhart x-chart and Moving Range chart MA – Moving Average chart EWMA – Exponentially Weighted Moving Average CUSUM – Cumulative Sum 11/23/2020 IE 355: Quality & Applied Statistics I 4
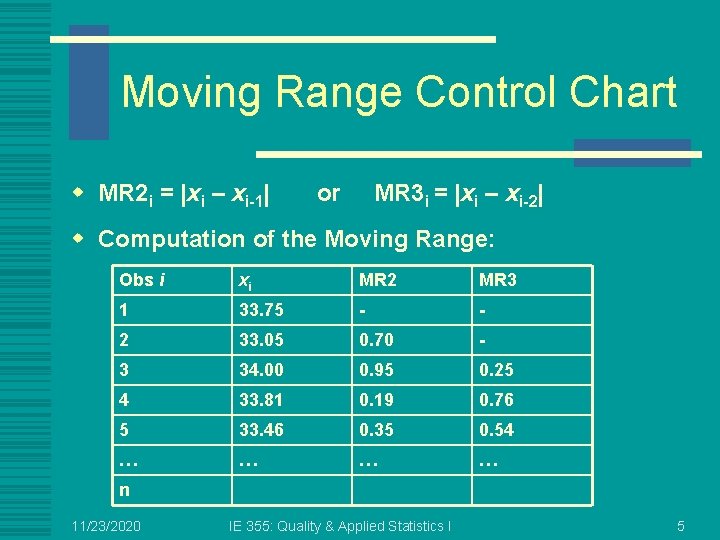
Moving Range Control Chart w MR 2 i = |xi – xi-1| or MR 3 i = |xi – xi-2| w Computation of the Moving Range: Obs i xi MR 2 MR 3 1 33. 75 - - 2 33. 05 0. 70 - 3 34. 00 0. 95 0. 25 4 33. 81 0. 19 0. 76 5 33. 46 0. 35 0. 54 … … n 11/23/2020 IE 355: Quality & Applied Statistics I 5
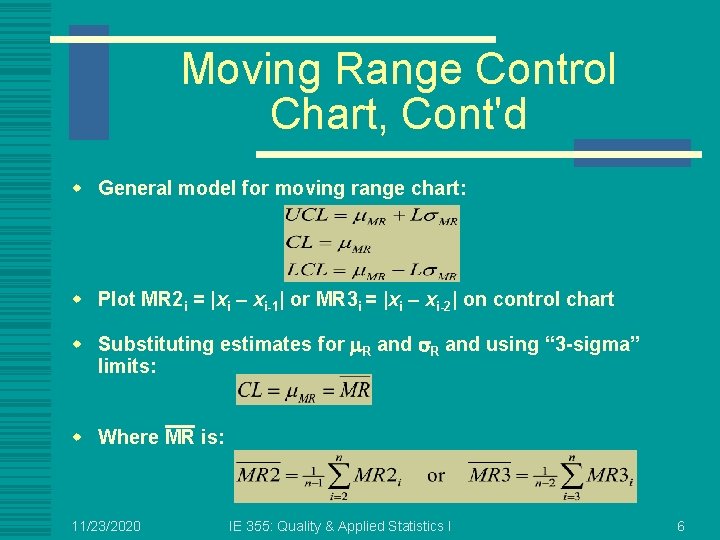
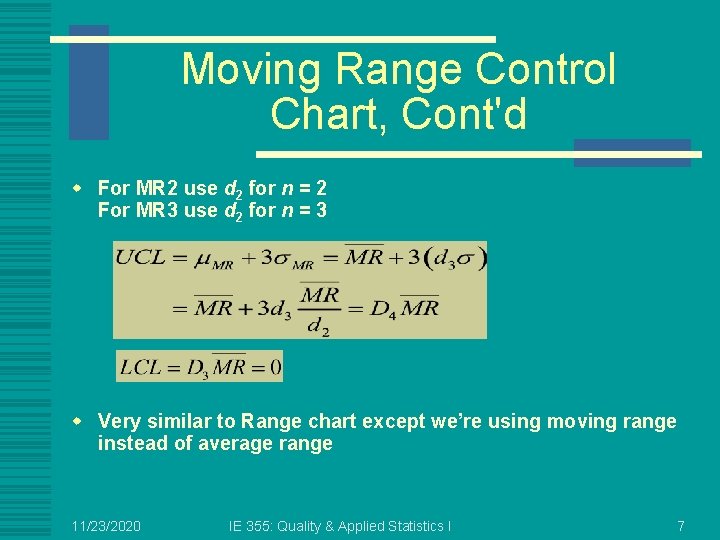
Moving Range Control Chart, Cont'd w General model for moving range chart: w Plot MR 2 i = |xi – xi-1| or MR 3 i = |xi – xi-2| on control chart w Substituting estimates for m. R and s. R and using “ 3 -sigma” limits: w Where MR is: 11/23/2020 IE 355: Quality & Applied Statistics I 6
Moving Range Control Chart, Cont'd w For MR 2 use d 2 for n = 2 For MR 3 use d 2 for n = 3 w Very similar to Range chart except we’re using moving range instead of average range 11/23/2020 IE 355: Quality & Applied Statistics I 7
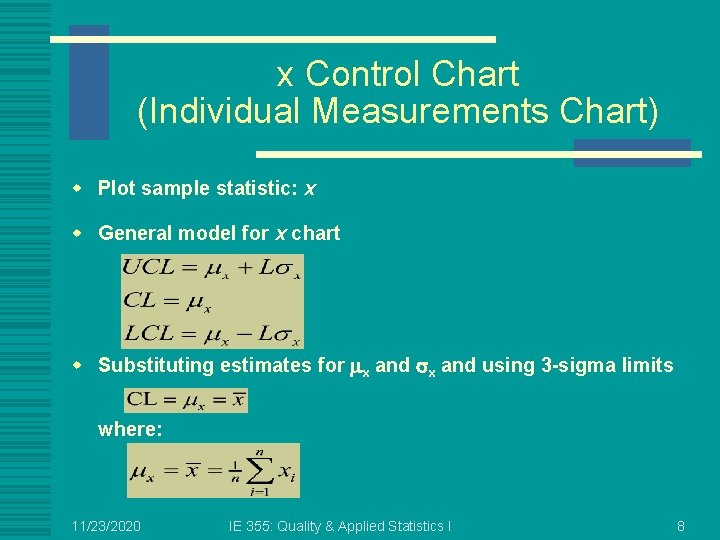
x Control Chart (Individual Measurements Chart) w Plot sample statistic: x w General model for x chart w Substituting estimates for mx and sx and using 3 -sigma limits where: 11/23/2020 IE 355: Quality & Applied Statistics I 8
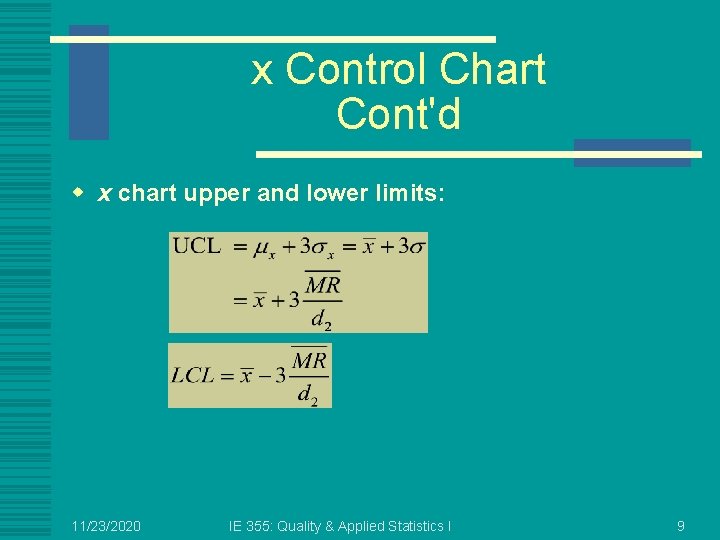
x Control Chart Cont'd w x chart upper and lower limits: 11/23/2020 IE 355: Quality & Applied Statistics I 9
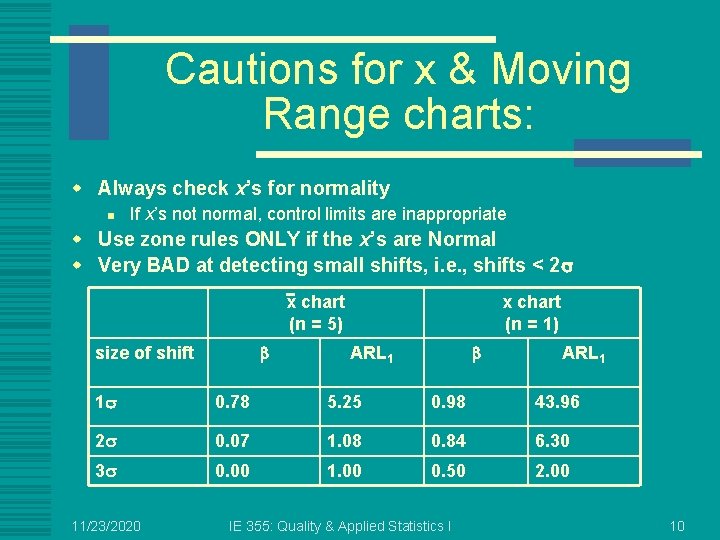
Cautions for x & Moving Range charts: w Always check x’s for normality n If x’s not normal, control limits are inappropriate w Use zone rules ONLY if the x’s are Normal w Very BAD at detecting small shifts, i. e. , shifts < 2 s x chart (n = 5) b size of shift x chart (n = 1) b ARL 1 1 s 0. 78 5. 25 0. 98 43. 96 2 s 0. 07 1. 08 0. 84 6. 30 3 s 0. 00 1. 00 0. 50 2. 00 11/23/2020 IE 355: Quality & Applied Statistics I 10
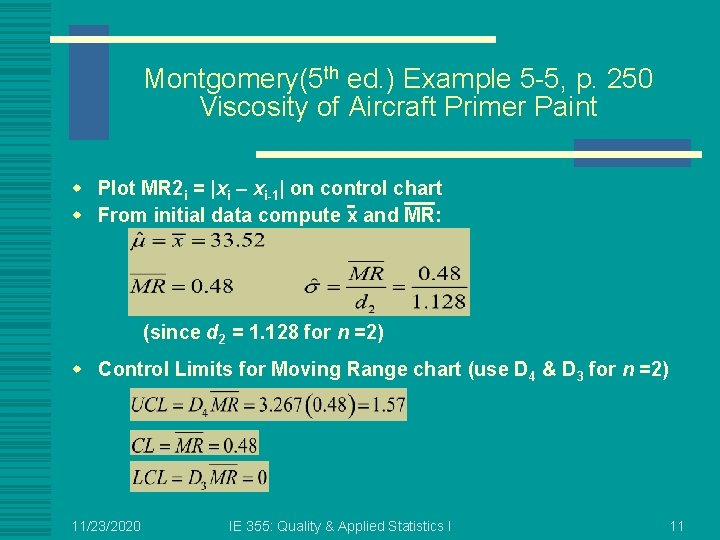
Montgomery(5 th ed. ) Example 5 -5, p. 250 Viscosity of Aircraft Primer Paint w Plot MR 2 i = |xi – xi-1| on control chart w From initial data compute x and MR: (since d 2 = 1. 128 for n =2) w Control Limits for Moving Range chart (use D 4 & D 3 for n =2) 11/23/2020 IE 355: Quality & Applied Statistics I 11
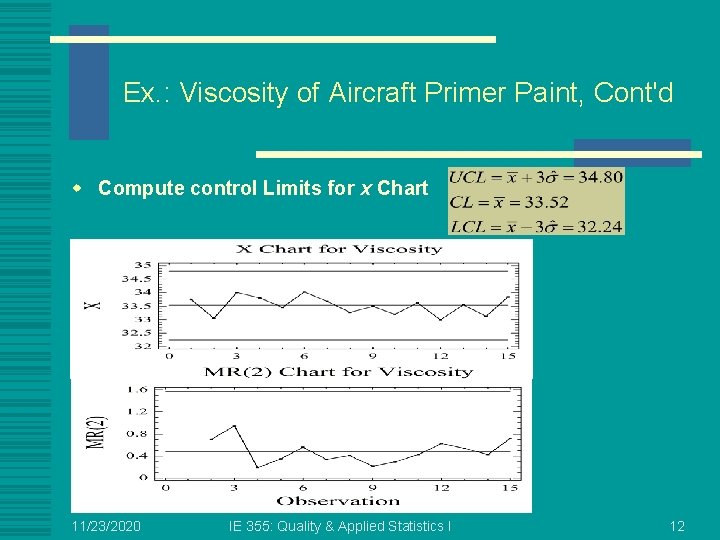
Ex. : Viscosity of Aircraft Primer Paint, Cont'd w Compute control Limits for x Chart 11/23/2020 IE 355: Quality & Applied Statistics I 12
Alternatives to Shewhart Control Charts w All control charts so far have been Shewhart Control Charts n n uses information about the process contained in the last plotted point ignores information given by the entire sequence of points, unless sensitizing rules are used w Shewhart charts are relatively insensitive to small shifts, ex. shifts < 1. 5 s w Three Alternative charts: n n n MA – Moving Average control chart EWMA – Exponentially Weighted Moving Average control chart CUSUM – Cumulative-sum control chart 11/23/2020 IE 355: Quality & Applied Statistics I 13
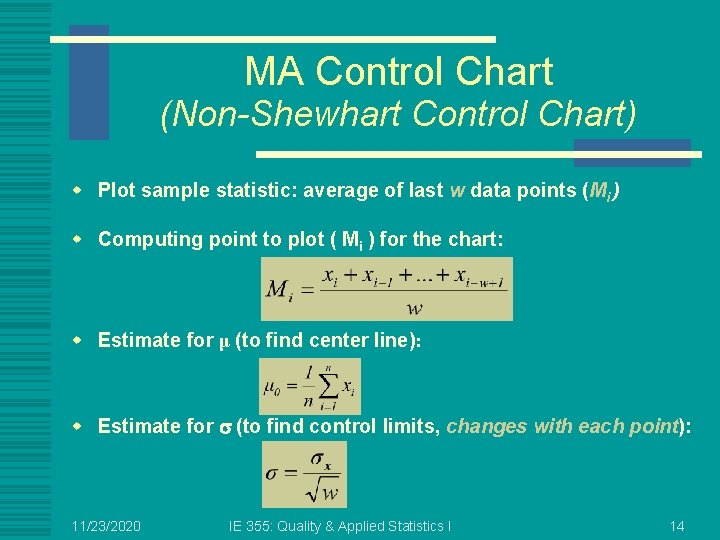
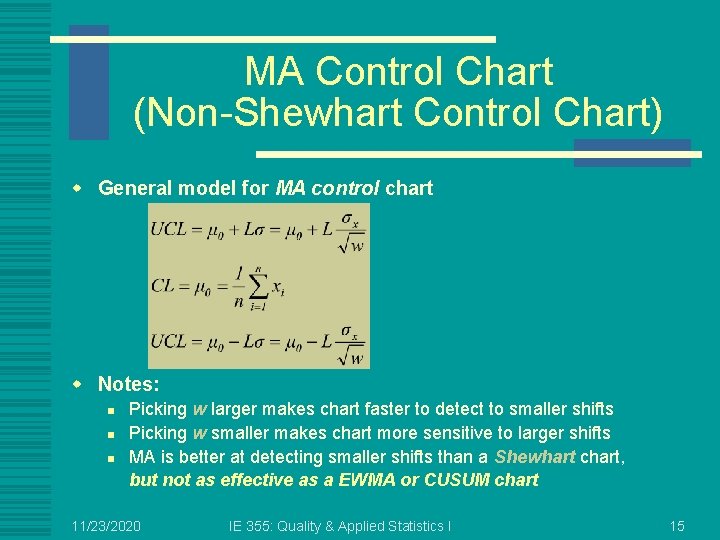
MA Control Chart (Non-Shewhart Control Chart) w Plot sample statistic: average of last w data points (Mi ) w Computing point to plot ( Mi ) for the chart: w Estimate for μ (to find center line): w Estimate for s (to find control limits, changes with each point): 11/23/2020 IE 355: Quality & Applied Statistics I 14
MA Control Chart (Non-Shewhart Control Chart) w General model for MA control chart w Notes: n n n Picking w larger makes chart faster to detect to smaller shifts Picking w smaller makes chart more sensitive to larger shifts MA is better at detecting smaller shifts than a Shewhart chart, but not as effective as a EWMA or CUSUM chart 11/23/2020 IE 355: Quality & Applied Statistics I 15
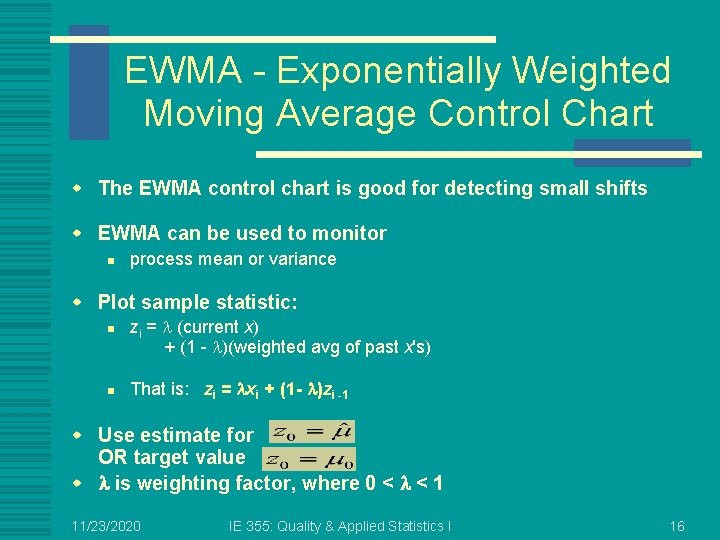
EWMA - Exponentially Weighted Moving Average Control Chart w The EWMA control chart is good for detecting small shifts w EWMA can be used to monitor n process mean or variance w Plot sample statistic: n n zi = l (current x) + (1 - l)(weighted avg of past x's) That is: zi = lxi + (1 - l)zi -1 w Use estimate for OR target value w l is weighting factor, where 0 < l < 1 11/23/2020 IE 355: Quality & Applied Statistics I 16
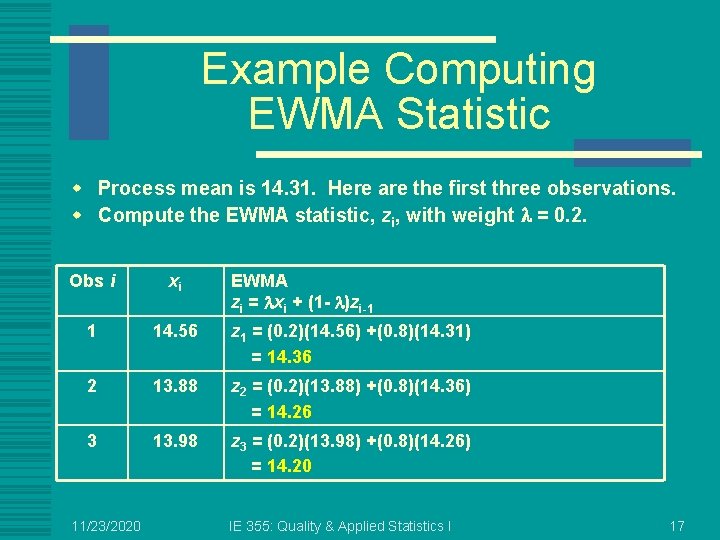
Example Computing EWMA Statistic w Process mean is 14. 31. Here are the first three observations. w Compute the EWMA statistic, zi, with weight l = 0. 2. Obs i xi 1 14. 56 z 1 = (0. 2)(14. 56) +(0. 8)(14. 31) = 14. 36 2 13. 88 z 2 = (0. 2)(13. 88) +(0. 8)(14. 36) = 14. 26 3 13. 98 z 3 = (0. 2)(13. 98) +(0. 8)(14. 26) = 14. 20 11/23/2020 EWMA zi = lxi + (1 - l)zi-1 IE 355: Quality & Applied Statistics I 17
EWMA Control Limits w Standards Given: w Standards not given - use estimates for mz and sz: w Notice: σ depends on the observation number i n Use to estimate s: w Typical values for l and L: n 0. 05 l 0. 25 11/23/2020 and 2. 6 L 3. 054 IE 355: Quality & Applied Statistics I 18
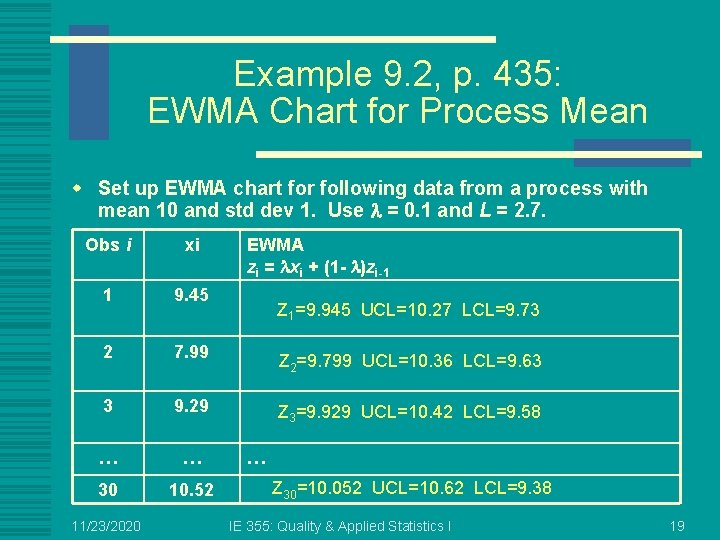
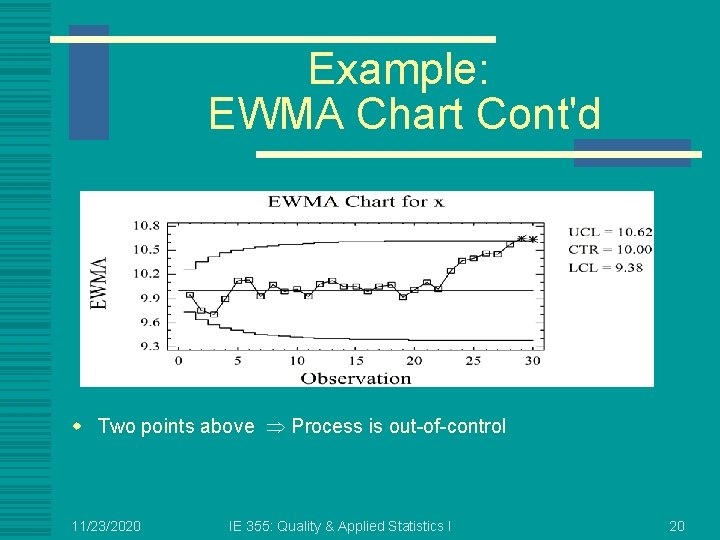
Example 9. 2, p. 435: EWMA Chart for Process Mean w Set up EWMA chart for following data from a process with mean 10 and std dev 1. Use l = 0. 1 and L = 2. 7. Obs i xi 1 9. 45 2 7. 99 3 9. 29 … … 30 10. 52 11/23/2020 EWMA zi = lxi + (1 - l)zi-1 Z 1=9. 945 UCL=10. 27 LCL=9. 73 Z 2=9. 799 UCL=10. 36 LCL=9. 63 Z 3=9. 929 UCL=10. 42 LCL=9. 58 … Z 30=10. 052 UCL=10. 62 LCL=9. 38 IE 355: Quality & Applied Statistics I 19
Example: EWMA Chart Cont'd w Two points above Process is out-of-control 11/23/2020 IE 355: Quality & Applied Statistics I 20
Design of EWMA Control Chart: How to pick l and L w Use smaller l to detect smaller shifts w Usual choices: n l = 0. 05, l = 0. 10, l = 0. 20 w Reasonable configuration: n For l = 0. 20 let L = 3 w For smaller l, use slightly smaller L n n For l = 0. 05 let L 2. 6 For l = 0. 10 let L 2. 8 w See Table 9. 11, p. 437 for ARL’s 11/23/2020 IE 355: Quality & Applied Statistics I 21
CUSUM Control Chart w Incorporates all the information in the sequence of sample values by n plotting the cumulative sums of the deviations of the sample values from a target value, m 0 w CUSUM can be used to monitor n n process mean defectives defects variance w CUSUM can have sample size n 1 w We concentrate on sample size n = 1 11/23/2020 IE 355: Quality & Applied Statistics I 22
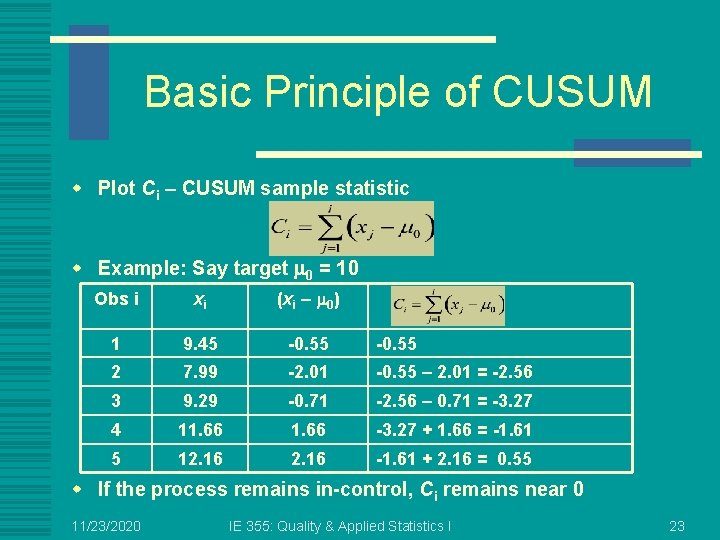
Basic Principle of CUSUM w Plot Ci – CUSUM sample statistic w Example: Say target m 0 = 10 Obs i xi (xi – m 0) 1 9. 45 -0. 55 2 7. 99 -2. 01 -0. 55 – 2. 01 = -2. 56 3 9. 29 -0. 71 -2. 56 – 0. 71 = -3. 27 4 11. 66 -3. 27 + 1. 66 = -1. 61 5 12. 16 -1. 61 + 2. 16 = 0. 55 w If the process remains in-control, Ci remains near 0 11/23/2020 IE 355: Quality & Applied Statistics I 23
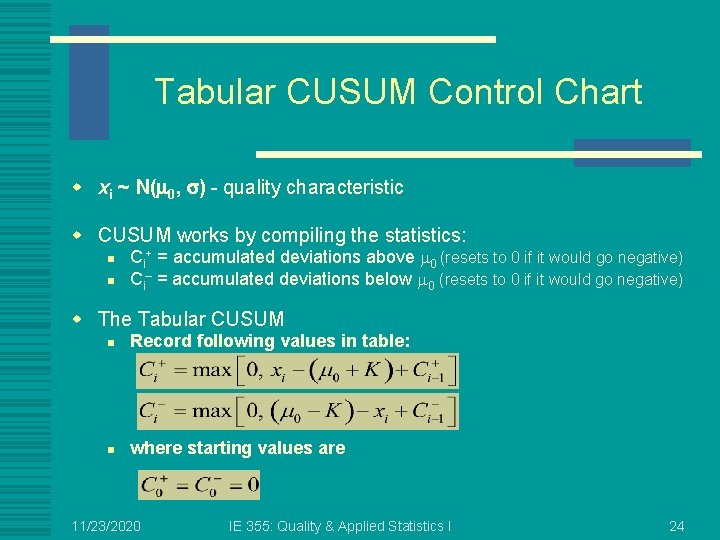
Tabular CUSUM Control Chart w xi ~ N(m 0, s) - quality characteristic w CUSUM works by compiling the statistics: n n Ci+ = accumulated deviations above m 0 (resets to 0 if it would go negative) Ci– = accumulated deviations below m 0 (resets to 0 if it would go negative) w The Tabular CUSUM n Record following values in table: n where starting values are 11/23/2020 IE 355: Quality & Applied Statistics I 24
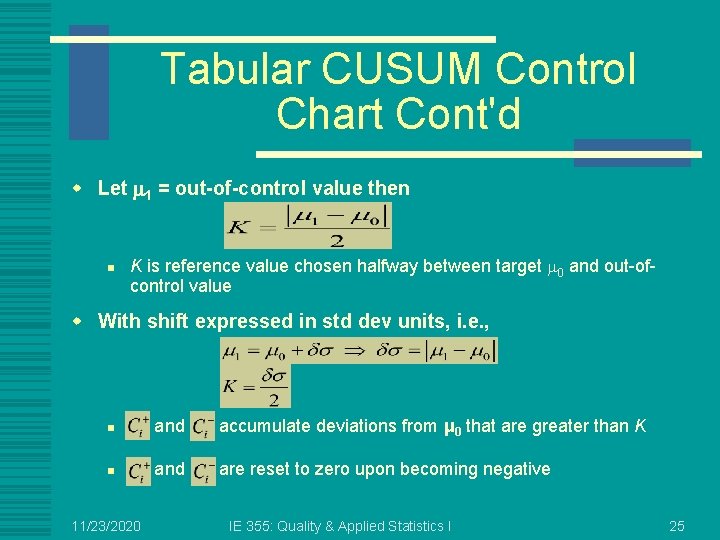
Tabular CUSUM Control Chart Cont'd w Let m 1 = out-of-control value then n K is reference value chosen halfway between target m 0 and out-ofcontrol value w With shift expressed in std dev units, i. e. , n and accumulate deviations from μ 0 that are greater than K n and are reset to zero upon becoming negative 11/23/2020 IE 355: Quality & Applied Statistics I 25
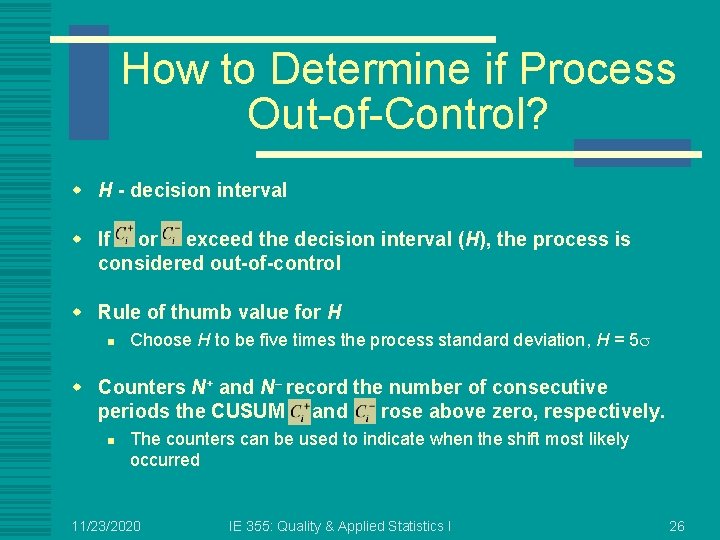
How to Determine if Process Out-of-Control? w H - decision interval w If or exceed the decision interval (H), the process is considered out-of-control w Rule of thumb value for H n Choose H to be five times the process standard deviation, H = 5 s w Counters N+ and N– record the number of consecutive periods the CUSUM and rose above zero, respectively. n The counters can be used to indicate when the shift most likely occurred 11/23/2020 IE 355: Quality & Applied Statistics I 26
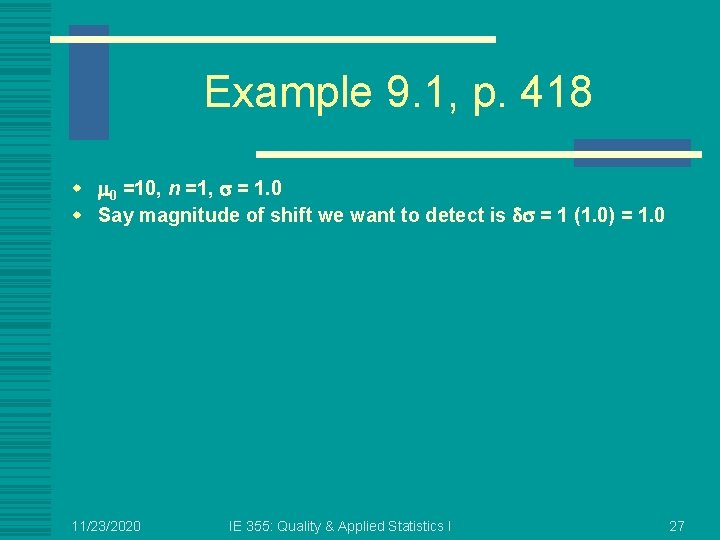
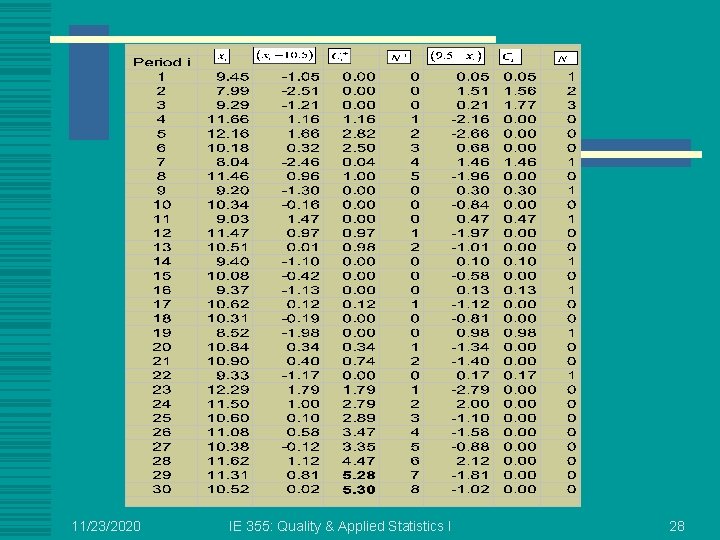
Example 9. 1, p. 418 w m 0 =10, n =1, s = 1. 0 w Say magnitude of shift we want to detect is ds = 1 (1. 0) = 1. 0 11/23/2020 IE 355: Quality & Applied Statistics I 27
11/23/2020 IE 355: Quality & Applied Statistics I 28
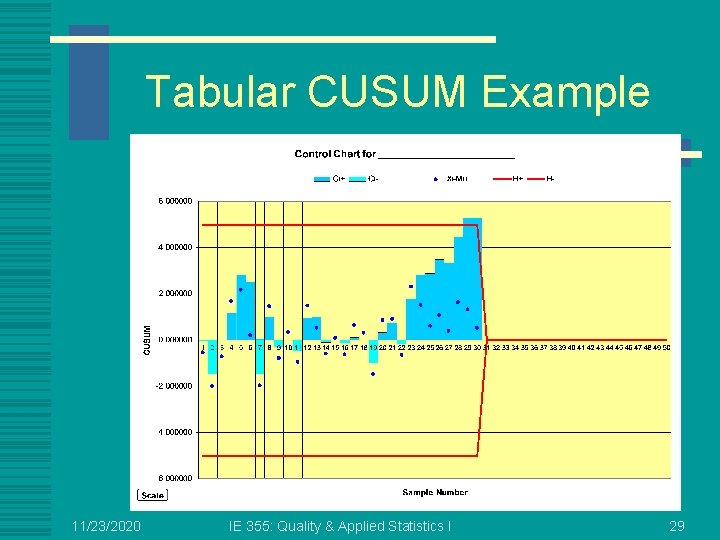
Tabular CUSUM Example 11/23/2020 IE 355: Quality & Applied Statistics I 29
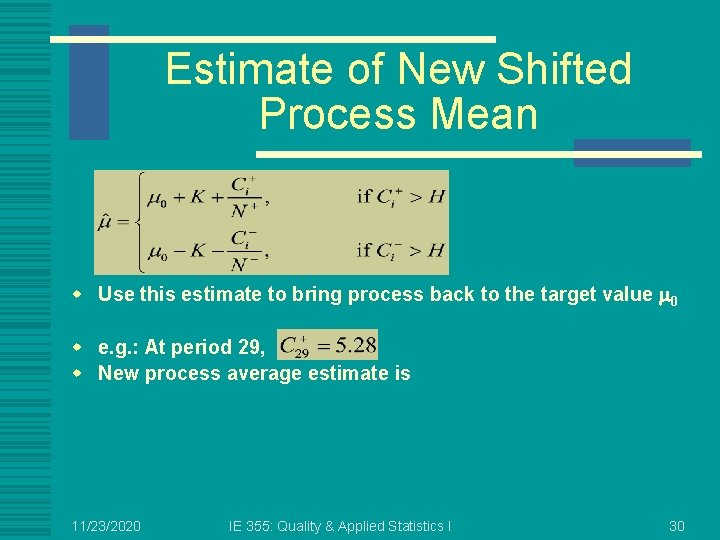
Estimate of New Shifted Process Mean w Use this estimate to bring process back to the target value m 0 w e. g. : At period 29, w New process average estimate is 11/23/2020 IE 355: Quality & Applied Statistics I 30
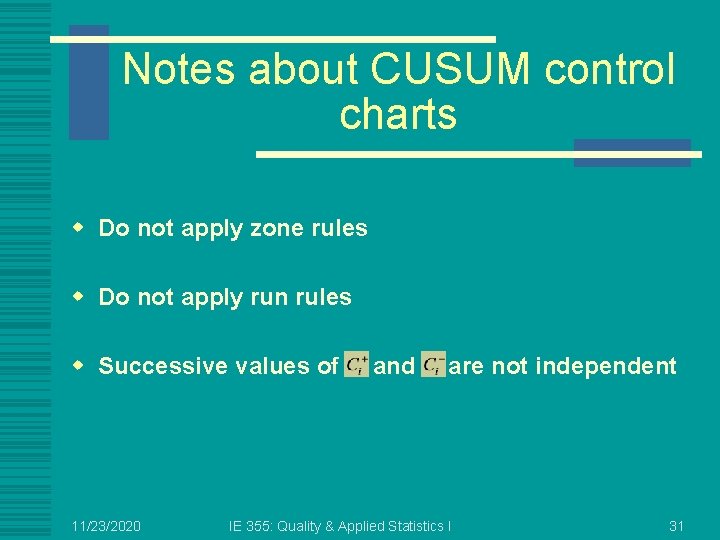
Notes about CUSUM control charts w Do not apply zone rules w Do not apply run rules w Successive values of 11/23/2020 and are not independent IE 355: Quality & Applied Statistics I 31
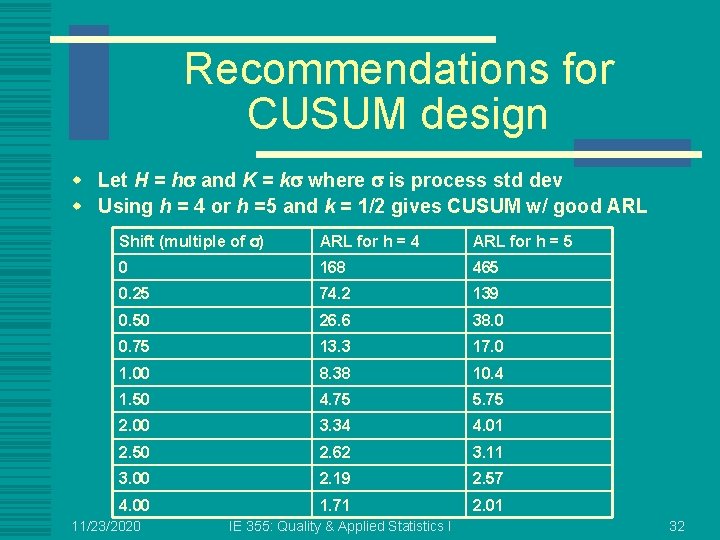
Recommendations for CUSUM design w Let H = hs and K = ks where s is process std dev w Using h = 4 or h =5 and k = 1/2 gives CUSUM w/ good ARL Shift (multiple of s) ARL for h = 4 ARL for h = 5 0 168 465 0. 25 74. 2 139 0. 50 26. 6 38. 0 0. 75 13. 3 17. 0 1. 00 8. 38 10. 4 1. 50 4. 75 5. 75 2. 00 3. 34 4. 01 2. 50 2. 62 3. 11 3. 00 2. 19 2. 57 4. 00 1. 71 2. 01 11/23/2020 IE 355: Quality & Applied Statistics I 32
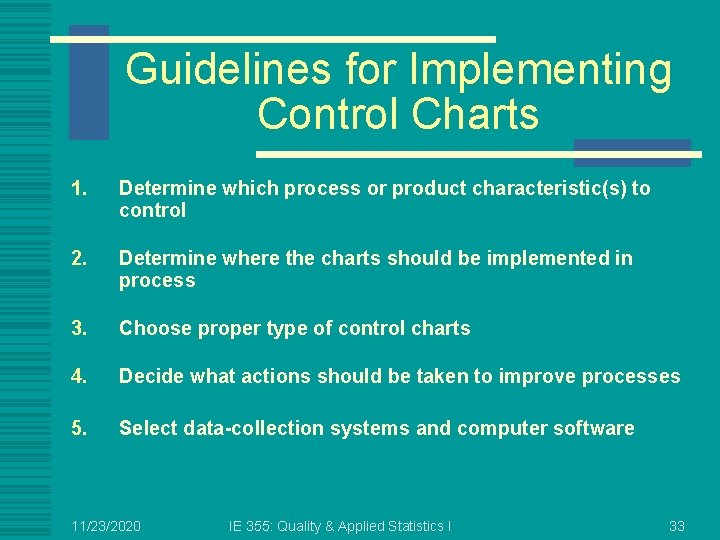
Guidelines for Implementing Control Charts 1. Determine which process or product characteristic(s) to control 2. Determine where the charts should be implemented in process 3. Choose proper type of control charts 4. Decide what actions should be taken to improve processes 5. Select data-collection systems and computer software 11/23/2020 IE 355: Quality & Applied Statistics I 33
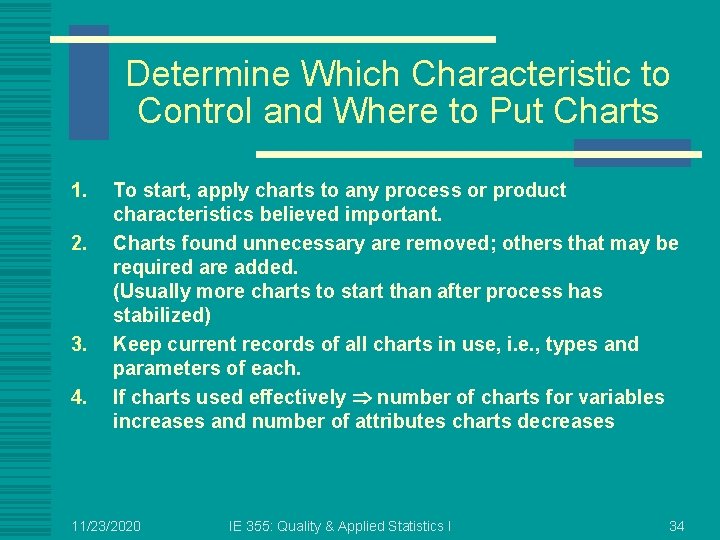
Determine Which Characteristic to Control and Where to Put Charts 1. 2. 3. 4. To start, apply charts to any process or product characteristics believed important. Charts found unnecessary are removed; others that may be required are added. (Usually more charts to start than after process has stabilized) Keep current records of all charts in use, i. e. , types and parameters of each. If charts used effectively number of charts for variables increases and number of attributes charts decreases 11/23/2020 IE 355: Quality & Applied Statistics I 34
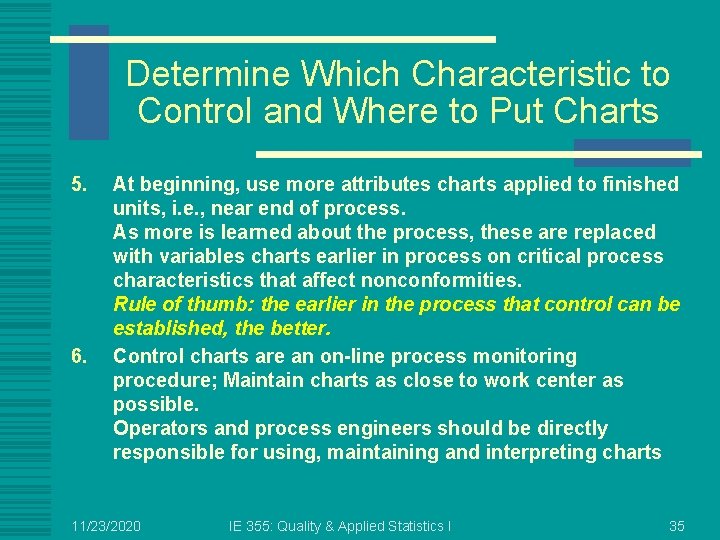
Determine Which Characteristic to Control and Where to Put Charts 5. 6. At beginning, use more attributes charts applied to finished units, i. e. , near end of process. As more is learned about the process, these are replaced with variables charts earlier in process on critical process characteristics that affect nonconformities. Rule of thumb: the earlier in the process that control can be established, the better. Control charts are an on-line process monitoring procedure; Maintain charts as close to work center as possible. Operators and process engineers should be directly responsible for using, maintaining and interpreting charts 11/23/2020 IE 355: Quality & Applied Statistics I 35
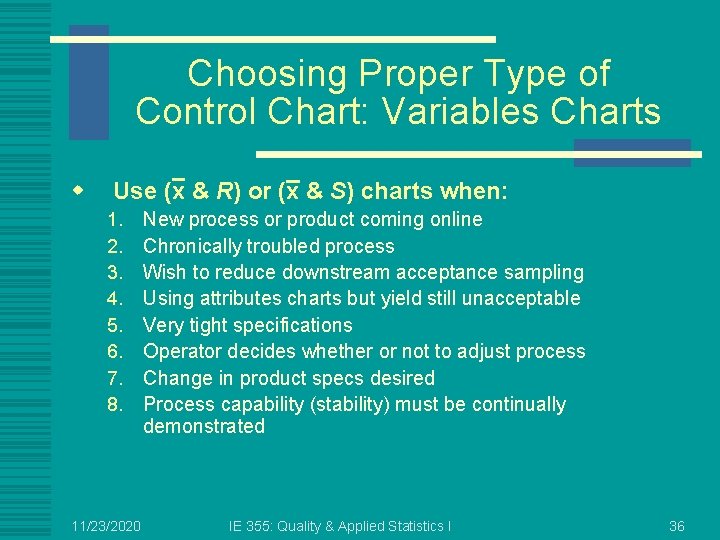
Choosing Proper Type of Control Chart: Variables Charts w Use (x & R) or (x & S) charts when: 1. 2. 3. 4. 5. 6. 7. 8. 11/23/2020 New process or product coming online Chronically troubled process Wish to reduce downstream acceptance sampling Using attributes charts but yield still unacceptable Very tight specifications Operator decides whether or not to adjust process Change in product specs desired Process capability (stability) must be continually demonstrated IE 355: Quality & Applied Statistics I 36
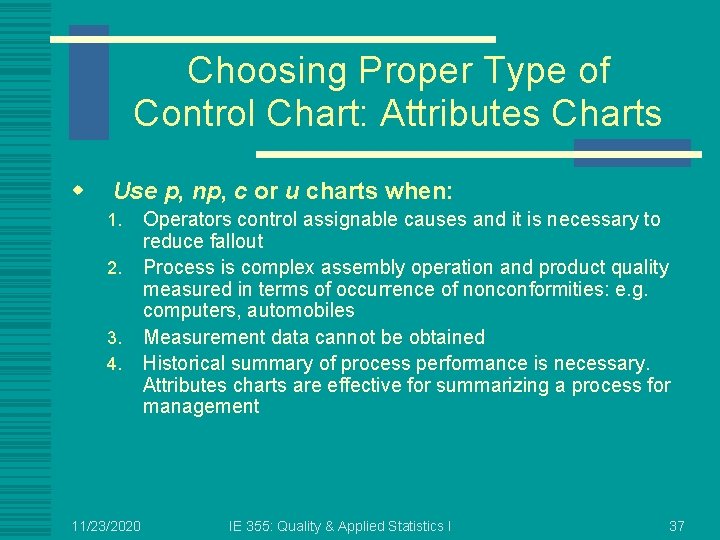
Choosing Proper Type of Control Chart: Attributes Charts w Use p, np, c or u charts when: 1. 2. 3. 4. 11/23/2020 Operators control assignable causes and it is necessary to reduce fallout Process is complex assembly operation and product quality measured in terms of occurrence of nonconformities: e. g. computers, automobiles Measurement data cannot be obtained Historical summary of process performance is necessary. Attributes charts are effective for summarizing a process for management IE 355: Quality & Applied Statistics I 37
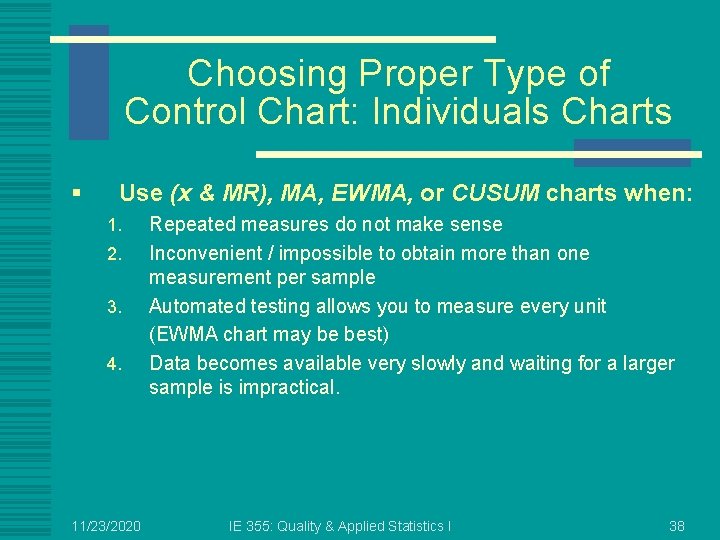
Choosing Proper Type of Control Chart: Individuals Charts § Use (x & MR), MA, EWMA, or CUSUM charts when: 1. 2. 3. 4. 11/23/2020 Repeated measures do not make sense Inconvenient / impossible to obtain more than one measurement per sample Automated testing allows you to measure every unit (EWMA chart may be best) Data becomes available very slowly and waiting for a larger sample is impractical. IE 355: Quality & Applied Statistics I 38