
IENG 486 Lecture 15 Gage Capability Studies 10242020

IENG 486 - Lecture 15 Gage Capability Studies 10/24/2020 IENG 486 Statistical Quality & Process Control 1

Bonus Points # 3 w In teams of 4 people, go to the Project Office and perform a gage R & R study on the 7 parts. w Half of the teams measured with the micrometer w Half of the teams measured with the dial calipers w Entire team works together to analyze the data – for the 4 Operators, estimate: n n n σ2 total σ2 repeatability σ2 reproducability σ2 product P/T for gage, assuming USL – LSL = 0. 005” 10/24/2020 IENG 486 Statistical Quality & Process Control 2
Bonus Points # 4 w In teams of 4 people, go to the CIM Lab (CM 203) and set up a control chart strategy for the “pipe-bomb” machine. w Dr. Jensen will demonstrate the system, each team operates afterward. w The team will collect data using the scale, and track the data using the spreadsheet template, each control chart should have 30 samples. w Entire team works together to collect and analyze the data for the system, and to create and interpret x – and R – charts. w For the lab exercise, briefly report: n n n What your control chart strategy is (what did you measure and why) Turn in print out of your trial control charts, and describe how the limits were developed For each control chart, use your Trial Control Limits* on all 30 sample points, and interpret each chart for control using the 4 Western Electric Rules: l l 10/24/2020 Convert your Trial Control Limit data to Standards Circle Western Electric Rule violations, and describe what they show IENG 486 Statistical Quality & Process Control 3
Gage Capability Studies w Ensuring adequate gage and inspection system capability w In any problem involving measurement the observed variability in product is due to two sources: n n Product variability - σ2 product Gage variability - σ2 gage i. e. , measurement error w Total observed variance in product: σ2 total = σ2 product + σ2 gage (system) 10/24/2020 IENG 486 Statistical Quality & Process Control 4
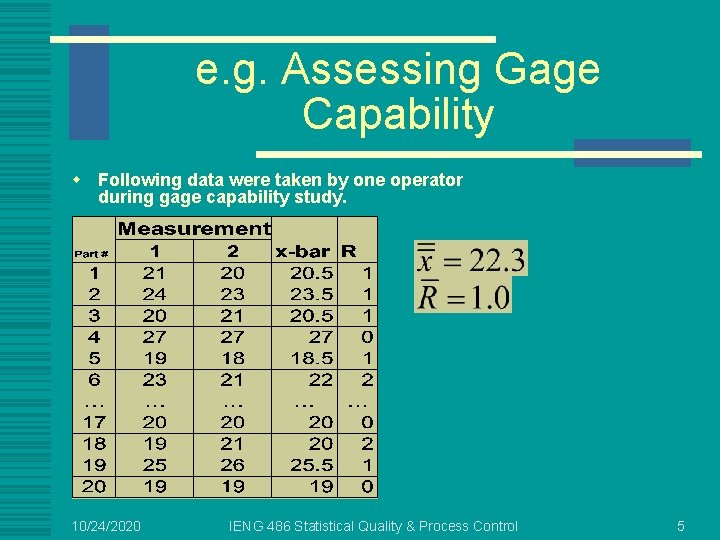
e. g. Assessing Gage Capability w Following data were taken by one operator during gage capability study. 10/24/2020 IENG 486 Statistical Quality & Process Control 5
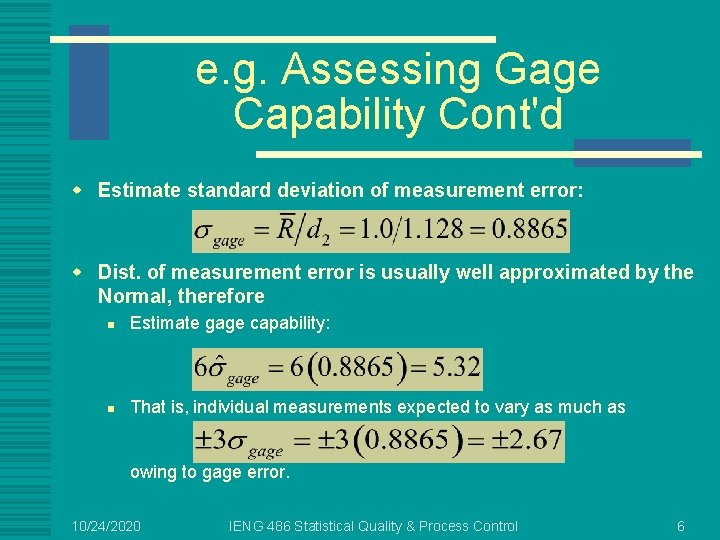
e. g. Assessing Gage Capability Cont'd w Estimate standard deviation of measurement error: w Dist. of measurement error is usually well approximated by the Normal, therefore n Estimate gage capability: n That is, individual measurements expected to vary as much as owing to gage error. 10/24/2020 IENG 486 Statistical Quality & Process Control 6
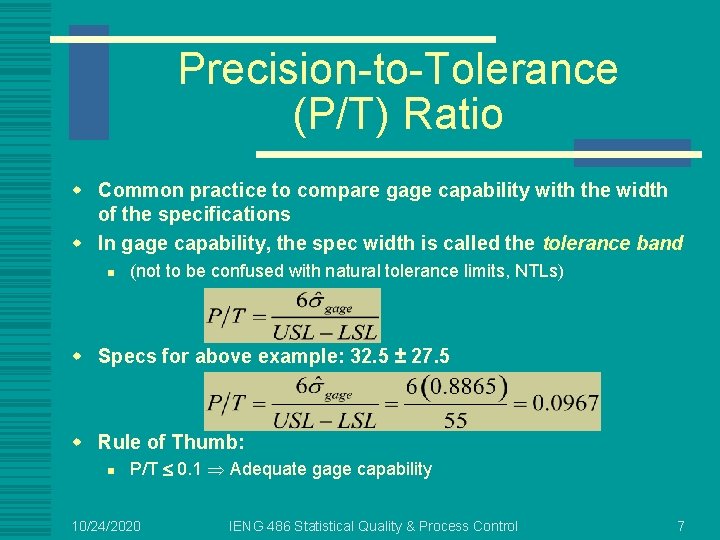
Precision-to-Tolerance (P/T) Ratio w Common practice to compare gage capability with the width of the specifications w In gage capability, the spec width is called the tolerance band n (not to be confused with natural tolerance limits, NTLs) w Specs for above example: 32. 5 ± 27. 5 w Rule of Thumb: n P/T 0. 1 Adequate gage capability 10/24/2020 IENG 486 Statistical Quality & Process Control 7
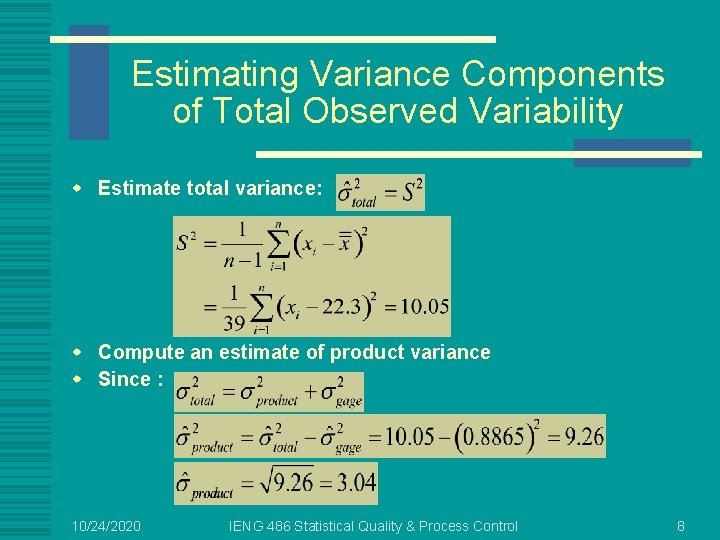
Estimating Variance Components of Total Observed Variability w Estimate total variance: w Compute an estimate of product variance w Since : 10/24/2020 IENG 486 Statistical Quality & Process Control 8
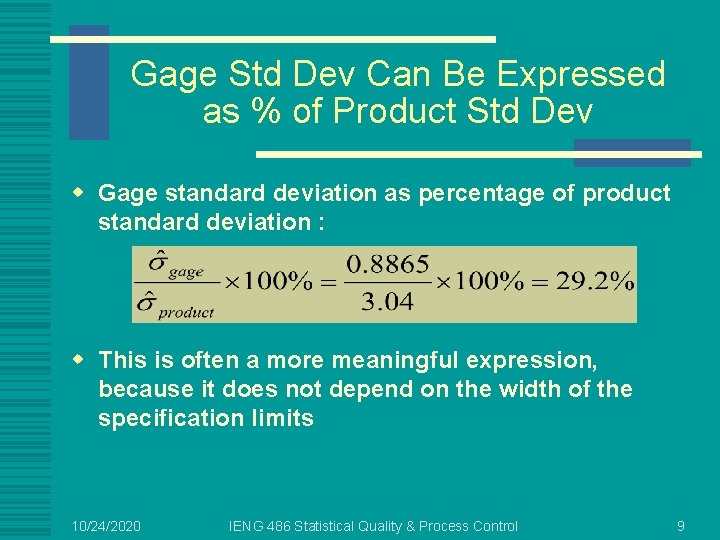
Gage Std Dev Can Be Expressed as % of Product Std Dev w Gage standard deviation as percentage of product standard deviation : w This is often a more meaningful expression, because it does not depend on the width of the specification limits 10/24/2020 IENG 486 Statistical Quality & Process Control 9
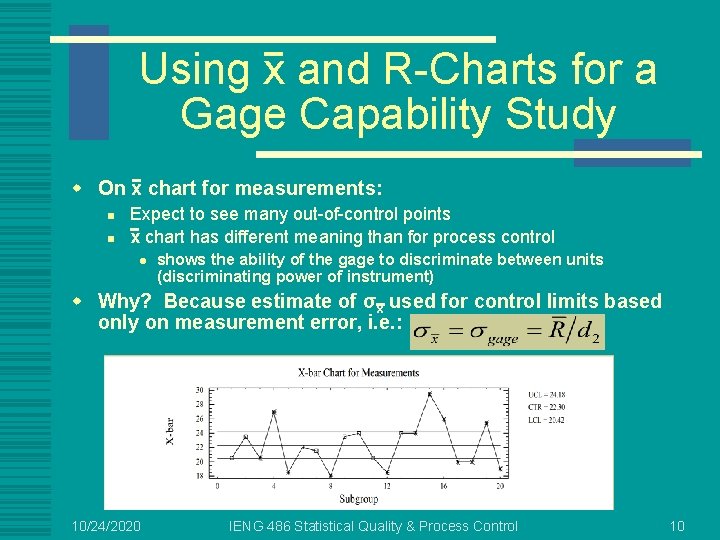
Using x and R-Charts for a Gage Capability Study w On x chart for measurements: n n Expect to see many out-of-control points x chart has different meaning than for process control l shows the ability of the gage to discriminate between units (discriminating power of instrument) w Why? Because estimate of σx used for control limits based only on measurement error, i. e. : 10/24/2020 IENG 486 Statistical Quality & Process Control 10
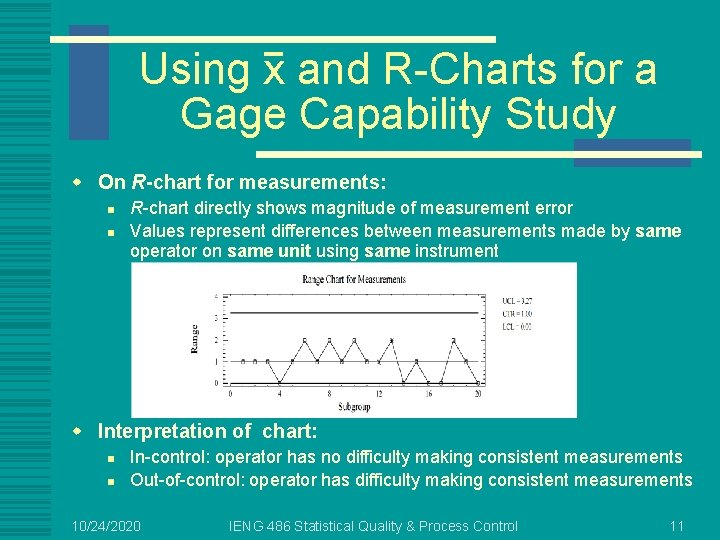
Using x and R-Charts for a Gage Capability Study w On R-chart for measurements: n n R-chart directly shows magnitude of measurement error Values represent differences between measurements made by same operator on same unit using same instrument w Interpretation of chart: n n In-control: operator has no difficulty making consistent measurements Out-of-control: operator has difficulty making consistent measurements 10/24/2020 IENG 486 Statistical Quality & Process Control 11
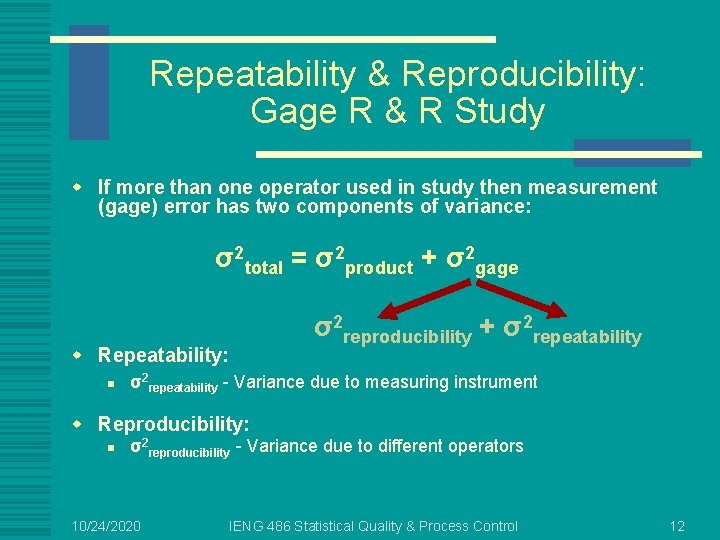
Repeatability & Reproducibility: Gage R & R Study w If more than one operator used in study then measurement (gage) error has two components of variance: σ2 total = σ2 product + σ2 gage σ2 reproducibility + σ2 repeatability w Repeatability: n σ2 repeatability - Variance due to measuring instrument w Reproducibility: n σ2 reproducibility - Variance due to different operators 10/24/2020 IENG 486 Statistical Quality & Process Control 12
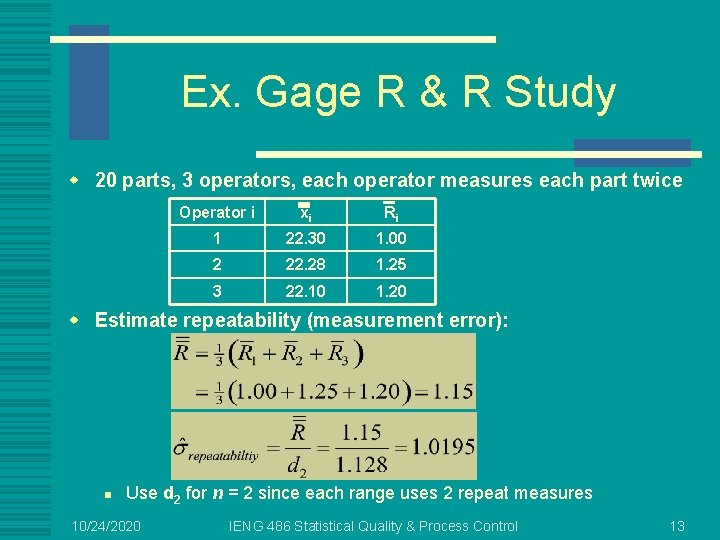
Ex. Gage R & R Study w 20 parts, 3 operators, each operator measures each part twice Operator i xi Ri 1 22. 30 1. 00 2 22. 28 1. 25 3 22. 10 1. 20 w Estimate repeatability (measurement error): n Use d 2 for n = 2 since each range uses 2 repeat measures 10/24/2020 IENG 486 Statistical Quality & Process Control 13
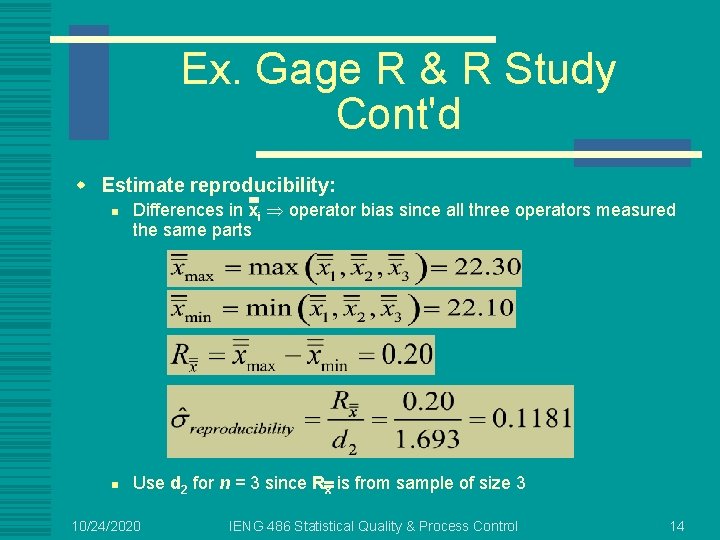
Ex. Gage R & R Study Cont'd w Estimate reproducibility: n n Differences in xi operator bias since all three operators measured the same parts Use d 2 for n = 3 since Rx is from sample of size 3 10/24/2020 IENG 486 Statistical Quality & Process Control 14
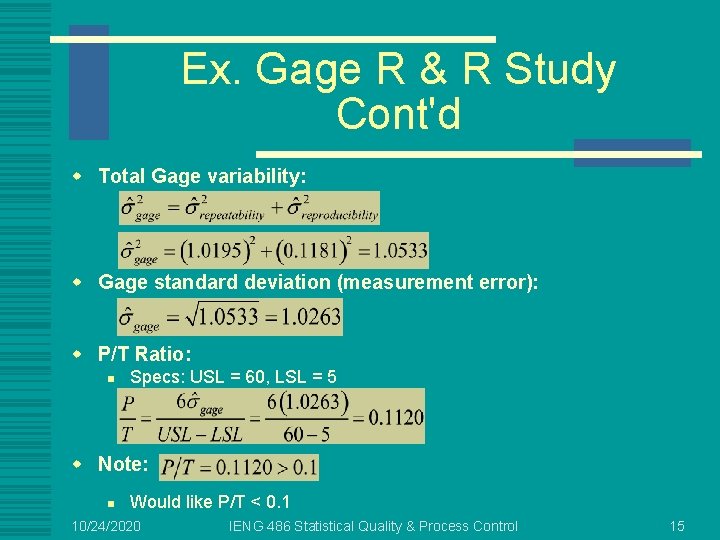
Ex. Gage R & R Study Cont'd w Total Gage variability: w Gage standard deviation (measurement error): w P/T Ratio: n Specs: USL = 60, LSL = 5 w Note: n Would like P/T < 0. 1 10/24/2020 IENG 486 Statistical Quality & Process Control 15
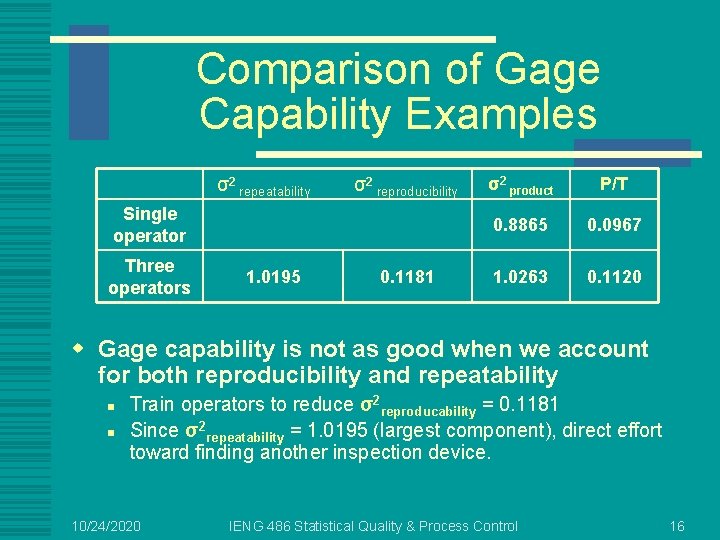
Comparison of Gage Capability Examples σ2 repeatability σ2 reproducibility Single operator Three operators 1. 0195 0. 1181 σ2 product P/T 0. 8865 0. 0967 1. 0263 0. 1120 w Gage capability is not as good when we account for both reproducibility and repeatability n n Train operators to reduce σ2 reproducability = 0. 1181 Since σ2 repeatability = 1. 0195 (largest component), direct effort toward finding another inspection device. 10/24/2020 IENG 486 Statistical Quality & Process Control 16
- Slides: 16