
IENG 486 Lecture 07 Comparison of Location Means
- Slides: 15
IENG 486 - Lecture 07 Comparison of Location (Means) 9/15/2020 IENG 486 Statistical Quality & Process Control 1
Assignment: w Preparation: n n Print Hypothesis Test Tables from Materials page Have this available in class …or exam! w Reading: n Chapter 4: l 4. 1. 1 through 4. 3. 4; (skip 4. 3. 5); 4. 3. 6 through 4. 4. 3; (skip rest) w HW 2: n CH 4: # 1 a, b; 5 a, c; 9 a, c, f; 11 a, b, d, g; 17 a, b; 18, 21 a, c; 22* *uses Fig. 4. 7, p. 126 9/15/2020 IENG 486 Statistical Quality & Process Control 2
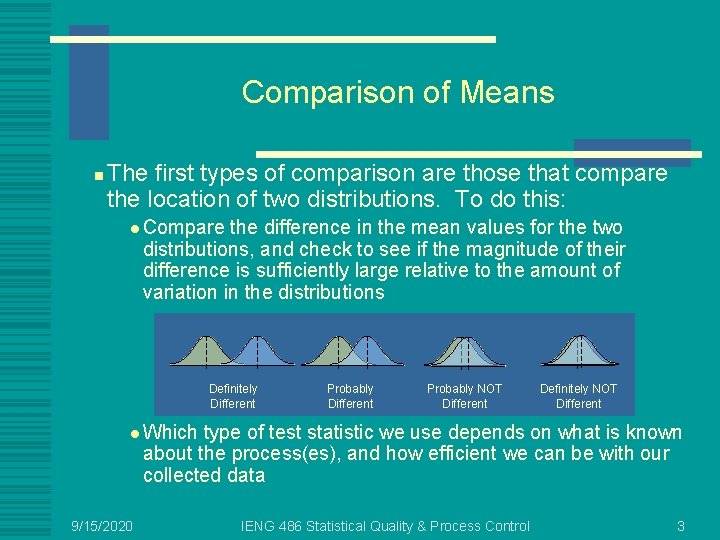
Comparison of Means n The first types of comparison are those that compare the location of two distributions. To do this: l Compare the difference in the mean values for the two distributions, and check to see if the magnitude of their difference is sufficiently large relative to the amount of variation in the distributions Definitely Different Probably NOT Different Definitely NOT Different l Which type of test statistic we use depends on what is known about the process(es), and how efficient we can be with our collected data 9/15/2020 IENG 486 Statistical Quality & Process Control 3
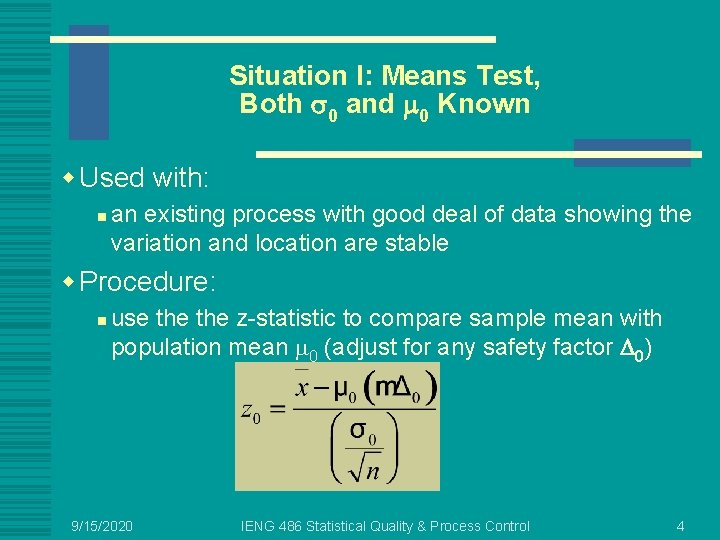
Situation I: Means Test, Both 0 and 0 Known w Used with: n an existing process with good deal of data showing the variation and location are stable w Procedure: n use the z-statistic to compare sample mean with population mean 0 (adjust for any safety factor 0) 9/15/2020 IENG 486 Statistical Quality & Process Control 4
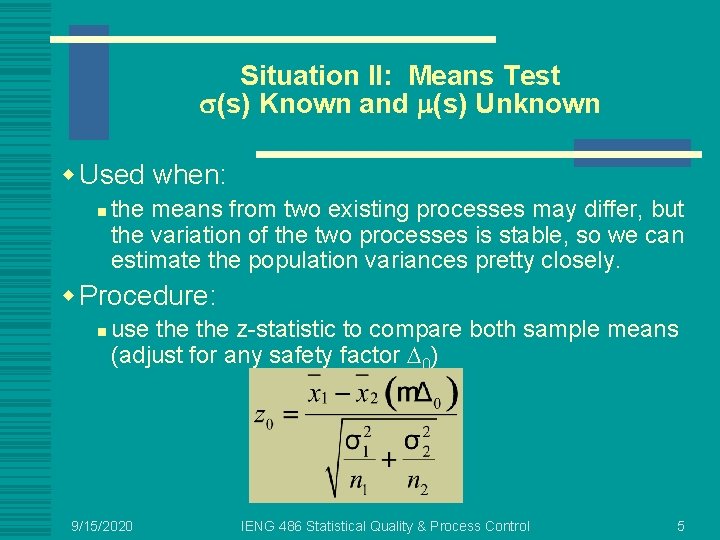
Situation II: Means Test (s) Known and (s) Unknown w Used when: n the means from two existing processes may differ, but the variation of the two processes is stable, so we can estimate the population variances pretty closely. w Procedure: n use the z-statistic to compare both sample means (adjust for any safety factor 0) 9/15/2020 IENG 486 Statistical Quality & Process Control 5
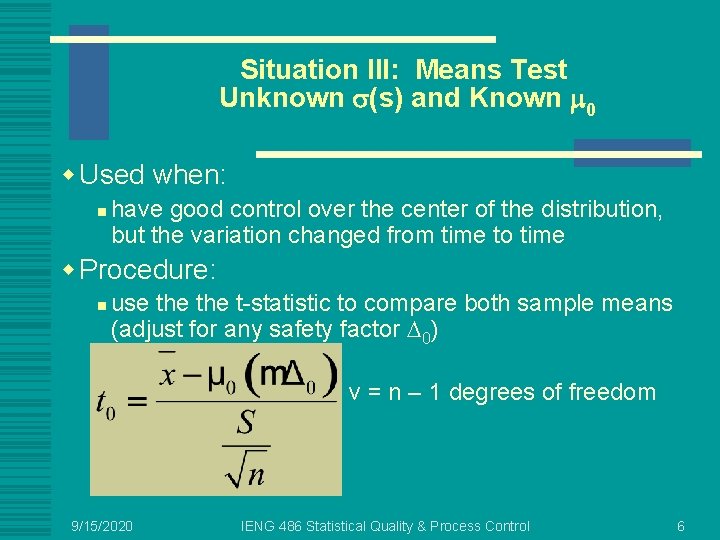
Situation III: Means Test Unknown (s) and Known 0 w Used when: n have good control over the center of the distribution, but the variation changed from time to time w Procedure: n use the t-statistic to compare both sample means (adjust for any safety factor 0) v = n – 1 degrees of freedom 9/15/2020 IENG 486 Statistical Quality & Process Control 6
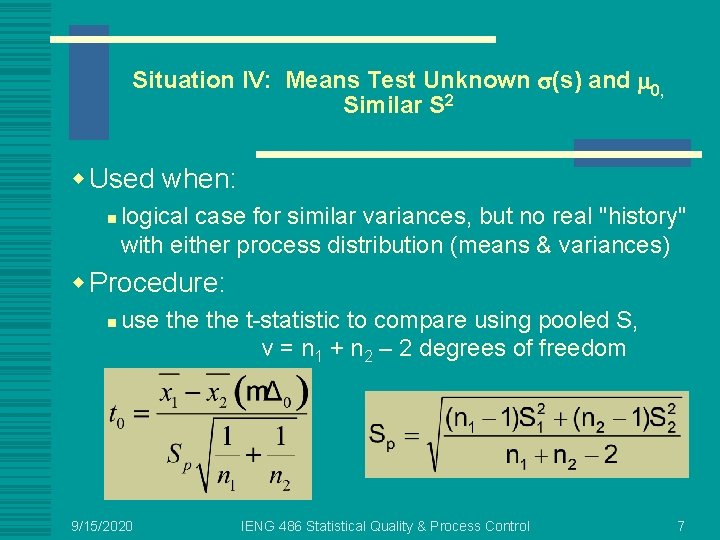
Situation IV: Means Test Unknown (s) and 0, Similar S 2 w Used when: n logical case for similar variances, but no real "history" with either process distribution (means & variances) w Procedure: n use the t-statistic to compare using pooled S, v = n 1 + n 2 – 2 degrees of freedom 9/15/2020 IENG 486 Statistical Quality & Process Control 7
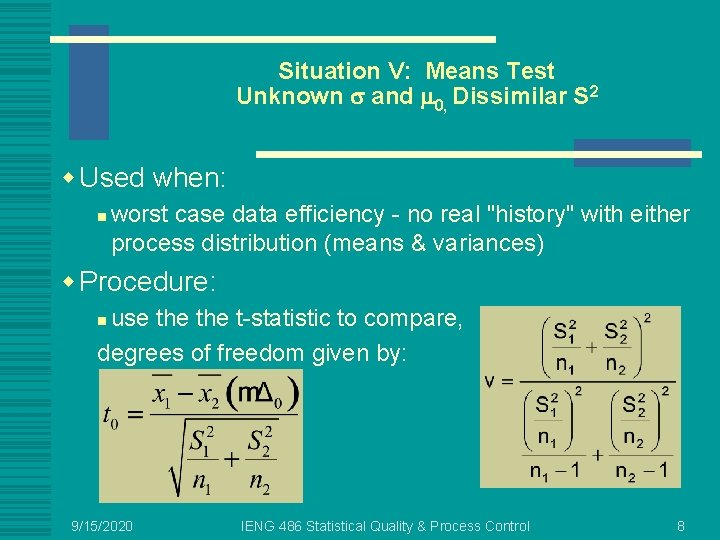
Situation V: Means Test Unknown and 0, Dissimilar S 2 w Used when: n worst case data efficiency - no real "history" with either process distribution (means & variances) w Procedure: use the t-statistic to compare, degrees of freedom given by: n 9/15/2020 IENG 486 Statistical Quality & Process Control 8
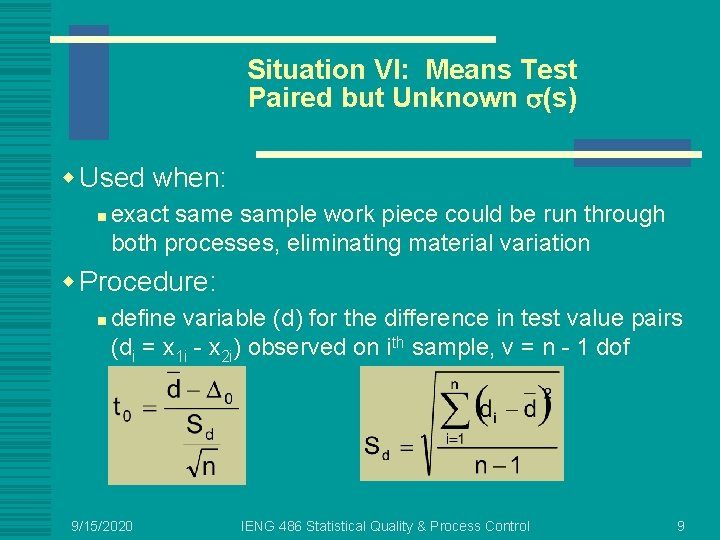
Situation VI: Means Test Paired but Unknown (s) w Used when: n exact same sample work piece could be run through both processes, eliminating material variation w Procedure: n define variable (d) for the difference in test value pairs (di = x 1 i - x 2 i) observed on ith sample, v = n - 1 dof 9/15/2020 IENG 486 Statistical Quality & Process Control 9
Table for Means Comparisons w Decision on which test to use is based on answering (at least some of) the following: n n n Do we know the population variance ( 2) or should we estimate it by the sample variance (s 2) ? Do we know theoretical mean ( ), or should we estimate it by the sample mean (y) ? Do we know if the samples have equal-variance ( 12 = 22) ? Have we conducted a paired comparison? What are we trying to decide (alternate hypothesis)? 9/15/2020 IENG 486 Statistical Quality & Process Control 10
Table for Means Comparisons w These questions tell us: n n What sampling distribution to use What test statistic(s) to use What criteria to use How to construct the confidence interval w Six major test statistics for mean comparisons n n n Two sampling distributions Six confidence intervals Twelve alternate hypotheses 9/15/2020 IENG 486 Statistical Quality & Process Control 11
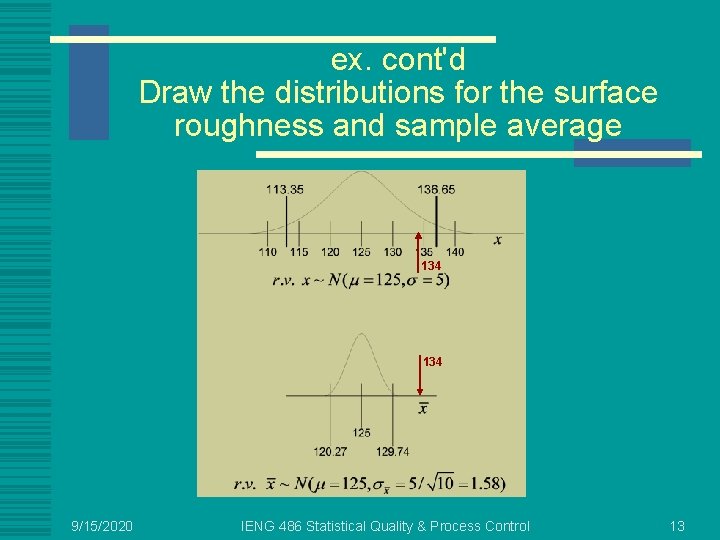
Ex. Surface Roughness w Surface roughness is normally distributed with mean 125 and std dev of 5. The specification is 125 ± 11. 65 and we have calculated that 98% of parts are within specs during usual production. w My supplier of these parts has sent me a large shipment. I take a random sample of 10 parts. The sample average roughness is 134 which is within specifications. w Test the hypothesis that the lot roughness is higher than specifications. 9/15/2020 IENG 486 Statistical Quality & Process Control 12
ex. cont'd Draw the distributions for the surface roughness and sample average 134 9/15/2020 IENG 486 Statistical Quality & Process Control 13
e. g. Surface Roughness Cont'd w Find the probability that the sample with average 134 comes from a population with mean 125 and std dev of 5. w Should I accept this shipment? 9/15/2020 IENG 486 Statistical Quality & Process Control 14
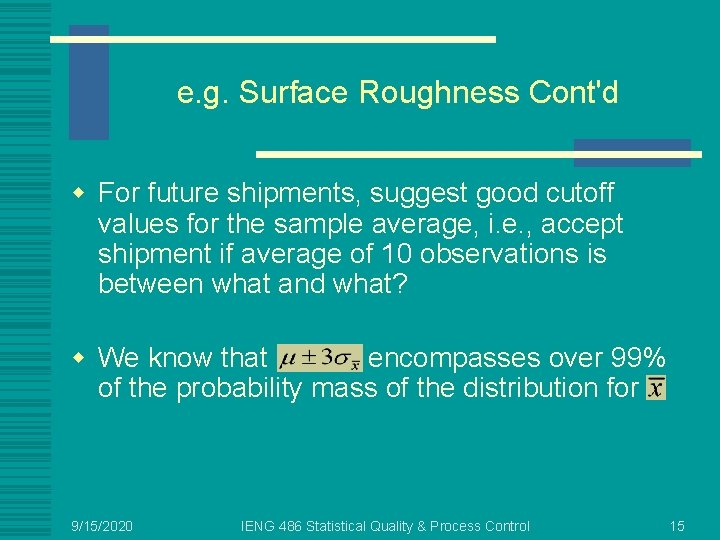
e. g. Surface Roughness Cont'd w For future shipments, suggest good cutoff values for the sample average, i. e. , accept shipment if average of 10 observations is between what and what? w We know that encompasses over 99% of the probability mass of the distribution for 9/15/2020 IENG 486 Statistical Quality & Process Control 15