
IENG 471 Lecture 15 Layout Planning Systematic Layout

- Slides: 26
IENG 471 - Lecture 15 Layout Planning – Systematic Layout Planning & Intro to Mathematical Layout Improvement 11/9/2020 IENG 471 Facilities Planning 1
Warehousing Terms - Review l SKU – Stock Keeping Unit l Product in (packaged) form for warehouse operations. l Value-Added l A modification to the product to obtain business (a product enhancement from the customer’s perspective or an enhancement to the customer’s experience in getting the item). l Cross-Docking l Transforming incoming product to outgoing product without moving the product to production or storage. l Slotting l Selecting the location of SKUs in the storage zones. Goal is to optimize (reduce) pick times across all SKUs within a zone. l Forward Pick Area l An area housing fast-moving/frequently-picked items between the shipping and storage areas for quick order fulfillment. 11/9/2020 IENG 471 Facilities Planning 2
Layout Alternatives - Strategies l Fixed Position Layout l (Difficult-to-move Products) l Process Layout l (Job Shop) l Product Layout l (Mass Production Line) l Group Technology Layout l (Product Family) 11/9/2020 IENG 471 Facilities Planning 3
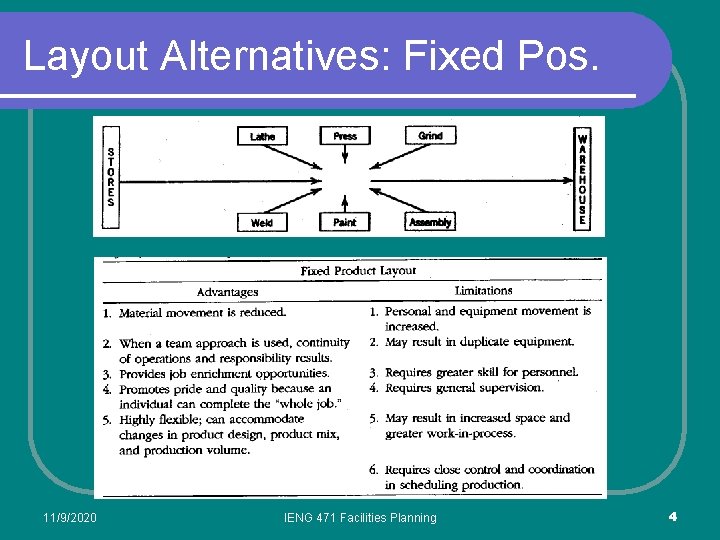
Layout Alternatives: Fixed Pos. 11/9/2020 IENG 471 Facilities Planning 4
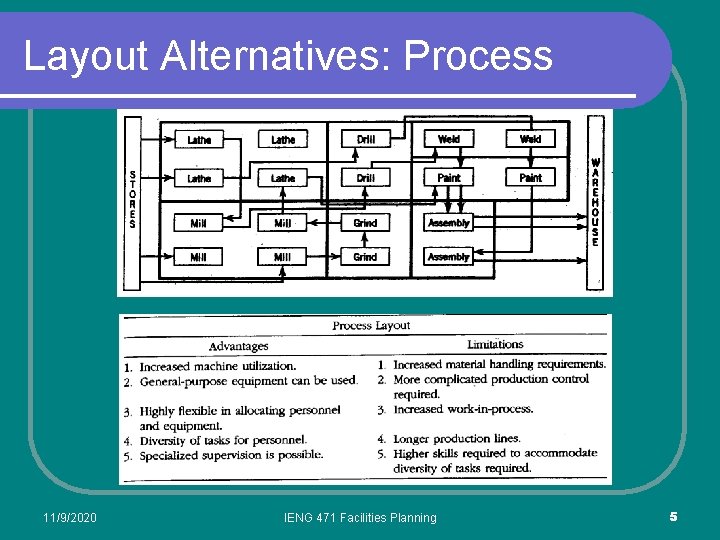
Layout Alternatives: Process 11/9/2020 IENG 471 Facilities Planning 5
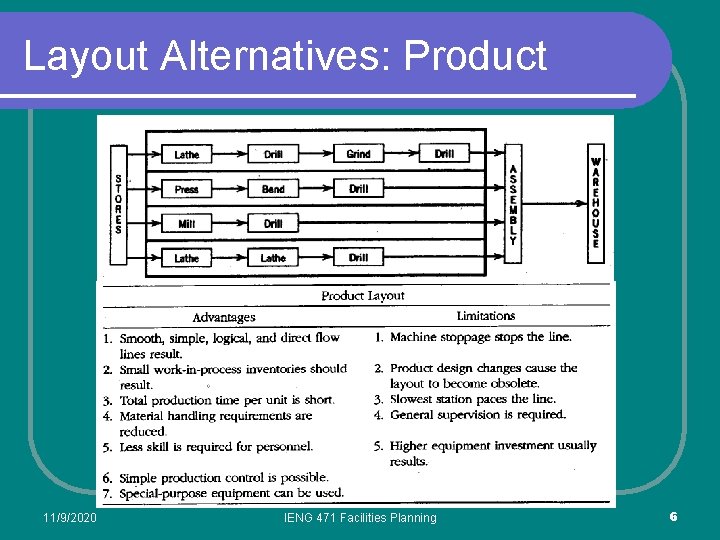
Layout Alternatives: Product 11/9/2020 IENG 471 Facilities Planning 6
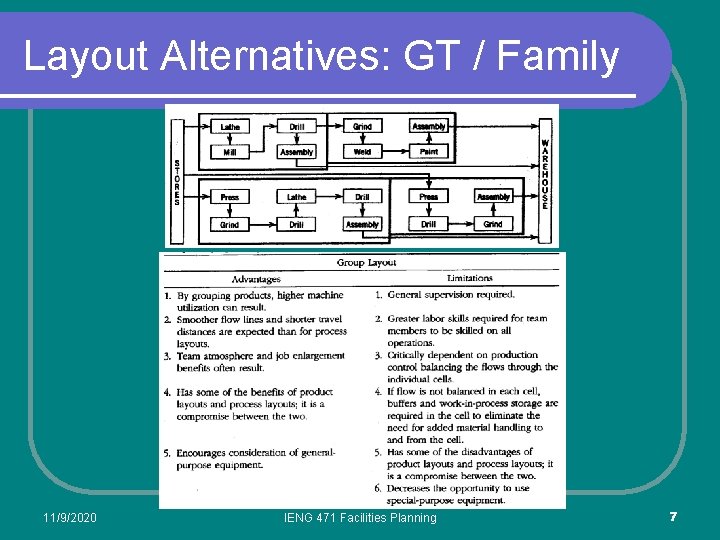
Layout Alternatives: GT / Family 11/9/2020 IENG 471 Facilities Planning 7
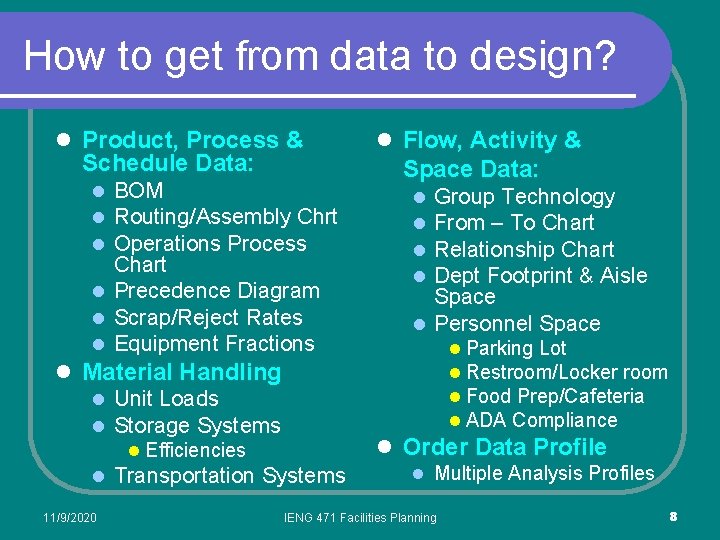
How to get from data to design? l Product, Process & Schedule Data: l BOM l Routing/Assembly Chrt l Operations Process Chart l Precedence Diagram l Scrap/Reject Rates l Equipment Fractions l Flow, Activity & Space Data: Group Technology From – To Chart Relationship Chart Dept Footprint & Aisle Space l Personnel Space l l l Parking Lot l Restroom/Locker room l Food Prep/Cafeteria l ADA Compliance l Material Handling l Unit Loads l Storage Systems l Efficiencies l Transportation Systems 11/9/2020 l Order Data Profile l Multiple Analysis Profiles IENG 471 Facilities Planning 8
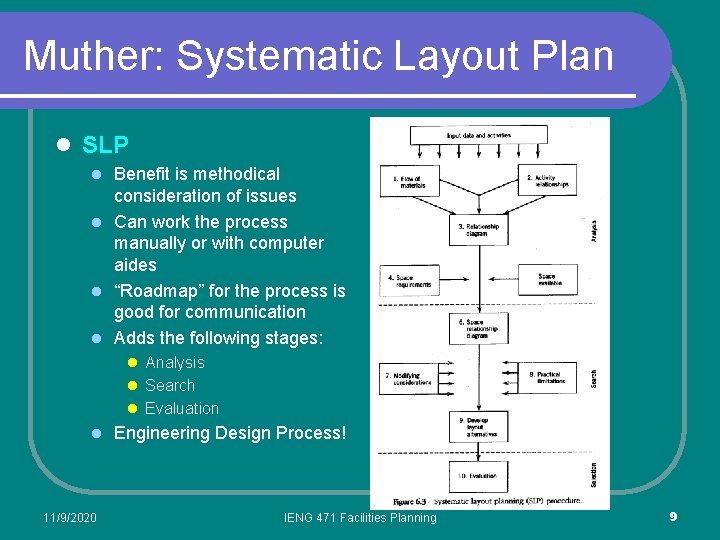
Muther: Systematic Layout Plan l SLP l Benefit is methodical consideration of issues l Can work the process manually or with computer aides l “Roadmap” for the process is good for communication l Adds the following stages: l Analysis l Search l Evaluation l Engineering Design Process! 11/9/2020 IENG 471 Facilities Planning 9
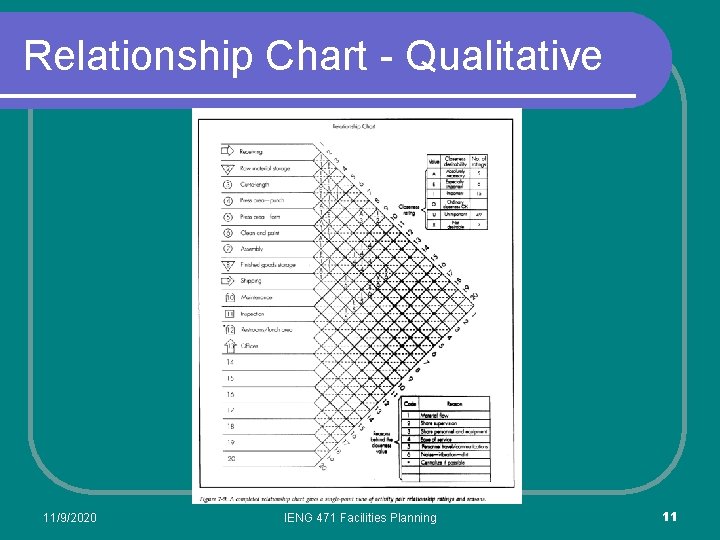
Relationship Chart - Qualitative 11/9/2020 IENG 471 Facilities Planning 11
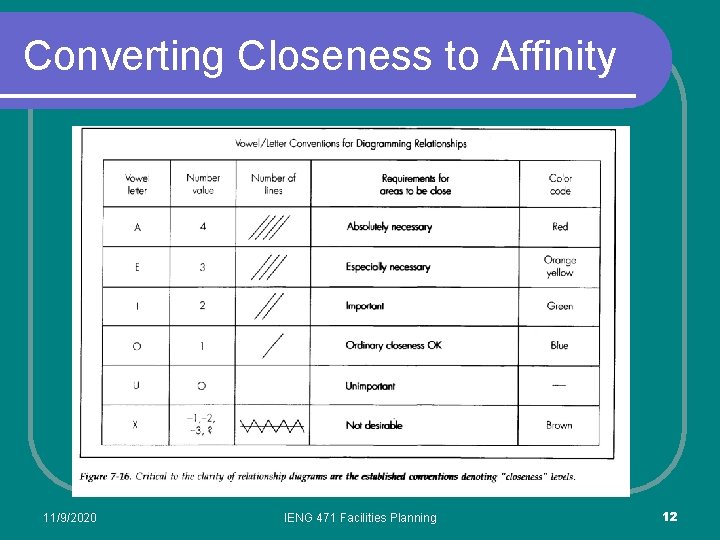
Converting Closeness to Affinity 11/9/2020 IENG 471 Facilities Planning 12
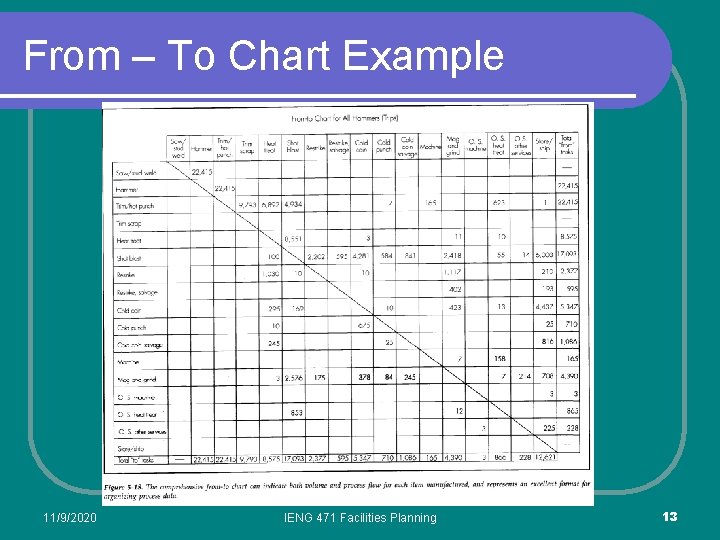
From – To Chart Example 11/9/2020 IENG 471 Facilities Planning 13
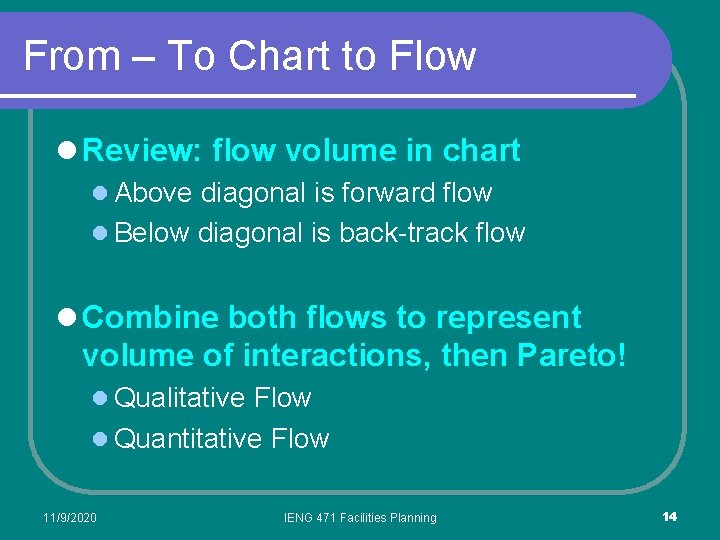
From – To Chart to Flow l Review: flow volume in chart l Above diagonal is forward flow l Below diagonal is back-track flow l Combine both flows to represent volume of interactions, then Pareto! l Qualitative Flow l Quantitative Flow 11/9/2020 IENG 471 Facilities Planning 14
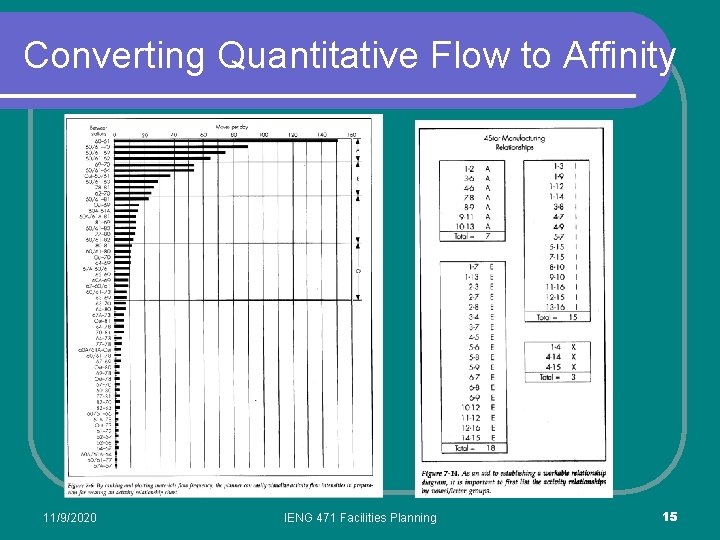
Converting Quantitative Flow to Affinity 11/9/2020 IENG 471 Facilities Planning 15
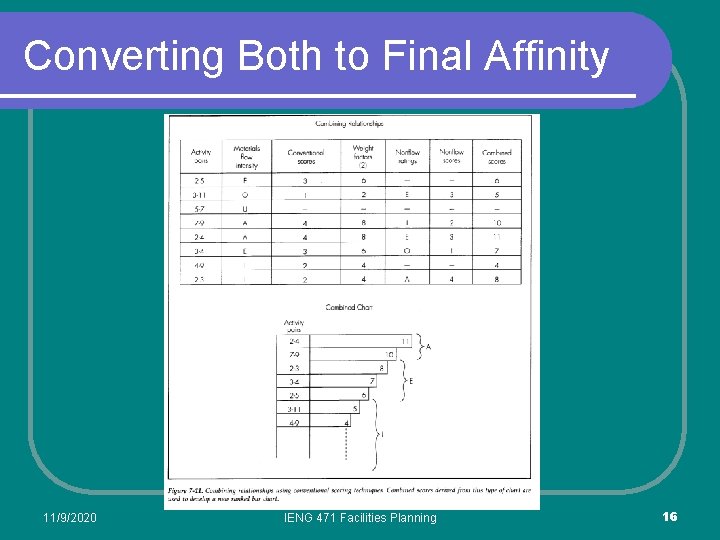
Converting Both to Final Affinity 11/9/2020 IENG 471 Facilities Planning 16
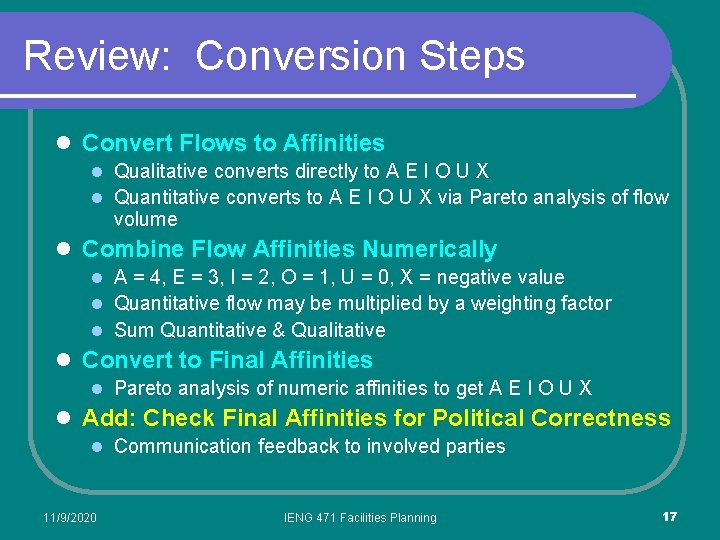
Review: Conversion Steps l Convert Flows to Affinities l Qualitative converts directly to A E I O U X l Quantitative converts to A E I O U X via Pareto analysis of flow volume l Combine Flow Affinities Numerically l A = 4, E = 3, I = 2, O = 1, U = 0, X = negative value l Quantitative flow may be multiplied by a weighting factor l Sum Quantitative & Qualitative l Convert to Final Affinities l Pareto analysis of numeric affinities to get A E I O U X l Add: Check Final Affinities for Political Correctness l Communication feedback to involved parties 11/9/2020 IENG 471 Facilities Planning 17
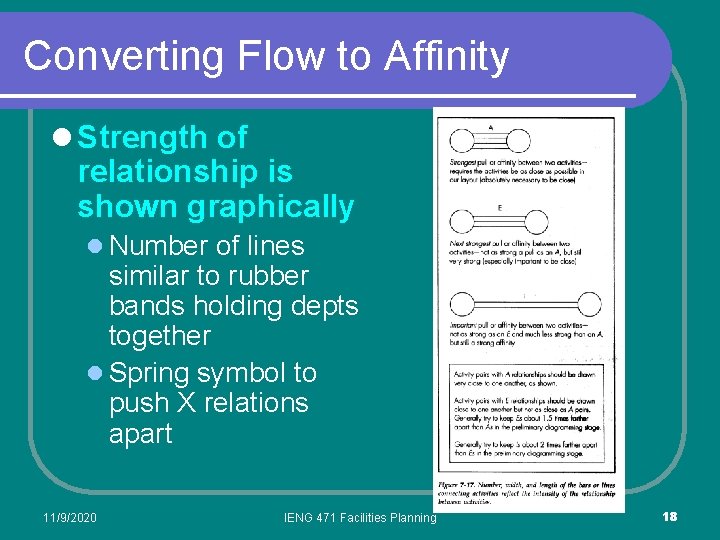
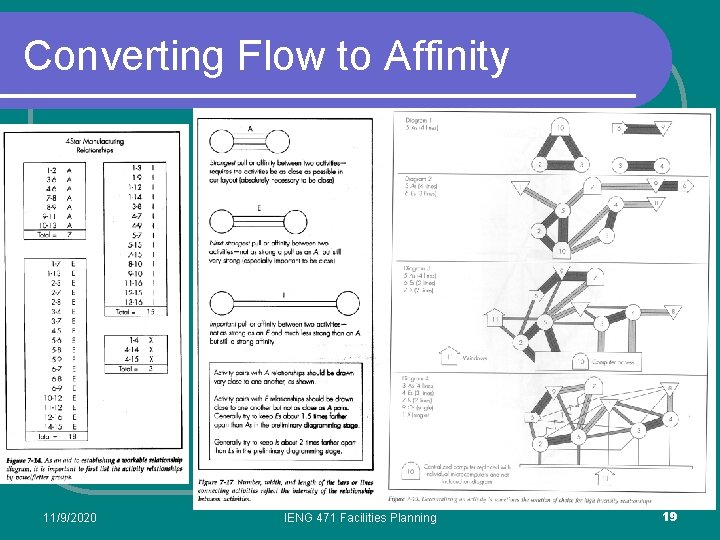
Converting Flow to Affinity l Strength of relationship is shown graphically l Number of lines similar to rubber bands holding depts together l Spring symbol to push X relations apart 11/9/2020 IENG 471 Facilities Planning 18
Converting Flow to Affinity 11/9/2020 IENG 471 Facilities Planning 19
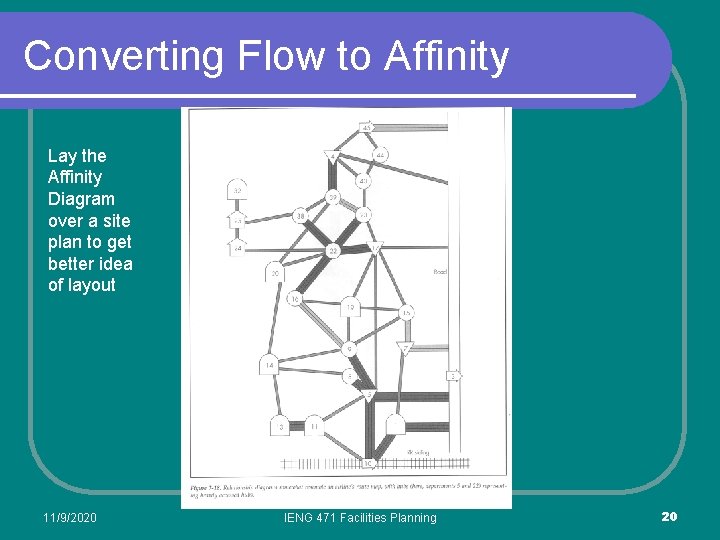
Converting Flow to Affinity Lay the Affinity Diagram over a site plan to get better idea of layout 11/9/2020 IENG 471 Facilities Planning 20
Improvement: Size of Departments l Some experts suggest modification: l Use circles instead of flow symbols l Scale circles to equate with the estimated size of the departments l Use rectangular, sized blocks instead of circles – improves input to computer layout methods l Computer packages are still being developed … 11/9/2020 IENG 471 Facilities Planning 21
Layout Models – Mathematical Objective Functions l Mathematical models can be constructed to measure a design, and help to quantify when it has been improved l Like many mathematical models of physical systems, part of the “art” is knowing what assumptions are made in a model, and when these assumptions are “reasonably met” l The “best” models are not always the most complex – in fact many “comprehensive” mathematical models become intractable or take too long for computation when scaled up to a “realistically–sized” problem l Frequently, meeting the data collection (and verification) requirements for many mathematical problems is very difficult l However, as the cost of automated data collection and storage drops, and has computational power increases (hardware speeds and parallel programming techniques improve), both mathematical models and simulations become more attractive – more tools for the toolbox! 11/9/2020 IENG 471 Facilities Planning 22
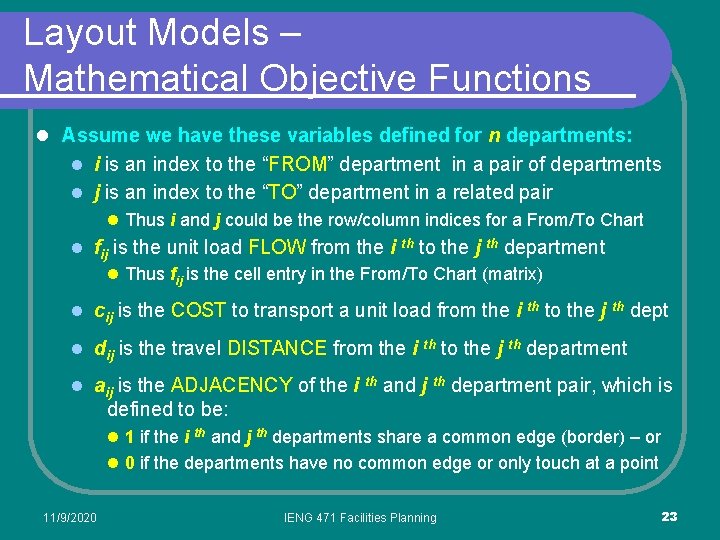
Layout Models – Mathematical Objective Functions l Assume we have these variables defined for n departments: l i is an index to the “FROM” department in a pair of departments l j is an index to the “TO” department in a related pair l Thus i and j could be the row/column indices for a From/To Chart l fij is the unit load FLOW from the i th to the j th department l Thus fij is the cell entry in the From/To Chart (matrix) l cij is the COST to transport a unit load from the i l dij is the travel DISTANCE from the i l aij is the ADJACENCY of the i th th th to the j th dept to the j th department and j th department pair, which is defined to be: l 1 if the i and j th departments share a common edge (border) – or l 0 if the departments have no common edge or only touch at a point 11/9/2020 th IENG 471 Facilities Planning 23
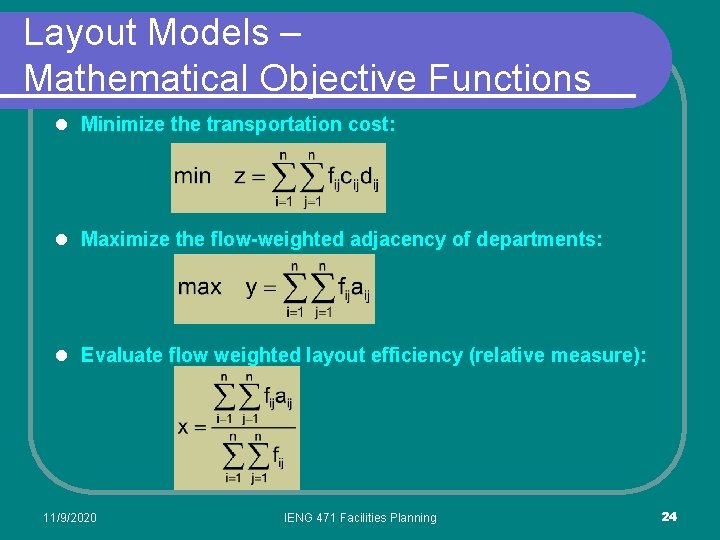
Layout Models – Mathematical Objective Functions l Minimize the transportation cost: l Maximize the flow-weighted adjacency of departments: l Evaluate flow weighted layout efficiency (relative measure): 11/9/2020 IENG 471 Facilities Planning 24
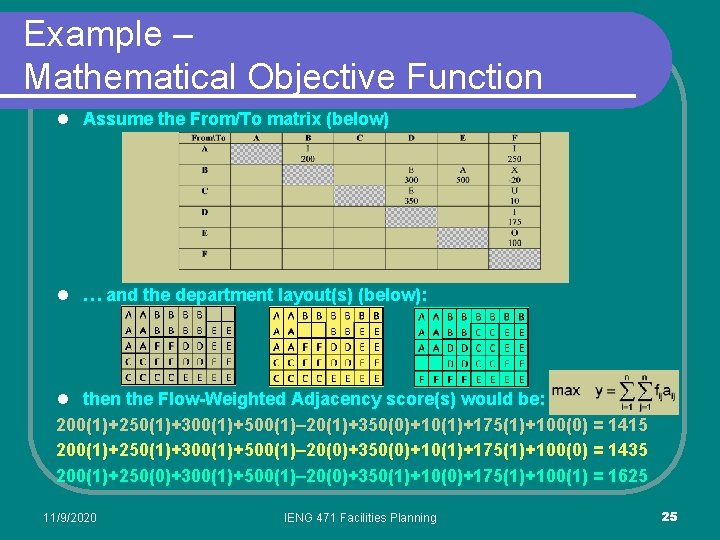
Example – Mathematical Objective Function l Assume the From/To matrix (below) l … and the department layout(s) (below): l then the Flow-Weighted Adjacency score(s) would be: 200(1)+250(1)+300(1)+500(1)– 20(1)+350(0)+10(1)+175(1)+100(0) = 1415 200(1)+250(1)+300(1)+500(1)– 20(0)+350(0)+10(1)+175(1)+100(0) = 1435 200(1)+250(0)+300(1)+500(1)– 20(0)+350(1)+10(0)+175(1)+100(1) = 1625 11/9/2020 IENG 471 Facilities Planning 25
Criticisms and Resources l Frequently, improvements in the simpler mathematical objective functions result in long, “snake-y” department shapes l Not always physically possible l Adjusting the objective function to penalize snake-y results in more complex objective functions l Data representations become more complex, too – and can increase computation time disproportionately l The simple, transportation cost function assumes we move from/to the center “point” of the departments l Isn’t really accurate for real departments (especially large sized) l Becomes even less true when the departments get more snake-y l Text Chapter 10 presents more mathematical models–try some! l MIL Lab computers have some software available l The software tends to be research prototypes, but can be fun to try! 11/9/2020 IENG 471 Facilities Planning 26
Questions & Issues l Class time is for project (after Exam II) l Review & HW solutions TODAY. l Exam II scheduled for 07 NOV. 11/9/2020 IENG 471 Facilities Planning 27