IEEE TRANSACTIONS ON VISUALIZATION AND COMPUTER GRAPHICS VOL


 A video game is an")


- Slides: 8
IEEE TRANSACTIONS ON VISUALIZATION AND COMPUTER GRAPHICS, VOL. 20, NO. 12, DECEMBER 2014 2211 1077 -2626 © 2014 IEEE. The Persuasive Power of Data Visualization Anshul Vikram Pandey, Anjali Manivannan, Oded Nov, Margaret Satterthwaite, and Enrico Bertini, little research has been done to examine the effects of data visualization in influencing users or in making a message more persuasive. We compare visual treatments with data presented through barcharts and linecharts on the one hand, treatments with data presented through tables on the other, and then evaluate their persuasiveness.
Ai partecipanti viene dato un un paragrafo introduttivo, poi un questionario di attitudine con il quale vengono classificati in una di 3 posizioni: NP polarizzati negativamente NWP neutrali PP polarizzati positivamente Scala lickert 7 punti Fino a che punto sei d’accordo che… abbassare le tasse federali aumenta I lavori?
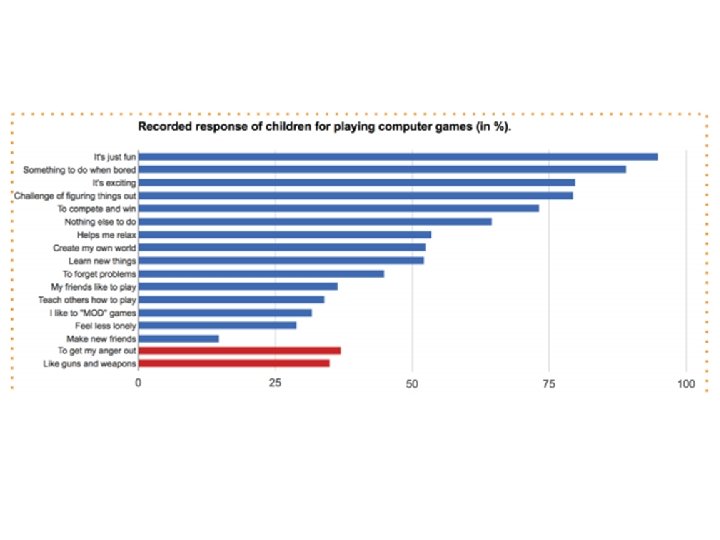
VG I videogame violenti non aumenta la violenza giovanile) A video game is an electronic game that involves human interaction with a user interface to generate visual feedback on a video device. Controversies over video games center on debates around video game content and the potential for it to negatively impact player attitude and behavior. Since the early 1980 s, video games have become part of the political discourse with advocates emphasizing their nature as an expressive medium (protected under the freedom of speech laws of many countries), and detractors promoting various theories that video games are harmful for society and thus subject to legislative oversight and restrictions. Sources : Wikipedia
Per i soggetti molto polarizzati sono più efficaci le tabelle Per i soggetti poco polarizzati sono più efficaci i grafici a barre