IDENTIFYING DRIVERS OF INTERANNUAL VARIABILITY IN HYDROCLIMATIC EXTREMES

IDENTIFYING DRIVERS OF INTER-ANNUAL VARIABILITY IN HYDROCLIMATIC EXTREMES: THE TEMPISQUE BASIN IN COSTA RICA Spring 2019

INTRODUCTION Today, we can state with certainty that our world is warming. This leads to the alteration of the occurrence and magnitude of extreme events like floods and droughts. To be able to predict how climate extremes could change in the near future, it is important to understand first the changes and behavior of extremes in the past. (Agha. Kouchak, Easterling, Hsu, Schubert, & Sorooshian, 2013).

MAIN OBJECTIVE The main goal of this research is to identify the variability of extreme precipitation in a basin in Costa Rica through Extreme Value Theory. Daily rainfall data from several stations in the basin has been acquired for this purpose. The results from this paper will help identify possible trends in climate variability in the area of research. Since water plays such an important role to the livelihood of the people the environment, and agriculture, the changes in precipitation in future scenarios will help understand how the system changes and reacts to shocks. This will improve decision-making processes and the overall resilience of the area of study

FOCUS QUESTIONS • Has the frequency of group-defined extreme events changed? (floods and droughts • What are the links between wet years, dry years or neutral years with the presence of El Niño and La Niña (ENSO phenomenon)?

PRESENT CURRENT DATA Meteorological stations IMN – Daily data What is the climate like in Guanacaste? Veranillo Period Number Name NICOYA EXTENSION 72101 AGRICOLA 72106 SANTA ROSA (PARQ. NAL) 72153 SANTA ELENA, LA CRUZ 72157 FINCA LA CEIBA, 74051 AEROP. LIBERIA OESTE 07 74053 SANTA CRUZ, 76055 HDA. MOJICA, PARQUE NACIONAL PALO 76057 VERDE Start End Years 1/1/1980 12/1/2004 5/1/1999 11/4/1998 3/9/1995 5/7/1999 11/30/2013 7/31/2015 12/31/2017 12/31/2017 33 35 13 18 19 22 18 11/1/2009 4/28/2017 8

Dry Season – November-April Dec Jan Nov N. E. Trades Feb Oct Mar Sep Apr Aug May Jul Jun ITCZ

Pre-Veranillos – May -June Dec Jan Nov N. E. Trades Feb ITCZ Oct Mar Sep Apr Aug May Jul Jun Cross. Equatorial Westerlies

Veranillos– July-August Dec Jan Nov N. E. Trades Feb Oct ITCZ Sep Apr Aug May Jul Jun Cross. Equatorial Westerlies

Post-Veranillos – September-October Dec Jan Nov N. E. Trades Feb ITCZ Oct Sep Apr Aug May Jul Jun Cross. Equatorial Westerlies

EXTREME VALUE THEORY • The word extreme can mean different things to different persons, it is then important to define what we mean by extreme event. An extreme event in this case, is the event that could be found in the tail(s) of a probability distribution. In extreme value theory, there are two approaches that stand-out: the generalized extreme value (GEV) and generalized Pareto (GP) distributions. Both these distributions can be assumed in a nonstationary approach (interesting when adding the climate change effect over time on extremes). The GEV and GP distribution are approximations for block maxima and for excesses over a certain threshold, respectively.
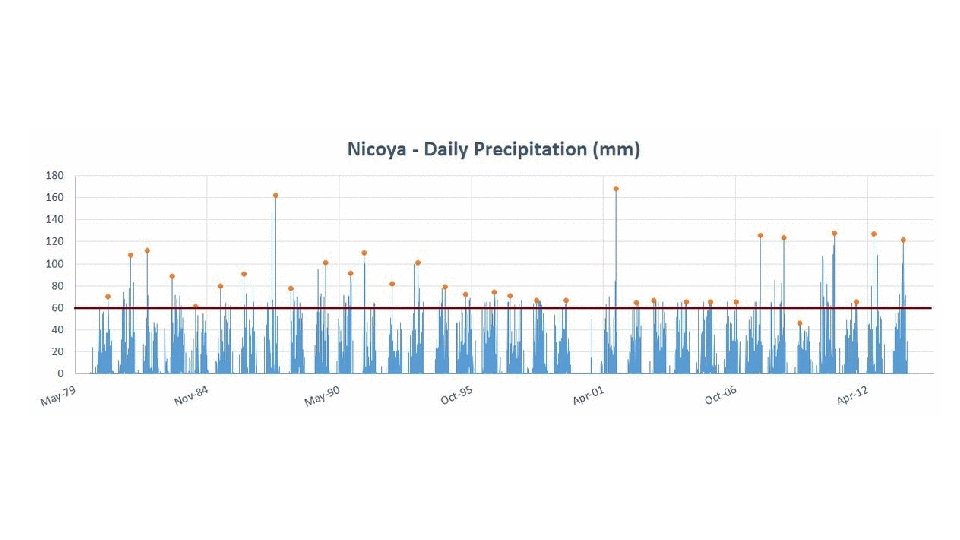

STATION 72101 - NICOYA Yearly maximum Precipitation 100% Probability of exceedance 180 160 Precipitation (mm) 140 120 100 80 60 40 20 0 1985 1990 1995 2000 2005 2010 90% 80% 70% 60% 50% 40% 30% 20% 10% 0% 30 80 130 180 230 Precipitation (mm) Max yearly Precipitation (mm) Gumbel 280

EL NIÑO SOUTHERN OSCILLATION ENSO For Tempisque Basin Warm Cold

Dec Jan Nov Feb Oct Mar Sep Apr Aug May Jul Jun

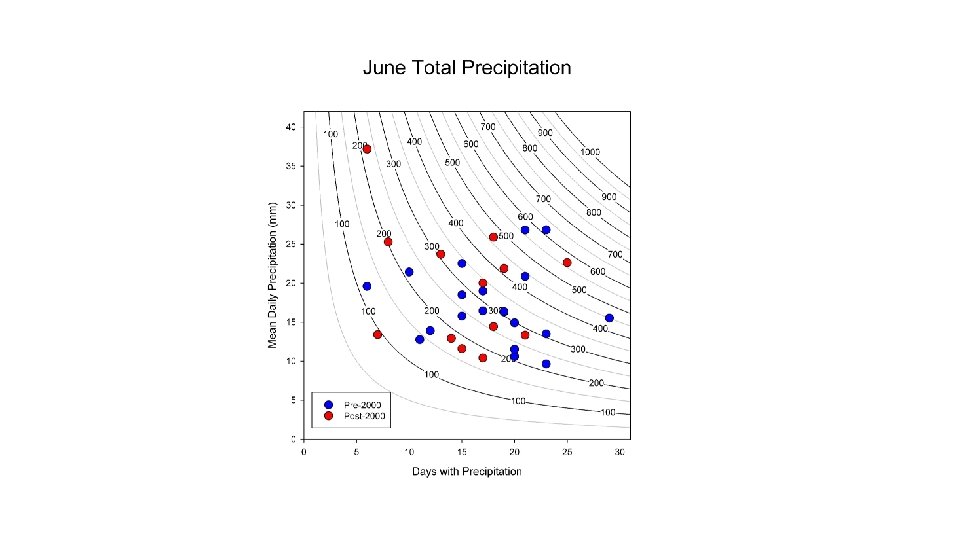
June

August

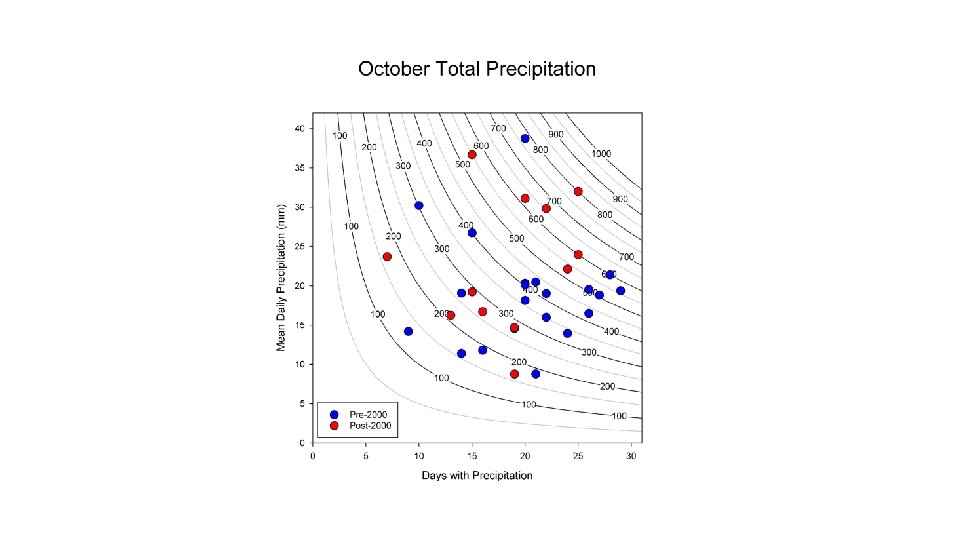
October

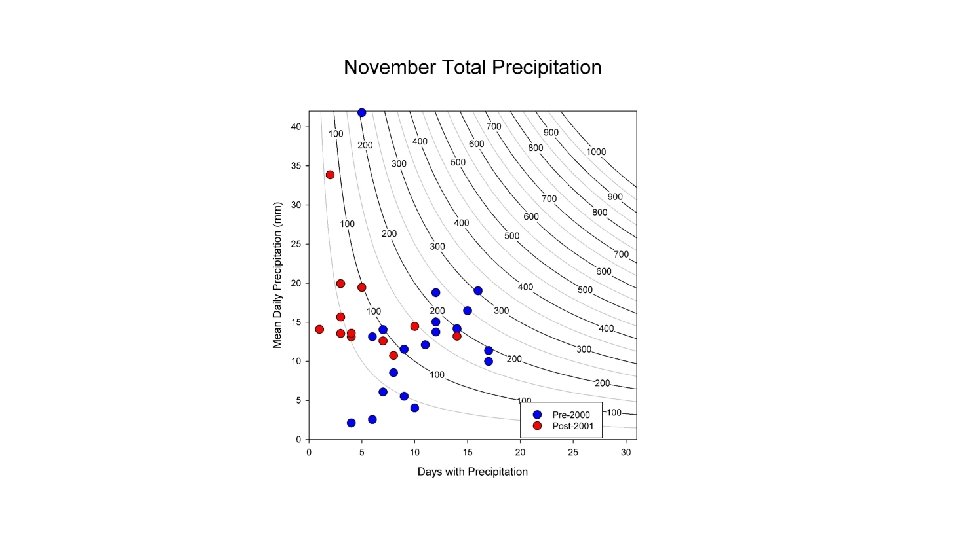
November
")
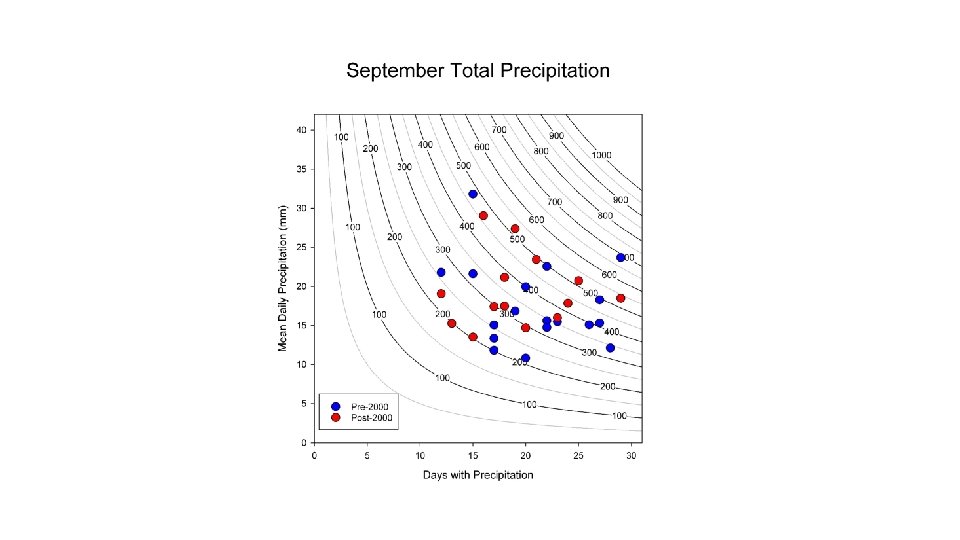
Daily Precipitation Total (mm)
 Weaker trade winds Stronger Trade winds For Tempisque Basin")
ATLANTIC MULTIDECADAL OSCILLATION (AMO) Weaker trade winds Stronger Trade winds For Tempisque Basin
 Dec Daily probability Jan Nov Dec Feb Nov Oct Mar")
Mean daily precipitation (mm) Dec Daily probability Jan Nov Dec Feb Nov Oct Mar Sep Apr Aug May Jul Jun Jan Feb Oct Mar Sep Apr Aug May Jul Jun
")
Daily Precipitation Total (mm)

COMBINATION OF DRIVERS: ENSO AND AMO ENSO + ENSO AMO + ++ + AMO + (warm) (cold)

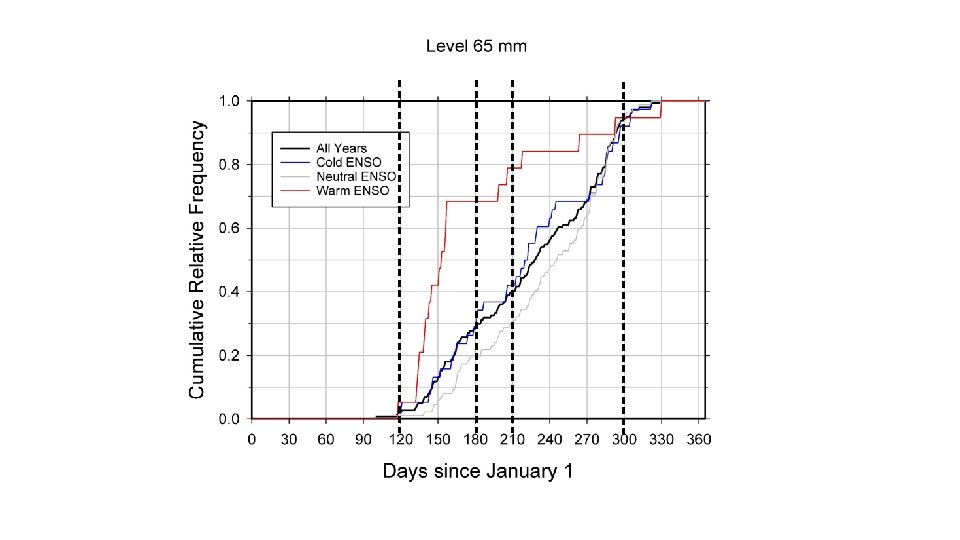
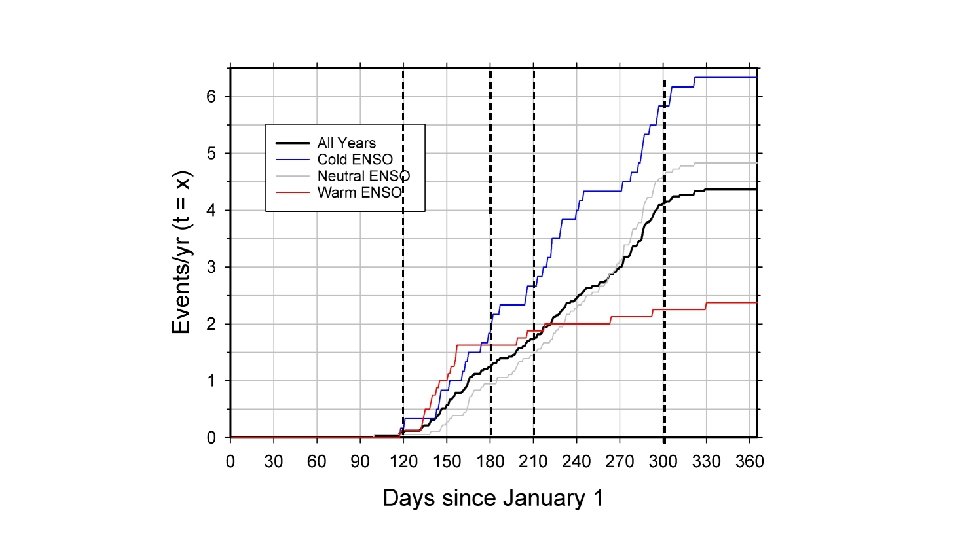
Triangles: Pre-2000 Circles: Post-2000 Blue = Cold ENSO Grey = Neutral ENSO Red = Warm ENSO

Triangles: Pre-2000 Circles: Post-2000 Blue = Cold ENSO Grey = Neutral ENSO Red = Warm ENSO

Triangles: Pre-2000 Circles: Post-2000 Blue = Cold ENSO Grey = Neutral ENSO Red = Warm ENSO

Triangles: Pre-2000 Circles: Post-2000 Blue = Cold ENSO Grey = Neutral ENSO Red = Warm ENSO
")
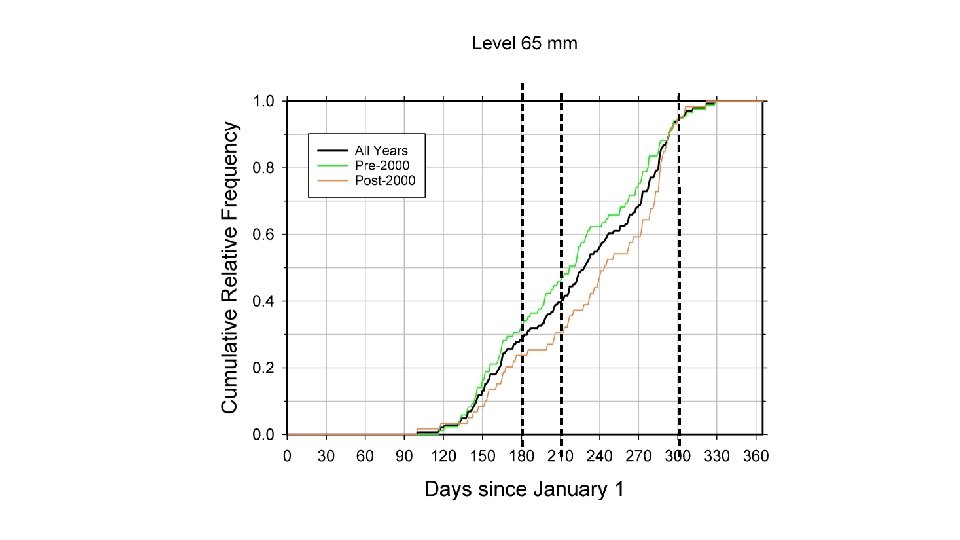
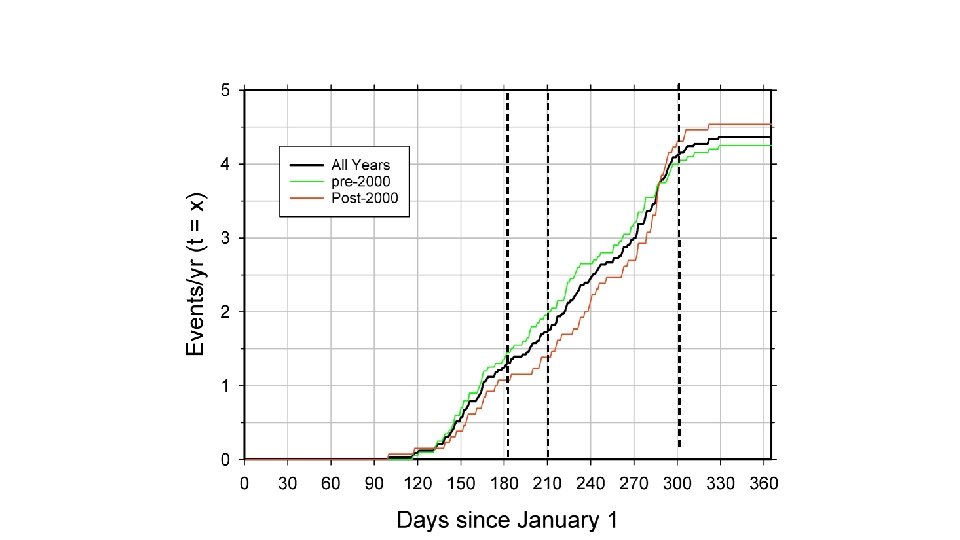
Peak over Treshold (POT)
- Slides: 36