Identifying Driver Risk Thinking Differently Peter Begley Managing

Identifying Driver Risk… Thinking Differently Peter Begley Managing Partner Driving Performance 360

Economics degree from Harvard. 20 years experience in technology and innovation. Veteran in founding 5 startup ventures. Last 6 years spent in driver safety applying sophisticated analytics to identify risk in commercial fleets.

Engage You, Challenge You, Hopefully Educate You and, Most Importantly Encourage You to Think Differently

What It Means To Really Think Differently http: //www. imdb. com/video/imdb/vi 3229326 361/

Every 12 minutes someone dies in a motor vehicle crash. Every 10 seconds an injury occurs. Every 5 seconds a crash occurs. Majority of these incidents occur during workday or during the commute to and from work. Source: Occupational Safety and Health Administration

The average crash costs an employer $16, 500. Crash with an injury $74, 000. Costs can exceed $500, 000 when a fatality is involved. Source: Occupational Safety and Health Administration

43% 45% Source: Occupational Safety and Health Administration

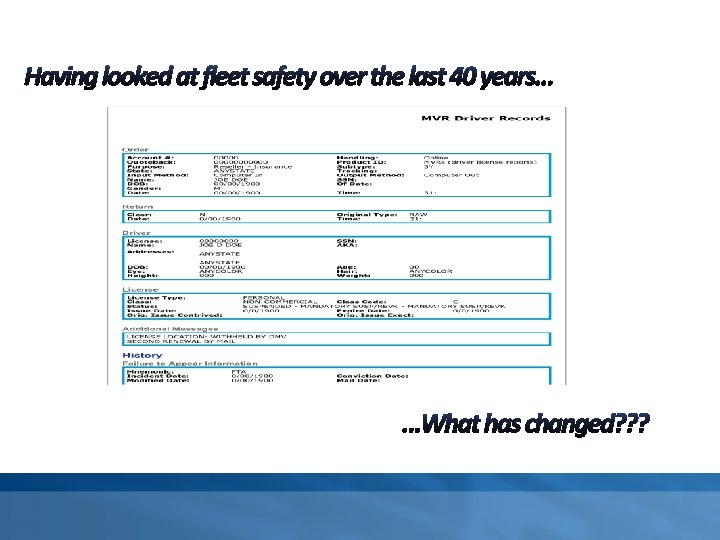
1980’s 1970’s DOT begins collecting and acting on trucking data. MVR’s are the standard for policing commercial drivers.

1990’s 1980’s Large trucking & passenger fleets take center stage with passage of the Commercial Motor Vehicle Safety Act CDL licenses required

2010’s 2000’s Expanded regulations on corporate fleets, ASSE/ANSI Z 15. 1 OSHA’s stance on cell phone use while driving

2020 2010 Technology will drive safety Data will be crucial Regulations will replace standards

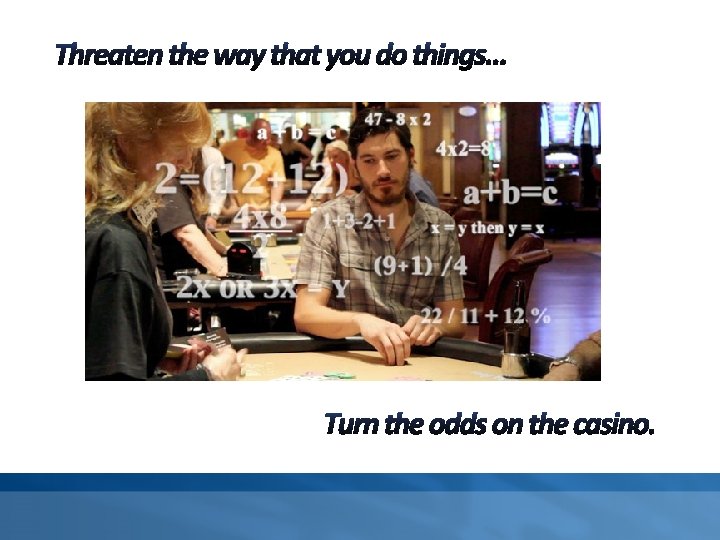
Challenging A System That Has Been Working For Years

2005 study to identify the specific truck driver behaviors most predictive of future crash involvement. Ranked top 10 events by % increase of future crash. 2011 update report showed a number of the most predictive behaviors had changed resulting in a new top 10 list.

2005 Top 10 2011 Top 10 If a driver had: Increase in Crash Likelihood A Reckless Driving violation 325% An Improper Turn violation 105% An Improper or Erratic Lane Change 100% conviction If a driver had: Increase in Crash Likelihood A Failure to Use / Improper Signal conviction 96% A Past Crash 88% An Improper Passing violation 88% 84% A Failure to Yield Right of Way conviction 97% An Improper Turn conviction 94% An Improper or Erratic Lane Change 80% conviction A Failure to Maintain Proper Lane conviction 91% An Improper Lane / Location conviction 68% A Past Crash 87% A Failure to Obey Traffic Sign conviction 68% A Speeding More Than 15 Miles over Speed Limit conviction 67% Any conviction 65% An Improper Lane Change violation 78% A Failure to Yield Right of Way violation 70% A Driving Too Fast for Conditions conviction 62% A Reckless / Careless / Inattentive / 64% Negligent Driving conviction

Top Tier Bottom Tier Restaurant 30% Racetrack or amusement park 11% Grocery store 26% Hotel, motel, resort or spa 5% Elementary or secondary school 26% National park or forest 4% Bank 25% Local or community park 3% Car dealer 23% Airport 2% Gas station 22% Doctor's office or clinic 1% Liquor store 18% Religious institution -10

"It's hard to make predictions, especially when they are about the future. " Credited to multiple sources

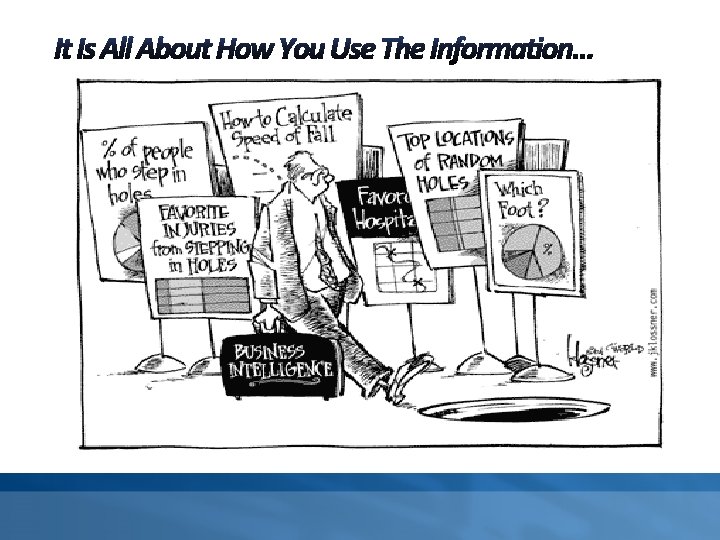
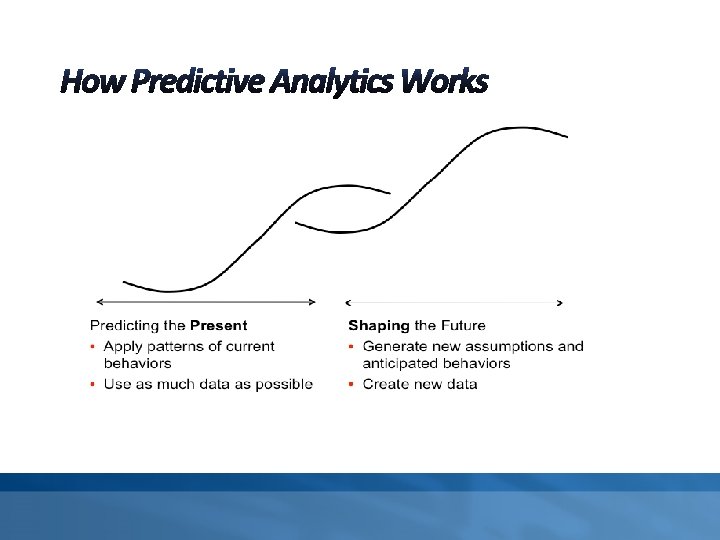
The ability to predict likely future results and scenarios from historical data A variety of techniques from statistics, data mining and game theory that analyze current and historical facts. Information that tells you who as well as what.

Driver assessments tied to MVR runs which result in a judgment call. Studies that conclude that the safest drivers live near a church. A correlation of data that narrows down a collective group.

Law Enforcement Insurance Education Health Care Credit Cards Driver Risk Marketing

A Final Consideration Although predictive analytics are based on sophisticated technologies and mathematical techniques, their success lies in applying them with common sense.

Thank You and Please Challenge The Status Quo!
- Slides: 26