Identify a Point of Continuity Determine whether is


 is")
 = x 2 + 2 x – 3")

. The pattern")
 decreases without bound as x")

. The")
 is undefined, f")

 is positive and f (0) is negative, by the")
")
 is negative and f (– 1) is positive, by")
 = x 3 – x")
, it appears")

 = x 3 + x 2 – 2")

,")


- Slides: 27
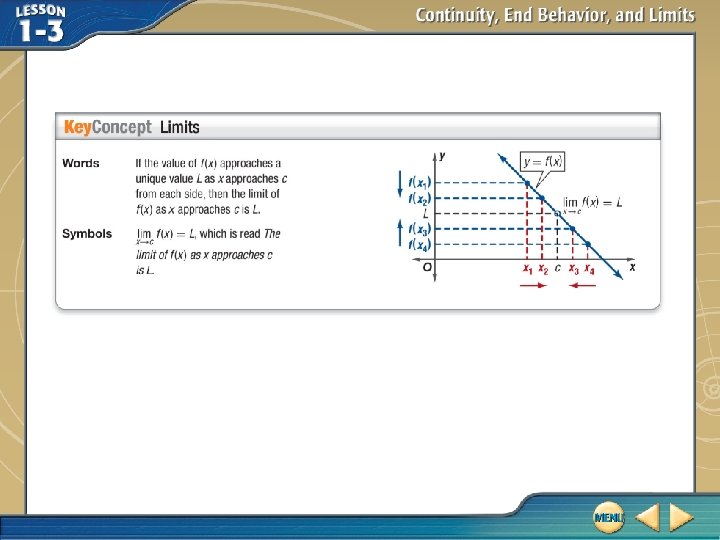
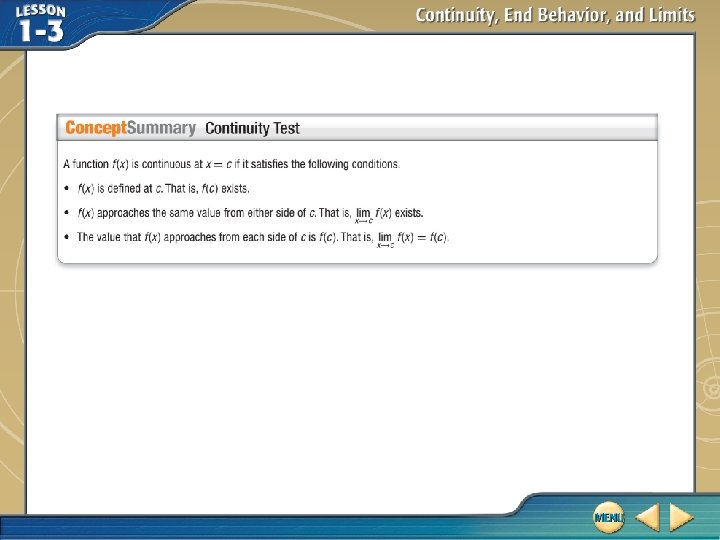
Identify a Point of Continuity Determine whether is continuous at . Justify using the continuity test. Check the three conditions in the continuity test. 1. Does Because exist? , the function is defined at
Identify a Point of Continuity 2. Does exist? Construct a table that shows values of f(x) approaching from the left and from the right. The pattern of outputs suggests that as the value of x gets close to from the left and from the right, f(x) gets closer to. . So we estimate that
Identify a Point of Continuity 3. Does Because ? is estimated to be we conclude that f (x) is continuous at and. The graph of f (x) below supports this conclusion.
Identify a Point of Continuity Answer: 1. 2. 3. exists. . f (x) is continuous at .
Determine whether the function f (x) = x 2 + 2 x – 3 is continuous at x = 1. Justify using the continuity test. A. continuous; f (1) B. Discontinuous; the function is undefined at x = 1 because does not exist.
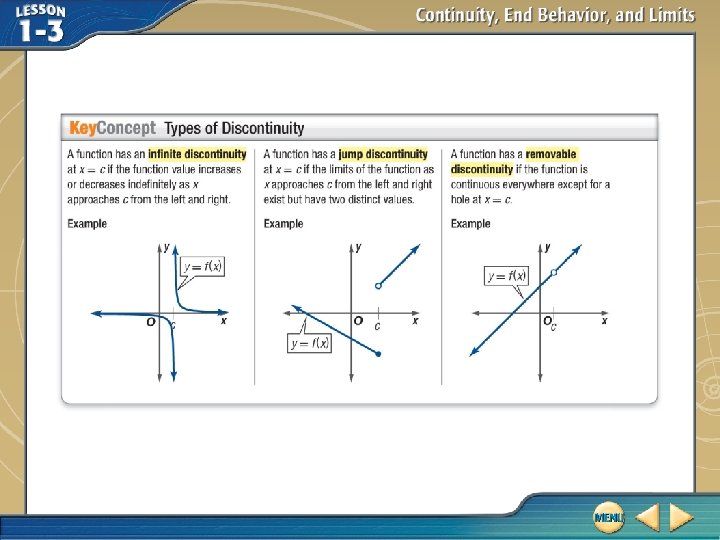
Identify a Point of Discontinuity A. Determine whether the function is continuous at x = 1. Justify using the continuity test. If discontinuous, identify the type of discontinuity as infinite, jump, or removable. 1. Because is undefined, f (1) does not exist.
Identify a Point of Discontinuity 2. Investigate function values close to f(1). The pattern of outputs suggests that for values of x approaching 1 from the left, f (x) becomes increasingly more negative. For values of x approaching 1 from the right, f (x) becomes increasing more positive. Therefore, does not exist.
Identify a Point of Discontinuity 3. Because f (x) decreases without bound as x approaches 1 from the left and f (x) increases without bound as x approaches 1 from the right, f (x) has an infinite discontinuity at x = 1. The graph of f (x) supports this conclusion. Answer: f (x) has an infinite discontinuity at x = 1.
Identify a Point of Discontinuity B. Determine whether the function is continuous at x = 2. Justify using the continuity test. If discontinuous, identify the type of discontinuity as infinite, jump, or removable. 1. Because is undefined, f (2) does not exist. Therefore f (x) is discontinuous at x = 2.
Identify a Point of Discontinuity 2. Investigate function values close to f (2). The pattern of outputs suggests that f (x) approaches 0. 25 as x approaches 2 from each side, so .
Identify a Point of Discontinuity 3. Because exists, but f (2) is undefined, f (x) has a removable discontinuity at x = 2. The graph of f (x) supports this conclusion. 4 Answer: f (x) is discontinuous at x = 2 with a removable discontinuity.
Approximate Zeros A. Determine between which consecutive integers the real zeros of are located on the interval [– 2, 2]. Investigate function values on the interval [-2, 2].
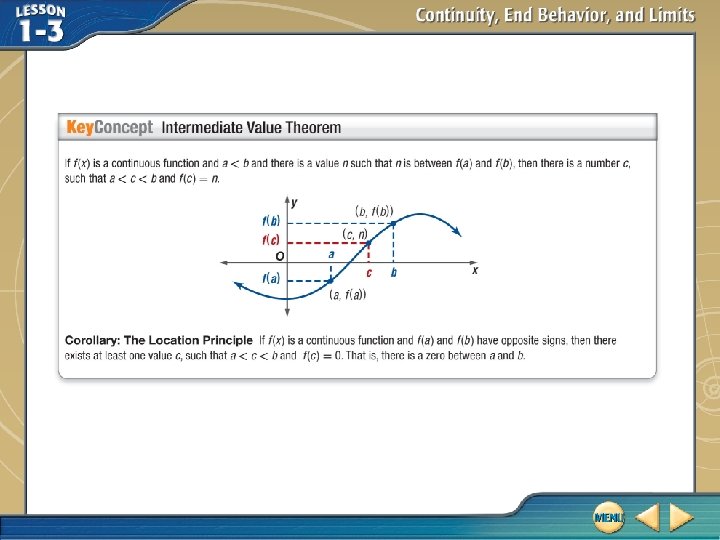
Approximate Zeros Because f (-1) is positive and f (0) is negative, by the Location Principle, f (x) has a zero between -1 and 0. The value of f (x) also changes sign for [1, 2]. This indicates the existence of real zeros in each of these intervals. The graph of f (x) supports this conclusion. Answer: There are two zeros on the interval, – 1 < x < 0 and 1 < x < 2.
Approximate Zeros B. Determine between which consecutive integers the real zeros of f (x) = x 3 + 2 x + 5 are located on the interval [– 2, 2]. Investigate function values on the interval [– 2, 2].
Approximate Zeros Because f (-2) is negative and f (– 1) is positive, by the Location Principle, f (x) has a zero between – 2 and – 1. This indicates the existence of a real zero on this interval. The graph of f (x) supports this conclusion. – 3 Answer: – 2 < x < – 1. 1 1 3
Graphs that Approach Infinity Use the graph of f(x) = x 3 – x 2 – 4 x + 4 to describe its end behavior. Support the conjecture numerically.
Graphs that Approach Infinity Analyze Graphically In the graph of f (x), it appears that and Support Numerically Construct a table of values to investigate function values as |x| increases. That is, investigate the value of f (x) as the value of x becomes greater and greater or more and more negative.
Graphs that Approach Infinity The pattern of outputs suggests that as x approaches –∞, f (x) approaches –∞ and as x approaches ∞, f (x) approaches ∞. Answer:
Use the graph of f (x) = x 3 + x 2 – 2 x + 1 to describe its end behavior. Support the conjecture numerically. A. B. C. D.
Graphs that Approach a Specific Value Use the graph of to describe its end behavior. Support the conjecture numerically.
Graphs that Approach a Specific Value Analyze Graphically In the graph of f (x), it appears that. Support Numerically As. As supports our conjecture. . This
Graphs that Approach a Specific Value Answer:
Use the graph of to describe its end behavior. Support the conjecture numerically. A. B. C. D.