Identified High p T particle Correlations Ying Guo


 172302 Phys. Rev. Lett. 90 (2003) 082302 nucl-ex/0407007")

 reshaped by flow")

 correlations Au. Au and pp 0 -5% 30 -50% 5")
")
 Cosine fit Gaussian fit 1. 5<p. T, trigger<3. 0, 1. 5<p. T,")
 Cosine fit Gaussian fit 1. 5<p. T, trigger<3. 0, 1.")
 Gaussian fit 1. 5<p. T, trigger<3. 0, 1. 5<p. T, asso<3. 0")


")


- Slides: 32
Identified “High” p. T particle Correlations Ying Guo Wayne State University For STAR Collaboration Hot Quark 2004
Outline n Introduction n Data analysis n Preliminary results n Discussion
Motivation: Ø Ø Ø partonic energy loss Get a better understanding of the high p. T azimuthal correlations Particle identified jet correlation study provides us additional information about the jet quenching and particle production mechanisms. The strange particle identified jet correlation can be used as a probe to study the flavor dependence of the strong interaction and the fragmentation process.
Phys. Rev. Lett. 91 (2003) 172302 Phys. Rev. Lett. 90 (2003) 082302 nucl-ex/0407007 Medium Quench effect of the High p. T particles Potential improvement of the original measurements Øbackground subtraction method Øvariable away side range (Δφ)
Jet profile Reconstruction down to low p. T: 4. 0 Gev/c<p. T, trigger <6. 0 Gev/c, 0. 15 Gev/c<p. T, associate <5. 0 Gev/c syst. error Away Fuqiang’s QM 2004 talk.
Sample of correlation Function: Uncorrelated background • Jet Fragmentation (near side) reshaped by flow multiplicity Phys. Rev. Lett. 90 (2003) 032301 • Jet quenching (away side) Same side • Momentum conservation (away side) • Other particle production mechanism Away side Coalescence, recombination
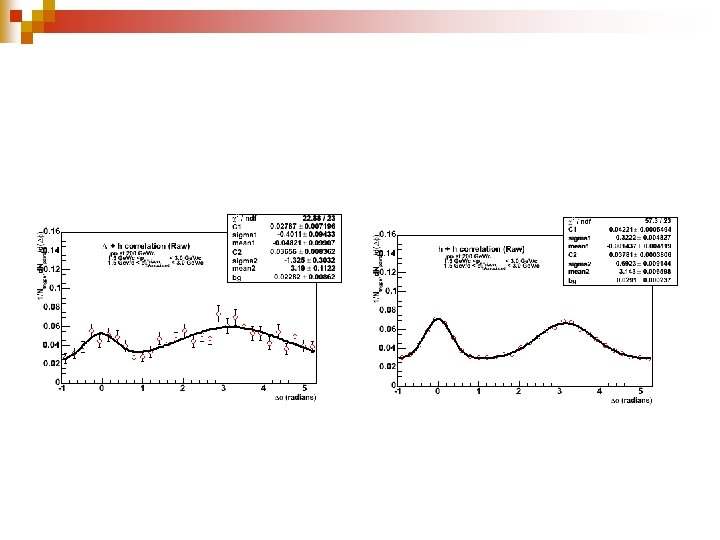
Data Analysis Methods: Same Side Background pp: q. Nicolas Borghini et al. Phys. Rev. C 62, 034902(2000). Au + Au: Gaussian Fit of back side: Cosine Fit of back side (momentum balance): Parameters are compared for different fits for two different p. T cuts as the function of centralities
Λ +h (charged hadrons) correlations Au. Au and pp 0 -5% 30 -50% 5 -10% 50 -70% 10 -30%
Λ +h correlations Au. Au (cosine fit)
Width (Λ+h) Cosine fit Gaussian fit 1. 5<p. T, trigger<3. 0, 1. 5<p. T, asso<3. 0 2. 5<p. T, trigger<4. 0, 1. 7<p. T, asso<2. 5
Associated particle yields (Λ+h) Cosine fit Gaussian fit 1. 5<p. T, trigger<3. 0, 1. 5<p. T, asso<3. 0 2. 5<p. T, trigger<4. 0, 1. 7<p. T, asso<2. 5
AA/pp (Λ+h) Gaussian fit 1. 5<p. T, trigger<3. 0, 1. 5<p. T, asso<3. 0 2. 5<p. T, trigger<4. 0, 1. 7<p. T, asso<2. 5 No pp reference Large AA/pp ratio for the same side ØTrigger Bias? Cosine fit X N Wang, nucl-th/0405017
same and away side yields of different particle species
Same side width of different particle species Anti Lambda K 0 short
PHENIX measurement from QM 2004 SAME SIDE
PHENIX measurement from QM 2004 AWAY SIDE
1. 5 Ge. V/c < p. T, trig, p. T, asso<3. 0 Ge. V/c
Summary: n n We can measure identified particle correlations For central collisions, large width(>π/2~1. 6) of the back side indicates a momentum balance shape and collapse of the Jet structure. ☺ Same Measurement side AA/pp ratioofappears be largeus in the N couldtoprovide intermediate p. T range information about how the jet get quenched inside the medium, what is the scare of Trigger particleinteracted species dependence: particles with the quenched jet. ¨ comparable to PHENIX measurements ¨ No significant particle species dependency ¨ No strong centrality dependency, need further study on the systematic
Backup
Hh AA/pp ratio for G fit
Momentum Balance measurement comparing to balancing over the large amount of particles by assuming α ~ 1. 0
Back side correlations between charged hadrons: 5. 4 < p. T trigger < 6. 5 Ge. V/c 2. 5 < p. T associated < 3. 7 Ge. V/c 1/Ntrigger d. N/d(∆Φ) 3. 7 < p. T trigger < 4. 5 Ge. V/c Fig. 12 Same side and back side as function of Trigger PT ∆Φ (radians) same side is calculated by integrating the Gaussian component and the back side is calculated by integrated the cosine component. Notices that there is a clear back side signal for higher p. T, trigger values 6. 5 < PT trigger <10 Ge. V/c 2. 5 < P T associated <3. 7 Ge. V/c 2. 5 < p. T associated < 3. 7 Ge. V/c 1/Ntrigger d. N/d(∆Φ) 4. 5 < p. T trigger < 5. 4 Ge. V/c Trigger PT ∆Φ (radians) Fig. 11 Charged Hadrons correlations for different trigger PT range ∆Φ (radians) Fitting Function: Fig. 13 Trigger PT In Fig. 13 the Ccos fit values are compared to an estimate of the momentum conservation effect [6].
Hence α can be measured by studying the statistical p. T fluctuations of the back side jet cone compared to inclusive background
Uncorrelated backgrounds Seems works pretty well!!
L+h cos fit 1
L+h vs. Anti-L+h (most central)
L+h cut 2
al+h cos fit
K 0 short +h fit
h+h AA
Hh fit