Identification of breast cancer subtypes using RNASeq data

Identification of breast cancer subtypes using RNA-Seq data Dvir Netanely Ron Shamir’s Group April 2013

Goal • Improve the classification of cancer samples into therapeutically-relevant sub-types by utilizing the flood of new high throughput data sources (“omics data”). • Multi-omics integrative approach • Identify biomarkers that are specific to certain sub-types, outcomes.

Where to start ? • Which cancer type? – Starting with breast cancer, as it is common and heterogeneous. • Which data platform? – Starting with RNA-Seq. • Which database? – TCGA (The Cancer Genome Atlas) which stores hundreds of sample measured by various platforms. • What kind of analysis? – Unsupervised • • Classify tumor samples into sub-types Identify gene clusters enriched with a biologically meaningful theme. – Supervised • • Find differentially expressed genes (Next group meeting…) Which sub-types are to be used for DE analysis of genes and for sample classification? – Clinical data: • • Normal vs. Tumor AJCC Stage Correlation to pivotal mutations (ER, PR, Outcome (survival, recurrence) – PAM 50 sub-types • • A breast cancer sub type classifier based on gene expression levels of 50 genes. Which tools? – – New statistic methods (RNA-Seq data is better modeled by the negative-binomial distribution) Requires processing and visualization of large datasets (1, 000 x 20, 000)

Challenges in analyzing multi-omics data • Overwhelming amounts of data – Each platform is a whole new world with its own analysis methods, workflow, valid statistical tests. – Data is large in size; Difficult to download, store, analyze with existing tools – Clinical data is scattered, not uniform for all platforms and samples, hard to interpret and build an integrated uniform dataset.
")
Breast Cancer • Common (1, 300, 000 cases, 450, 000 deaths each year worldwide) • Heterogeneous with respect to – Molecular alterations – Cellular composition – Clinical outcome • Clinically categorized into three basic therapeutic groups: – ER+ • The oestrogen receptor (ER) positive group is the most numerous and diverse, with several genomic tests to assist in predicting outcomes for ER+ patients receiving endocrine therapy. – HER 2 • The HER 2 amplified group is a great clinical success because of effective therapeutic targeting of HER 2 • Led to intense efforts to characterize other DNA copy number aberrations. – Basal-like (Triple-negative) • Cancers lacking expression of ER, progesterone receptor (PR) and HER 2, can be treated with chemotherapy only.

Breast cancer sub-type classification based on gene expression • In 2000, Botstein et al. identified 4 classes of breast cancers based on gene expression analysis. • 65 samples, 496 genes were used for clustering (out of 8102 genes on chip). • Identified 4 molecular sub-types: – – ER+/luminal-like Basal-like Erb-B 2+ Normal-like Molecular portraits of human breast tumours David Botstein et al. , Nature 406, 747 -752 (17 August 2000)

Two large branches were apparent in the dendrogram, and within these large branches were smaller branches for which common biological themes could be inferred. Branches are coloured accordingly: basal-like, orange; Erb-B 2 +, pink; normal-breast-like, light green; and luminal epithelial/ER+, dark blue. a, Experimental sample associated cluster dendrogram. Small black bars beneath the dendrogram identify the 17 pairs that were matched by this hierarchical clustering; larger green bars identify the positions of the three pairs that were not matched by the clustering. b, Scaled-down representation of the intrinsic cluster diagram (see Supplementary Information Fig. 6). c, Luminal epithelial/ER gene cluster. d, Erb-B 2 overexpression cluster. e, Basal epithelial cell associated cluster containing keratins 5 and 17. f, A second basal epithelial-cell-enriched gene cluster.

Breast cancer sub-type classification based on gene expression Molecular portraits of human breast tumours Nature 406, 747 -752 (17 August 2000) • “The number of clearly different molecular phenotypes observed among the breast tumours suggests that we are far from having a complete picture of the diversity of breast tumours. • When hundreds (instead of tens) of breast tumours have been characterized, a more defined tumour classification is likely, and statistically significant relationships with clinical parameters should be uncovered. • We were, however, able to identify four groups of samples that might be related to different molecular features of mammary epithelial biology (that is, ER+/luminal-like, basal-like, Erb-B 2+ and normal breast)”.

Breast cancer sub-type classification based on gene expression “Gene expression patterns of breast carcinomas distinguish tumor subclasses with clinical implications”, Botstein et al. 2001 • 85 c. DNA microarrays, newer chip. • Samples were clustered using the 476 genes used in the previous study. • Identified five robust sub-types: – – – • • Luminal A Luminal B HER 2 -enriched Basal-like Normal-like Previously characterized luminal epithelial/estrogen receptor-positive group could be divided into at least two subgroups, each with a distinctive expression profile. Survival analyses on a subcohort of patients showed significantly different outcomes for the patients belonging to the various groups.

PAM 50 Classifier • In 2009, Parker et al. derived a set of 50 genes that robustly classify the five above subtypes of breast cancer. • Analysis based on 189 tumors, 29 normal. • The PAM 50 gene set has high agreement in classification with larger “intrinsic” gene sets previously used for subtyping, and is now commonly employed. Supervised Risk Predictor of Breast Cancer Based on Intrinsic Subtypes, Parker at al. 2009

RNA-Seq • RNA-Seq is a recently developed approach to transcriptome profiling that uses deepsequencing technologies. • Like microarrays it can provide m. RNA abundance quantification and considered to be… – More precise – Less noisy – Higher dynamic range – Also provides the RNA sequence itself

Advantages of RNA-Seq compared with other transcriptomics methods Technology Tiling microarray c. DNA or EST sequencing RNA-seq Principle Hybridization Sanger sequencing High-throughput sequencing Resolution From several to 100 bp Single base Throughput Reliance on genomic sequence Background noise Application Simultaneously map transcribed regions and gene expression Dynamic range to quantify gene expression level Ability to distinguish different isoforms Ability to distinguish allelic expression Practical issues High Low High Yes No In some cases High Low Yes Limited for gene expression Yes Up to a few-hundredfold Not practical >8, 000 -fold Limited Yes Yes Required amount of RNA High Low cost for mapping transcriptomes of large genomes High Relatively low Technology specifications

TCGA Project

TCGA Project Current breast cancer sample counts:

TCGA’s Data Matrix

Comprehensive molecular portraits of human breast tumours The Cancer Genome Atlas Network Nature Volume: 490, Pages: 61– 70 October 2012 Identification of Breast Cancer sub-types based on data coming from five different technologies (not including RNA-Seq)

Intro • Most molecular studies of breast cancer have focused on just one or two high information content platforms, most frequently m. RNA expression profiling or DNA copy number analysis, and more recently massively parallel sequencing. • Supervised clustering of m. RNA expression data has established that breast cancers encompass several distinct disease entities, often referred to as the intrinsic subtypes of breast cancer. • The recent development of additional high information content assays provide further opportunities to characterize more completely the molecular architecture of breast cancer. • In this study, a diverse set of primary breast tumours were assayed using six different technology platforms. • Individual platform and integrated pathway analyses identified many subtype-specific mutations and copy number changes that identify therapeutically tractable genomic aberrations and other events driving tumour biology.

Technologies used • m. RNA microarrays – Measures m. RNA levels for thousands of genes based on probe hybridization • DNA methylation arrays – Detects methylation levels • Genomic DNA copy number arrays – Identifies amplifications and deletions on the DNA level • Exome sequencing – Identifies genetic variance in the form of somatic mutations within the coding regions of the genome (1% of the genome). • micro. RNA sequencing – Measures mi. RNA levels using deep sequencing • Reverse-phase protein arrays – Measures protein abundance using antibodies

Analyzed Data • 825 patients • 466 samples had data available on five platforms – Agilent m. RNA expression microarrays (n = 547) – Illumina Infinium DNA methylation chips (n = 802) – Affymetrix 6. 0 single nucleotide polymorphism (SNP) arrays (n = 773) – mi. RNA sequencing (n = 697) – Whole-exome sequencing (n = 507); • in addition, 348 of the 466 samples had reversephase protein array (RPPA) data (n = 403).

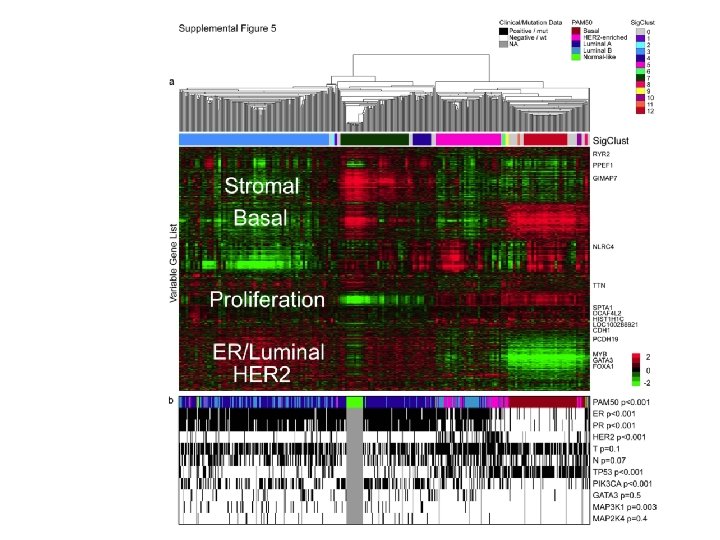
m. RNA microarrays analysis Unsupervised hierarchical clustering analysis of 525 tumours and 22 tumour-adjacent normal tissues using the top 3, 662 variably expressed genes. >High correlation to PAM 50 subtypes and to clinical data.

Significantly mutated genes in breast cancer • 510 tumours from 507 patients were subjected to whole-exome sequencing, identifying 30, 626 somatic mutations. • Comparison to COSMIC and OMIM databases identified 619 mutations across 177 previously reported cancer genes. • a number of novel significantly mutated genes were identified

P 53 mutation spectrum according to m. RNA based sub-types

GATA 3 mutation spectrum according to m. RNA based sub-types

Significantly mutated genes and correlations with genomic and clinical features. Tumour samples are grouped by m. RNA subtype: luminal A (n = 225), luminal B (n = 126), HER 2 E (n = 57) and basal-like (n = 93). The left panel shows non-silent somatic mutation patterns and frequencies for significantly mutated genes. The middle panel shows clinical features: dark grey, positive or T 2– 4; white, negative or T 1; light grey, N/A or equivocal. N, node status; T, tumour size. The right panel shows significantly mutated genes with frequent copy number amplifications (red) or deletions (blue). The far-right panel shows nonsilent mutation rate per tumour (mutations per megabase, adjusted for coverage). The average mutation rate for each expression subtype is indicated. Hypermutated: mutation rates >3 s. d. above the mean (>4. 688, indicated by grey line). DC Koboldt et al. Nature (2012)
, 697")
mi. RNA based sample clustering Using top 25% variable mi. RNA genes (n=306), 697 tumor samples were clustered into 7 clusters. Clusters exhibit significant correlation to PAM 50 subtypes, Clinical features and some of the somatic mutations.

DNA Methylation arrays Group 3 showed a hypermethylated phenotype and was significantly enriched for luminal B m. RNA subtype and under -represented for PIK 3 CA, MAP 3 K 1 and MAP 2 K 4 mutations. Group 5 showed the lowest levels of DNA methylation, overlapped with the basal-like m. RNA subtype, and showed a high frequency of TP 53 mutations.

Coordinated analysis of breast cancer subtypes defined from five different genomic/proteomic platforms. a, Consensus clustering analysis of the subtypes identifies four major groups (samples, n = 348). The blue and white heat map displays sample consensus. b, Heat-map display of the subtypes defined independently by mi. RNAs, DNA methylation, copy number (CN), PAM 50 m. RNA expression, and RPPA expression. The red bar indicates membership of a cluster type. c, Associations with molecular and clinical features. P values were calculated using a chi-squared test. DC Koboldt et al. Nature (2012)

• Repeated the clustering exclusing the m. RNA clusters. • This ‘cluster of clusters’ (C-of-C) approach illustrated that basallike cancers had the most distinct multiplatform signature as all the different platforms for the basal-like groups clustered together.
 HER")
Highlights of genomic, clinical and proteomic features of subtypes Subtype ER+/HER 2− (%) HER 2+ (%) TNBCs (%) Luminal A 87 7 2 Luminal B 82 15 1 TP 53 pathway TP 53 mut (12%); gain of MDM 2 TP 53 mut (32%); gain of MDM 2 TP 53 mut (84%); gain of MDM 2 TP 53 mut (75%); gain of MDM 2 (14%) (31%) (14%) (30%) PIK 3 CA/PTEN pathway PIK 3 CA mut (42%); PTEN PIK 3 CA mut (49%); PTEN PIK 3 CA mut (32%) PTEN mut/loss PIK 3 CA mut (7%); PTEN mut/loss (19%); INPP 4 B loss mut/loss (13%); INPP 4 B loss (9%) (24%) INPP 4 B loss (16%) (35%); INPP 4 B loss (30%) RB 1 pathway Cyclin D 1 amp (29%); CDK 4 gain RB 1 mut/loss (20%); cyclin E 1 Cyclin D 1 amp (58%); CDK 4 gain Cyclin D 1 amp (38%); CDK 4 gain (14%); low expression of amp (9%); high expression of (25%) (24%) CDKN 2 C; high expression of RB 1 CDKN 2 A; low expression of RB 1 m. RNA expression High ER cluster; low proliferation Copy number Most aneuploid; many with focal Most diploid; many with quiet Most aneuploid; high genomic amp; 1 q, 8 p 11 gain; 8 p, 16 q genomes; 1 q, 8 p 11 gain; 8 p, instability; 1 q, 10 p gain; 8 p, 5 q loss; 11 q 13. 3 amp (51%); 16 q loss; 11 q 13. 3 amp (24%) loss; MYC focal gain (40%) 8 p 11. 23 amp (28%) Most aneuploid; high genomic instability; 1 q, 8 q gain; 8 p loss; 17 q 12 focal ERRB 2 amp (71%) DNA mutations PIK 3 CA (49%); TP 53 (12%); GATA 3 (14%); MAP 3 K 1 (14%) TP 53 (32%); PIK 3 CA (32%); MAP 3 K 1 (5%) TP 53 (75%); PIK 3 CA (42%); PIK 3 R 1 (8%) DNA methylation – Hypermethylated phenotype for Hypomethylated subset Protein expression High oestrogen signalling; high MYB; RPPA reactive subtypes Less oestrogen signalling; high High expression of DNA repair High protein and phospho. FOXM 1 and MYC; RPPA reactive proteins, PTEN and INPP 4 B loss protein expression of EGFR and subtypes signature (p. AKT) HER 2 Lower ER cluster; high proliferation Basal-like 10 2 80 Basal signature; high proliferation TP 53 (84%); PIK 3 CA (7%) HER 2 E 20 68 9 HER 2 amplicon signature; high proliferation –

Identification of breast cancer subtypes using RNA-Seq data • RNA-Seq + Clinical data for 956 samples was downloaded from TCGA web site – 107 Normals, 849 Tumors – 20531 genes • RNA-Seq Level 3 files of normalized RSEM gene level counts, were merged to one file. • Clinical data extracted and mapped to sample by Id.

gene_id gene_name >SERIES Sample Type >SERIES Center SYMBOL >SERIES Complete TCGA ID >SERIES Gender >SERIES Age at Initial Pathologic Diagnosis >SERIES ER Status >SERIES PR Status >SERIES HER 2 Final Status >SERIES Tumor--T 1 Coded >SERIES Node-Coded >SERIES Metastasis-Coded >SERIES AJCC Stage >SERIES Converted Stage >SERIES Survival Data Form SYMBOL SYMBOL SYMBOL SYMBOL >SERIES Vital Status >SERIES Days to Date of Last Contact >SERIES Days to date of Death >SERIES OS event >SERIES OS Time >SERIES PAM 50 m. RNA >SERIES Sig. Clust Unsupervised m. RNA >SERIES Sig. Clust Intrinsic m. RNA >SERIES mi. RNA Clusters >SERIES methylation Clusters >SERIES RPPA Clusters >SERIES CN Clusters >SERIES Integrated Clusters (with PAM 50) >SERIES Integrated Clusters (no exp) >SERIES Integrated Clusters (unsup exp) SYMBOL SYMBOL SYMBOL SYMBOL 1 A 1 BG 2 A 2 M 9 NAT 1 10 NAT 2 12 SERPINA 3 13 AADAC 14 AAMP 15 AANAT TCGA-A 1 - TCGA-A 1 - TCGA-A 1 - TCGA-A 1 A 0 SB-01 A- A 0 SD-01 A- A 0 SE-01 A- A 0 SF-01 A- A 0 SG-01 A- A 0 SH-01 A- A 0 SI-01 A- A 0 SJ-01 A- A 0 SK-01 A- A 0 SM-01 A- A 0 SN-01 A 11 R-A 144 - 11 R-A 115 - 11 R-A 084 - 11 R-A 144 - 11 R-A 084 - 12 R-A 084 - 11 R-A 14407 07 07 Primary. Tu Primary. Tu mor mor mor A 1 A 1 A 1 TCGA-A 1 - TCGA-A 1 - TCGA-A 1 - TCGA-A 1 A 0 SB A 0 SD A 0 SE A 0 SF A 0 SG A 0 SH A 0 SI A 0 SJ A 0 SK A 0 SM A 0 SN FEMALE FEMALE FEMALE 70 59 56 54 61 39 52 39 54 77 50 Positive Positive Negative Positive Positive Positive Negative Negative Negative Positive T 1 T 2 T 2 T 2 T 3 T 2 T 1 T_Other T_Other T_Other T 1 N 0 N 0 N 1 N 0 N 1 Negative Positive Negative Positive M 0 M 0 M 0 Negative Negative Negative Stage I Stage IIA Stage IIB Stage IIA Stage IIB Stage IIIA Stage IIA Stage IIA enrollment enrollment followup enrollment DECEASE LIVING LIVING D LIVING 259 437 1320 1463 433 1437 634 426 594 242 1196 NA NA 967 NA NA 0 0 0 0 1 0 0 259 437 1320 1463 433 1437 634 426 967 242 1196 NA Luminal A NA NA Luminal A Basal-like Luminal B NA NA 37 - NA NA 7 - NA 363 - NA NA 95 - NA NA 5 - NA 3131 - NA 3 6 6 6 5 4 7 4 5 4 4 5 1 1 4 2 2 5 4 3 NA NA NA Her 2 NA Reac. I Basal NA NA 1 2 2 3 4 5 3 3 1 2 5 NA NA NA 1 NA 3 2 NA NA NA NA 1 NA 3 2 NA NA 49. 2 142. 3 192. 82 326. 02 168. 83 180. 32 128. 46 226. 78 86. 64 307. 49 87. 58 31626. 95 23793. 49 15728. 49 15583. 99 12472. 99 13997. 86 9816. 89 22113. 92 4190. 36 8960. 51 11373. 93 58. 11 1832. 44 4014. 81 8094. 69 146. 16 414. 6 987. 35 287. 52 5. 04 1191. 92 4203. 98 1. 35 8. 27 8. 56 11. 57 7. 92 3. 61 2. 65 1. 46 0 5. 68 0. 64 3034. 13 0 2198. 45 1. 8 71175. 91 0 2395. 83 0. 33 33288. 03 0. 33 2841. 3 0. 66 5855. 42 0 2950. 84 0. 43 2035. 82 0. 36 3237. 15 0 17568. 27 0 2385. 77 0 2301. 06 0. 88 2361. 98 0 71344. 86 2. 19 2548. 88 0. 37 434. 29 0 1555. 94 0 12651. 2 0 2267. 68 0. 95 105671. 3 0. 32 1723. 54 0. 32

Data Preprocessing • • • Starting with 20531 genes Flooring to 2 Log 2 Keeping only top 10% variable genes (n=2053) Standardizing the rows

PV Clust, Labels: N/T, 1: 11: 900

PV Clust, Labels: PAM 50

PV Clust, Labels: Tumor Stage

PV Clust, Labels: ER

PV Clust, Labels: PR

PV Clust, Labels: HER 2

Applying hierarchical clustering on samples 1: 3: 956 PAM 50 ER Normal Her 2 Negative PR HER 2 Normal Positive Negative Luminal. B Luminal. A Negative Positive Tumor

Applying hierarchical clustering on samples PAM 50 : 1: 3: 956 Normal Basal Luminal. A Luminal. B Her 2 PAM 50 : 2: 3: 956 Normal Basal Her 2 Luminal. A Luminal. B

Didn’t work for other labels. .

1: 1: 500 Basal Normal Luminal. A Her 2 Luminal. B Luminal. A

Expander Analysis • Data loaded in expander, preprocessed, clusters using Kmeans and went through all enrichment test. • Many extremely significant enrichments were detected. • Many of the signal discussed in the TCGA paper also detected by expander.

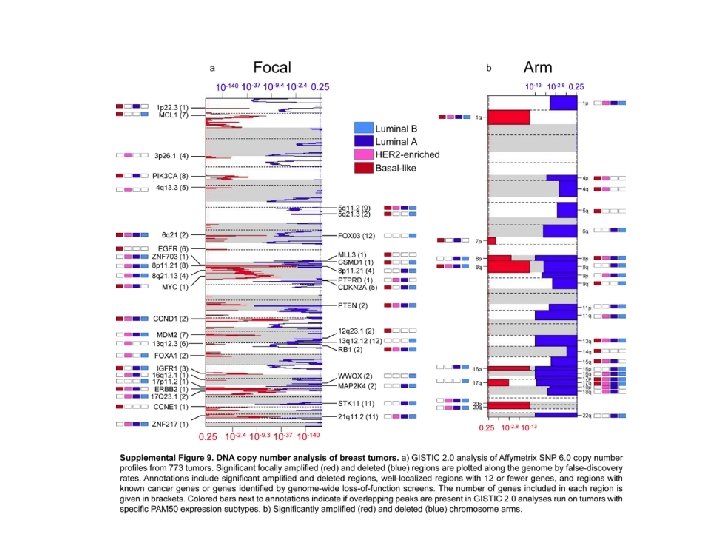
Expander Analysis – Example: Copy number changes described in the paper are found in Expander’s analysis as location enrichment within a gene cluster Cluster_19 Cluster_20 Cluster_29 Cluster_14 Cluster_29 Cluster_20 Cluster_29 Cluster_14 Cluster_28 Cluster_9 Cluster_18 Cluster_29 Cluster_28 Cluster_18 Cluster_28 Cluster_9 Cluster_26 Cluster_20 8 p 11 8 p 17 q 17 17 q 12 X 8 11 q 11 11 q 14 Xq 28 17 q 21 Xq 11 q 13 8 q X 17 q 23 Xp Xp 11 8 q 22 17 8 Xp 11 1 q 1 17 q 13 19 20 27 27 17 24 20 19 19 10 11 13 14 11 23 9 36 14 10 8 11 36 23 5 26 35 4 1. 13 E-43 4. 89 E-37 1. 84 E-34 2. 94 E-32 4. 56 E-30 2. 30 E-28 7. 58 E-27 1. 10 E-24 2. 09 E-21 5. 71 E-19 2. 74 E-16 8. 35 E-16 8. 13 E-15 6. 43 E-14 4. 21 E-13 4. 64 E-12 5. 11 E-12 7. 78 E-12 1. 01 E-11 4. 29 E-11 1. 80 E-10 9. 92 E-10 3. 53 E-09 6. 73 E-09 7. 63 E-09 1. 97 E-08 1. 28 E-07 Subtype Luminal A Luminal B Basal-like Copy number Most diploid; many with quiet genomes; 1 q, 8 p 11 gain; 8 p, 16 q loss; 11 q 13. 3 amp (24%) Most aneuploid; many Most aneuploid; high with focal amp; 1 q, genomic instability; 8 q, 8 p 11 gain; 8 p, 16 q 1 q, 10 p gain; 8 p, 5 q loss; 11 q 13. 3 amp loss; MYC focal gain (51%); 8 p 11. 23 amp (40%) (28%) HER 2 E Most aneuploid; high genomic instability; 1 q, 8 q gain; 8 p loss; 17 q 12 focal ERRB 2 amp (71%)

KEGG - Ribosome

KEGG - Ribosome

GO

Location

TFs
")
Summary • Clustering subsets of 956 samples based on RNA-Seq data (normalized by RSEM) exhibited a partitioning structure that is in concordance with previously described platforms. – Sample clustering into sub types can be probably improved by choosing the genes more carefully. – The described study by TCGA, demonstrates the need for real automatic methods for integrative analysis of the various omics technologies now available. • Initial unsupervised analysis conducted in Expander revealed many cancer related themes. • Clusters of both sample and genes can be further examined to produce biological insights.
- Slides: 52