Ideal and Dilute Solutions Master Thermodynamics Equations Chemical


 Mixture Chem. Potential applied to other")

 @ constant")
 Pi (escaping tendency g) Gas Ideality")


 Solution See Mathcad plot")

 In dilution solutions, each solute is surrounded")


 Derivation starting with equilibrium thermodynamics, At equilibrium (constant")
 Kf = molal freezing point constant,")


- Slides: 28
Ideal and Dilute Solutions
Master Thermodynamics Equations
Chemical Potential Diffusion from high to low potential. Chemical potential is a Partial Molar Quantity Sum of moles of components
Chemical Potential of a Binary (A & B) Mixture Chem. Potential applied to other variables:
Other Partial Molar Quantities Partial Molar Volume: Partial Molar Enthalpy: Partial Molar Entropy:
Calculation for Partial Molar Volumes V = f(n. A , n. B) @ constant P & T
Raoult’s Law & Ideal Solutions Vapor Pressure (VP) Pi (escaping tendency g) Gas Ideality => No Intermolecular forces Solution Ideality => Uniformity in Intermolecular forces. (Binary: A-A , B-B , A-B all the same) Dalton’s Law
Raoult’s Law & Ideal Solutions
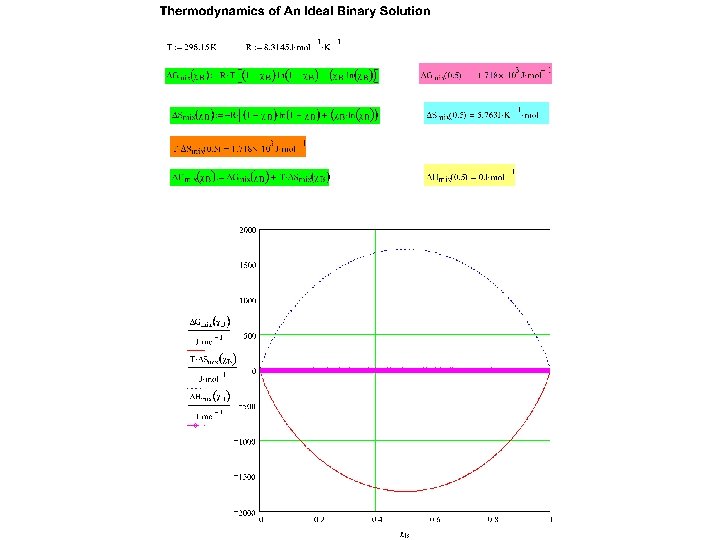
Thermodynamics of Mixing for an Ideal Solution
TD’s of Mixing for an Ideal Binary (A-B) Solution See Mathcad plot
Finding Minimum of ΔGmix curve
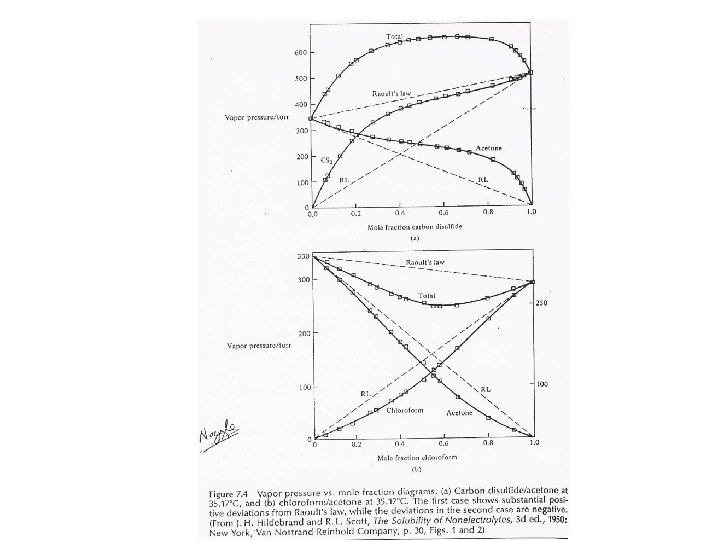
Henry’s Law (Solubility of gases in liquids) In dilution solutions, each solute is surrounded by solvent molecules (uniform environment, relatively ‘ideal. ’) Positive and Negative deviations from Raoult’s Law Endothermic Mixing versus Exothermic Mixing
Phase Diagrams
Phase Diagrams The Phase Diagrams of H 2 O and CO 2
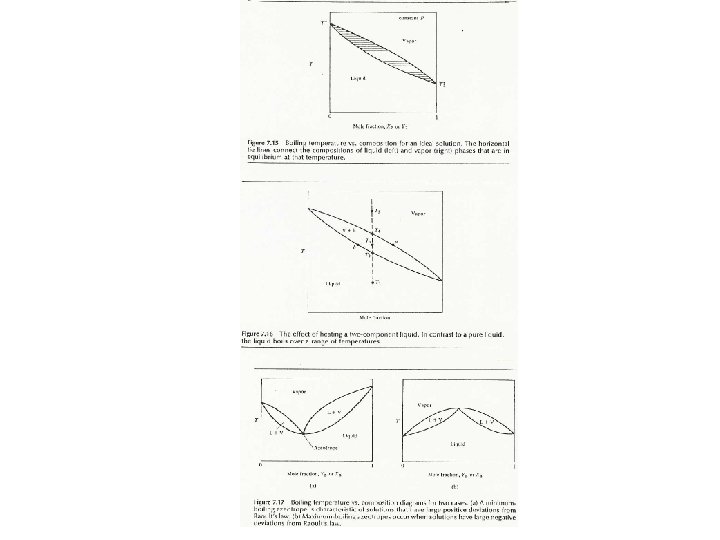
Phase Diagrams for Multi-components For 2 components: Need 3 variables ( T , P , composition ) P Most common plots: T VP vs. @ constant T B. pt. vs. @ constant P
Phase Diagrams for Multi-components Liquidus Curve: Vapour Curve:
Phase Diagrams for Multi-components
Colligative Properties Boiling-Point Elevation • Molal boiling-point-elevation constant, Kb, expresses how much Tb changes with molality, m. S: • Decrease in freezing point ( Tf) is directly proportional to molality (Kf is the molal freezing-point-depression constant):
Figure 13. 22
Solubility ( Conc’n vs. T ) Derivation starting with equilibrium thermodynamics, At equilibrium (constant P & T):
Freezing Point Depression ( T vs. conc’n ) Kf = molal freezing point constant, all properties of the solvent A [ units = K kg mol-1 ] Similar equation for Tb
Colligative Properties Osmosis • movement of a solvent from low solute concentration to high solute concentration across a semipermeable membrane. Figure 13. 23
Colligative Properties Osmosis • Osmotic pressure, , is the pressure required to stop osmosis:
Application to Polymeric Solutions
Ideal and Dilute Solutions