ICP Detection Limits Detection Limit DL or Limit

 or Limit of Detection (LOD) � The detection limit is the")


 or Method Quantification Limit (MQL) � MDL and MQL describe")


- Slides: 11
ICP Detection Limits
Detection Limit (DL) or Limit of Detection (LOD) � The detection limit is the concentration that is obtained when the measured signal differs significantly from the background. � Calculated by this equation for the ARCOS. � C 1 = concentration of the high sample � C 0 = concentration of the blank � I 1 = raw intensity of the high sample (cps) � I 0 = raw intensity of the blank (cps) � 3 is a confidence factor � σ (sigma) = standard deviation from a number of measurements of the blank (cps)
Confidence Factor - Example � Black curve – probability density function for the normal distribution of blank measurements. � LOD (Limit of detection) – defined here as 3 times the standard deviation of the blank. � α – alpha error (probability of a false positive) is only 1%. � β – beta error (probability of a false negative) - there is a 50% chance that the sample could contain the element, but record it as less than the LOD. � LOQ (Limit of quantification) – defined here as 10 times the standard deviation - a minimal chance of a false negative or a false positive. Gives greater confidence that the reported values are actually quantifiable.
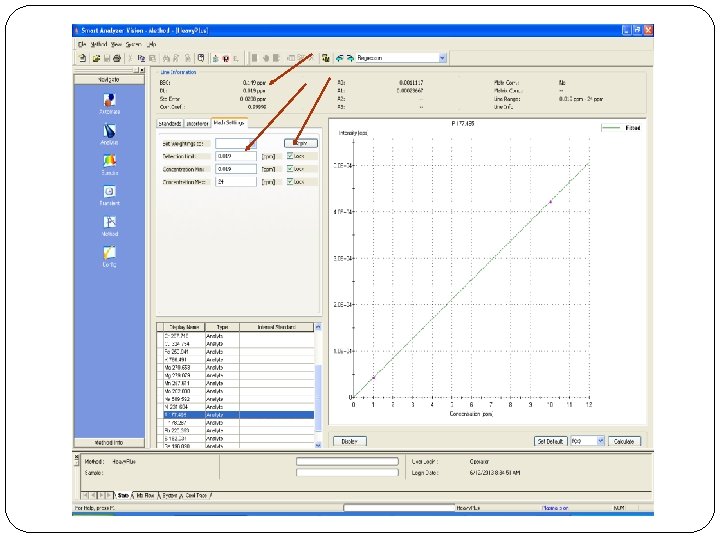
Example for P 177. 495 using 2 measurements Sample Blank 20 ppm �C 1 = 20 ppm �C 2 = 0 ppm �I 1 = 171777 cps �I 0 = 320 cps � Type <x> sd rsd OR or ~0. 019 ppm P 177. 495 cps 1 331. 526 2 308. 626 320. 076 16. 192 5. 059 1 171326 2 172227 171777 637. 103 0. 371
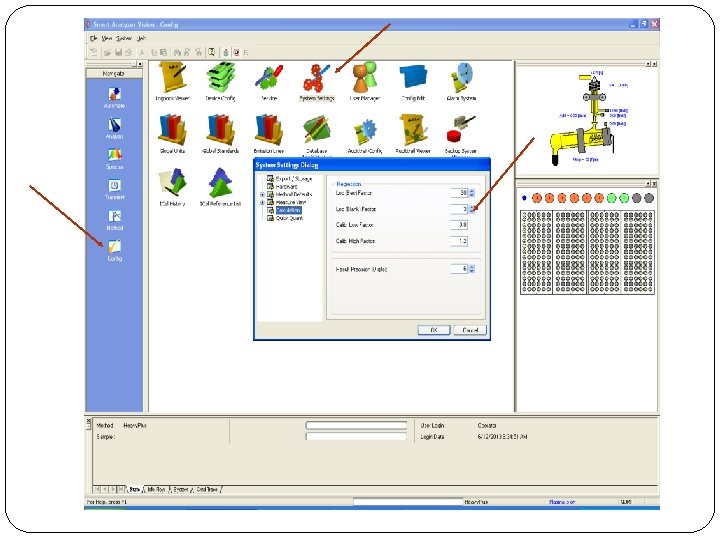
ARCOS - Summary � If the method only does one measurement - the DLs are not automatically calculated. � Input your confidence factor in the system settings. � Calibrate method with 7 - 10 measurements. � Lock the instrument calculated DLs into the math settings for each element. � Once the values are locked in, the method can be set back to 1 measurement. � If the method is set to more than 1 measurement per sample - ARCOS will automatically calculate a new DL for each element whenever it goes through the calibration if values not locked in. � Lock in the instrument calculated DLs from the 7 – 10 calibration measurements. � Set the desired number of measurements.
Results �Result is flagged with a < when below the detection limit Sample P ppm BLK < 0. 019 8773< 0. 019 8774 0. 037
Method Detection Limit (MDL) or Method Quantification Limit (MQL) � MDL and MQL describe the LOD and LOQ, respectively, when considering the method blank which goes through all steps of the analysis. � Estimate MDL and MQL by multiplying the LOD and LOQ by the method dilution factor. � ARCOS will take into account the given dilution factor when determining the detection limit for a sample. �For example, if your standard is 1 ppm and you set the instrument to read it at 100 for a 1: 100 dilution, the instrument’s DL will be multiplied by 100.
TJA 61 E �From command line – type xc”limits”. �Aspirate the blank. �Instrument will take 10 measurements and calculate the detection limits for each element in the method. �Calculate the quantifiable limits for each element as 10 times the given detection limits. �Set up limits tables for each method. �The result will be flagged with an “L” if below the quantifiable limit.
State ICP How are limits determined? How are limits used? How are limits reported? Kentucky Varian Vista Pro axial LOQ = (x–b+10σ)/m x = average b = intercept σ = std. dev. m = slope Research solutions <LOQ South Carolina ARCOS radial LOQ = 10σ /m Research solutions < With “<“ defined as indicating below quantification level of detection Arkansas ARCOS radial 3σ of 7 replicates using 3 for the student t value Research soil and plant Heavy metals on soil Flagged as “dl” with detection limit at bottom of report Alabama Radial and axial Florida Spectro CIROS radial Spectro ARCOS axial Perkin. Elmer 5300 DV radial and/or axial Oklahoma Spectro ARCOS axial Spectro CIROS radial Do not use Mississippi Perkin Elmer Optima 4300 DV radial and/or axial Do not use Virginia Spectro CIROS Vision and ARCOS – radial Tennessee PE 5300 and 7300 Dual view Georgia TJA 61 E radial Spectro ARCOS axial North Carolina – soils TJA 61 E, Spectro Do not use Variation of USEPA 40 CFR 136 Use instrument DL or MDL = σ x 3. 143 (student’s t-value for 7 reps) Research and NELAC certified Do not use for Extension samples. Research solutions < MDL reported with “T” > MDL and < PQL reported with “I” Required by Fl dept of Environmental Protection Flagged as < Do not use MDL = 3 x σ for 8 reps Use on all samples. Do not use Reporting limit (RL) RL = 3 x MDL Reported as < or negligible