
ICI Boilers EPA Meeting November 21 2008 Why
ICI Boilers EPA Meeting November 21, 2008
Why control ICI boilers? • Important source of SO 2 and NOx emissions • Cost-effective emission reductions achievable • Emission reductions provide regional and local air quality benefits (needed for ozone, PM 2. 5, and haze)
Overview • Background: review State Collaborative process and emissions inventories • Workgroup recommendations • Performance-based emission limitations • Emissions reporting • Combustion tuning • Analysis of recommended emission limits • Costs • Emissions reduction • Air quality impact
State Collaborative Process • December 2005 Meeting • NE and MW Commissioners/Directors met to discuss coordinating control programs to meet current NAAQS, and preparing for new, tighter NAAQS • Agreed to explore several control measures, including – One consistent environmentally-sensitive formulated gasoline – Consistent standards for a range of consumer products – ICI boilers • Regular Conference Calls • On-going discussions over past couple years • Formed workgroup with staff from NE and MW states to prepare a recommendation on ICI boilers • Agreed to send letter to EPA
State Collaborative Process • Letter to EPA (Indiana - November 15, 2007, 16 other states - June 11, 2008) • Asks for a dialogue to address multi-pollutant air quality problems in eastern U. S. • Dialogue to include identifying strategies for achieving effective, equitable, and necessary emission reductions (e. g. , 3 rd phase of reductions for EGUs, and controls for existing ICI boilers)
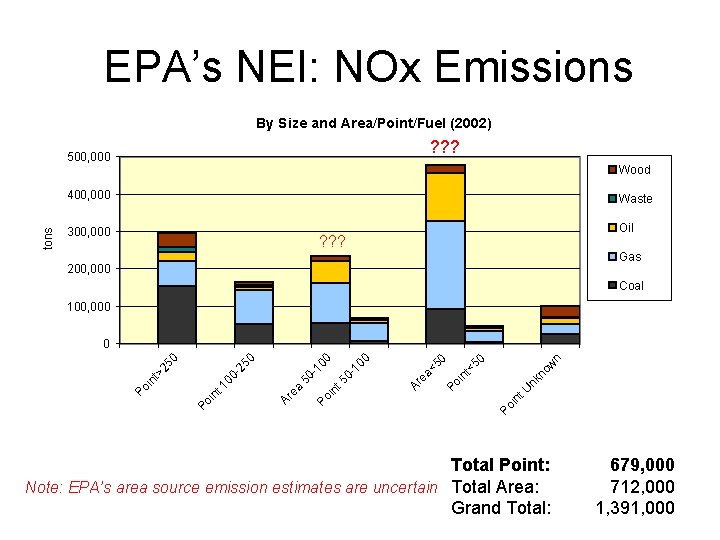
EPA’s NEI: NOx Emissions By Size and Area/Point/Fuel (2002) ? ? ? tons 500, 000 Wood 400, 000 Waste 300, 000 Oil ? ? ? Gas 200, 000 Coal 100, 000 n no w nk in t U Po ea <5 0 Po in t< 50 Ar 01 00 00 in t 5 Po 50 -1 ea Ar in t 1 Po Po i nt >2 00 -2 50 50 0 Total Point: Note: EPA’s area source emission estimates are uncertain Total Area: Grand Total: 679, 000 712, 000 1, 391, 000
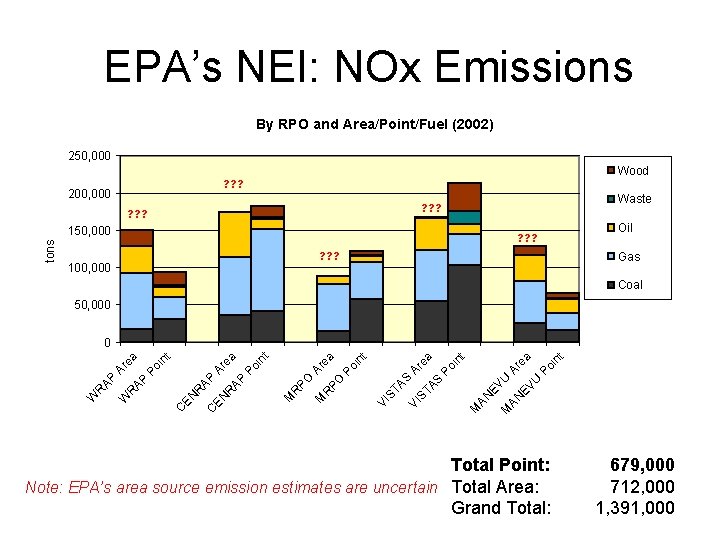
EPA’s NEI: NOx Emissions By RPO and Area/Point/Fuel (2002) 250, 000 Wood ? ? ? 200, 000 Waste ? ? ? tons 150, 000 Oil ? ? ? Gas ? ? ? 100, 000 Coal 50, 000 A r in t AN EV U U EV M AN P o ea in t M ST A S Ar ST A VI S Po ea t oi n P PO R M R PO A re a in t M VI C EN R AP A r AP R EN C P o ea nt Po i AP R W W R AP Ar e a 0 Total Point: Note: EPA’s area source emission estimates are uncertain Total Area: Grand Total: 679, 000 712, 000 1, 391, 000
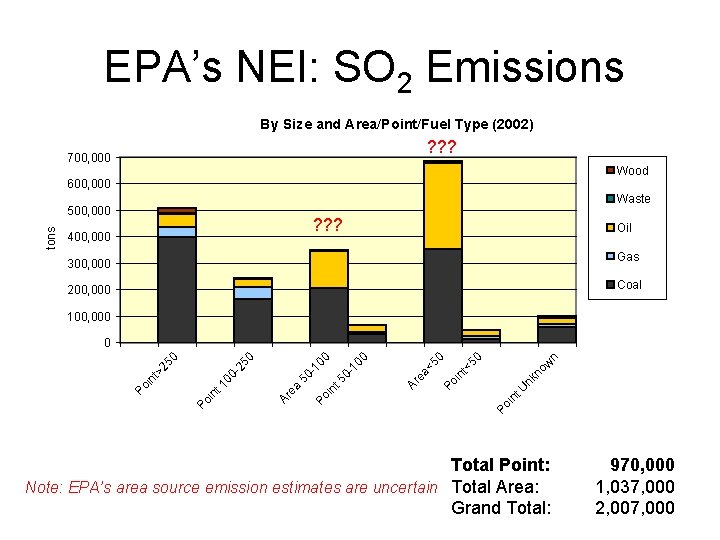
EPA’s NEI: SO 2 Emissions By Size and Area/Point/Fuel Type (2002) ? ? ? 700, 000 Wood 600, 000 Waste tons 500, 000 ? ? ? 400, 000 Oil Gas 300, 000 Coal 200, 000 100, 000 n nk no w in t U Po ea <5 0 Po in t< 50 Ar 010 0 0 10 in t 5 Po 50 Ar ea 00 in t 1 Po Po i nt >2 50 -2 50 0 Total Point: Note: EPA’s area source emission estimates are uncertain Total Area: Grand Total: 970, 000 1, 037, 000 2, 007, 000
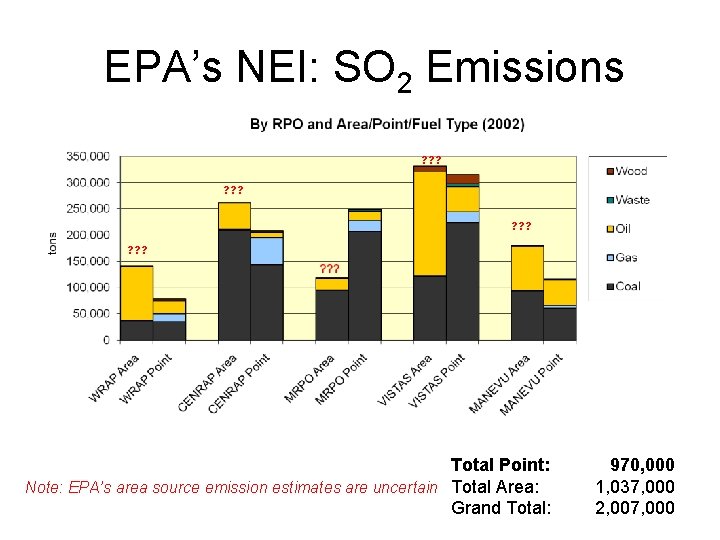
EPA’s NEI: SO 2 Emissions ? ? ? Total Point: Note: EPA’s area source emission estimates are uncertain Total Area: Grand Total: 970, 000 1, 037, 000 2, 007, 000
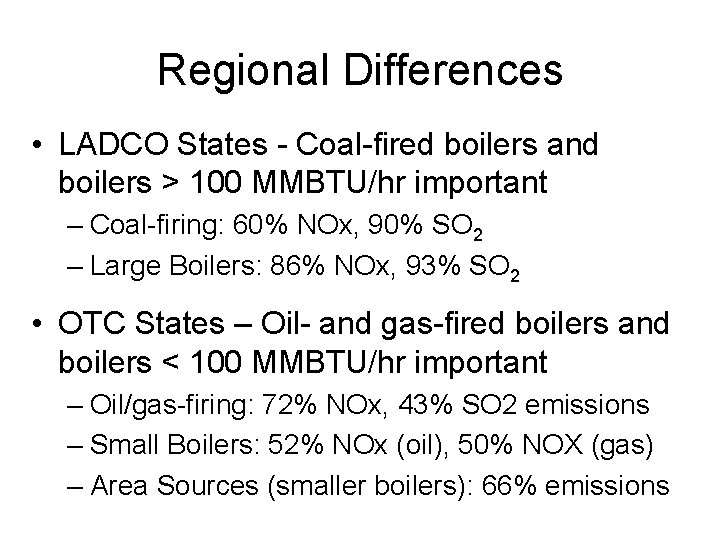
Regional Differences • LADCO States - Coal-fired boilers and boilers > 100 MMBTU/hr important – Coal-firing: 60% NOx, 90% SO 2 – Large Boilers: 86% NOx, 93% SO 2 • OTC States – Oil- and gas-fired boilers and boilers < 100 MMBTU/hr important – Oil/gas-firing: 72% NOx, 43% SO 2 emissions – Small Boilers: 52% NOx (oil), 50% NOX (gas) – Area Sources (smaller boilers): 66% emissions
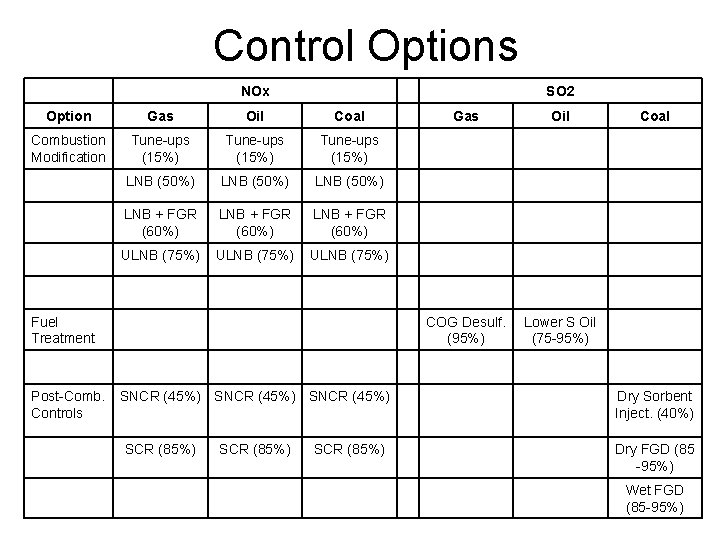
Control Options NOx SO 2 Option Gas Oil Coal Combustion Modification Tune-ups (15%) LNB (50%) LNB + FGR (60%) ULNB (75%) Fuel Treatment COG Desulf. (95%) Lower S Oil (75 -95%) Post-Comb. SNCR (45%) Controls Dry Sorbent Inject. (40%) SCR (85%) Dry FGD (85 -95%) Wet FGD (85 -95%)
Workgroup Recommendation 1. Emissions limitations (performance-based) • For NOx and SO 2 on certain boiler sizes and fuel types, based on available inventories and/or recent state actions 2. Emissions reporting for units ≥ 25 mm. Btu/hr • Total annual consumption by fuel type • Results of any fuel analyses • Results of emission measurements 3. Combustion tuning (units > 25 MMBTU/hr) • Performed on annual basis
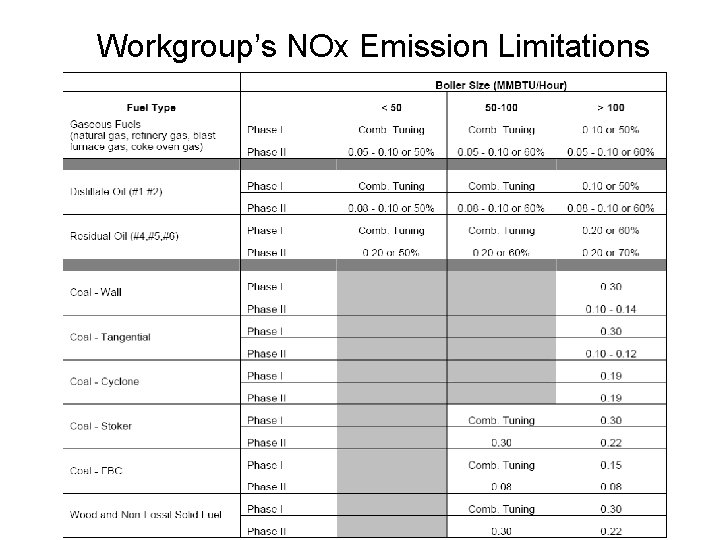
Workgroup’s NOx Emission Limitations
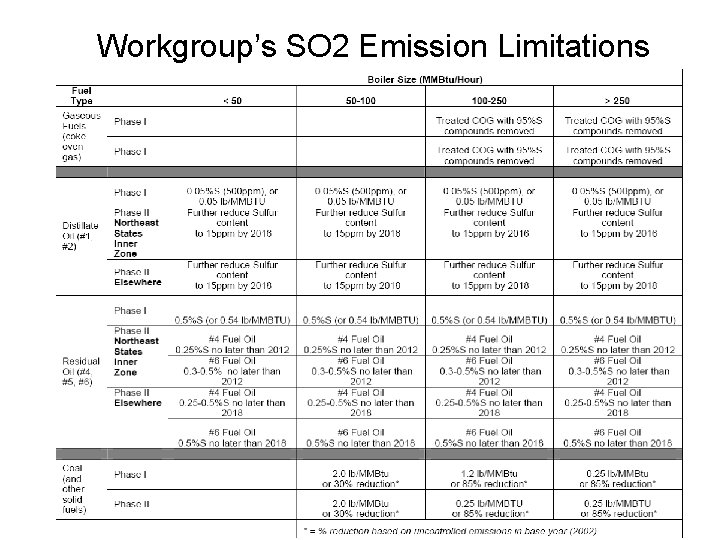
Workgroup’s SO 2 Emission Limitations
Analysis of Recommended Emission Limitations • Costs • Emissions Reduction • Air Quality Impact
Costs: Background Documents • Numerous background documents were reviewed (EPA, DOE, OTAG, NACAA*, NESCAUM, LADCO, Federal & State regulations, etc. ) • Control Cost Methodology derived mainly from: – “Midwest RPO BART Engineering Analysis” MACTEC, March 30, 2005 – “ACT Document – NOx Emissions from ICI Boilers”, EPA 453/R-94 -022, March 1994 *NACAA formerly STAPPA & ALAPCO
Types of NOx Control Equipment Analyzed • Low NOx Burners (LNB) • Low NOx Burners plus Flue Gas Recirculation (LNB+FGR) • Low NOx Burners plus Selective Non-Catalytic Reduction (LNB+SNCR) • Selective Non-Catalytic Reduction (SNCR) • Selective Catalytic Reduction (SCR)
Types of SO 2 Control Equipment Analyzed • Dry Flue Gas De-Sulfurization (Dry FGD) • Wet Flue Gas De-Sulfurization (Wet FGD)
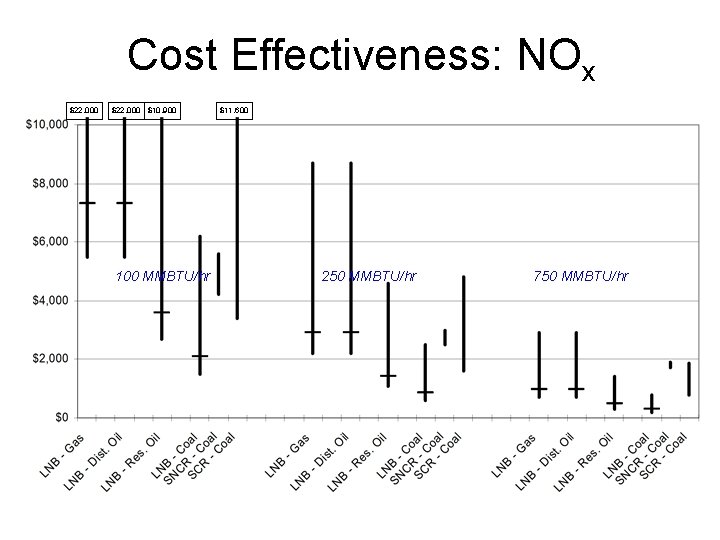
Cost Effectiveness: NOx $22, 000 $10, 900 100 MMBTU/hr $11, 600 250 MMBTU/hr 750 MMBTU/hr
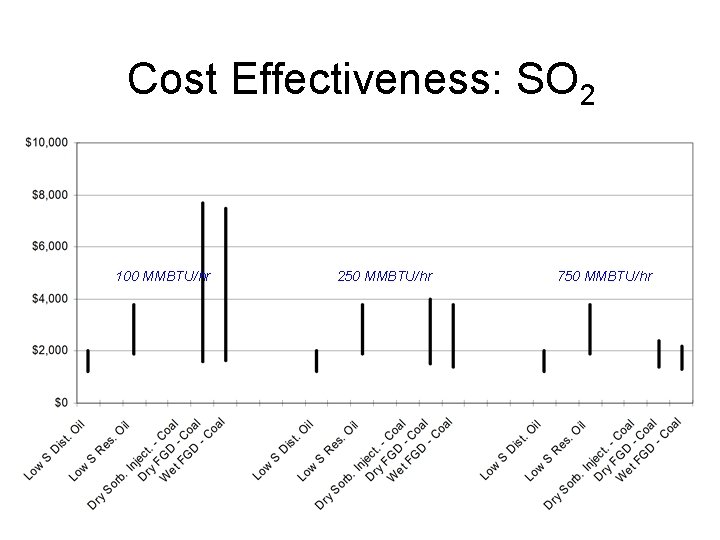
Cost Effectiveness: SO 2 100 MMBTU/hr 250 MMBTU/hr 750 MMBTU/hr
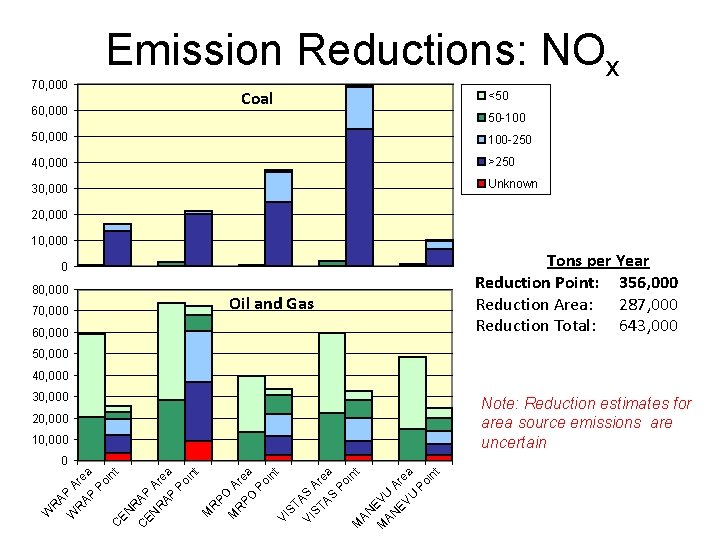
Emission Reductions: NOx 70, 000 Coal 60, 000 <50 50 -100 50, 000 100 -250 40, 000 >250 30, 000 Unknown 20, 000 10, 000 0 80, 000 Oil and Gas 70, 000 60, 000 Tons per Year Reduction Point: 356, 000 Reduction Area: 287, 000 Reduction Total: 643, 000 50, 000 40, 000 30, 000 Note: Reduction estimates for area source emissions are uncertain 20, 000 10, 000 R A C EN P R Are AP a P oi nt M R PO M R Are PO a P oi nt VI ST A VI S ST Ar AS ea P oi nt M AN EV M AN U EV Are U a P oi nt C EN R W W R AP Ar AP ea P oi nt 0
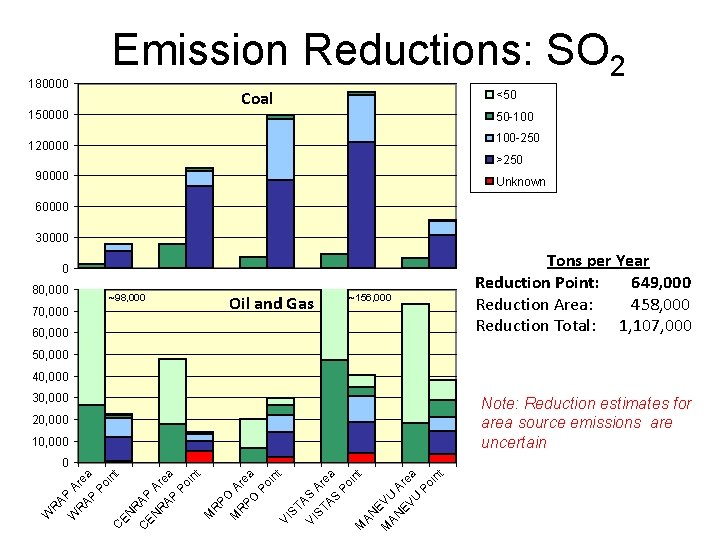
Emission Reductions: SO 2 180000 Coal 150000 <50 50 -100 100 -250 120000 >250 90000 Unknown 60000 30000 0 80, 000 ~98, 000 70, 000 Oil and Gas ~156, 000 60, 000 Tons per Year Reduction Point: 649, 000 Reduction Area: 458, 000 Reduction Total: 1, 107, 000 50, 000 40, 000 30, 000 Note: Reduction estimates for area source emissions are uncertain 20, 000 10, 000 R A C EN P A r R AP ea P oi nt M R PO M R Are PO a P oi nt VI ST A VI S ST Ar AS ea P oi nt M AN EV M AN U A EV re U a P oi nt C EN R W W R AP Ar AP ea P oi nt 0
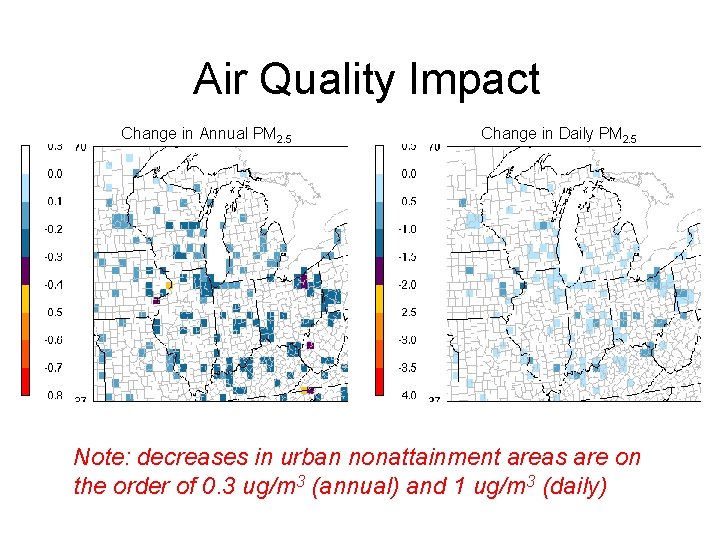
Air Quality Impact Change in Annual PM 2. 5 Change in Daily PM 2. 5 Note: decreases in urban nonattainment areas are on the order of 0. 3 ug/m 3 (annual) and 1 ug/m 3 (daily)
Next Steps • Complete documentation for recommendation (Technical Support Document) • Transmit recommendation to EPA • Meet with stakeholders • Work with EPA • Coordination on boiler MACT • Support EPA rulemaking
Bonus Material
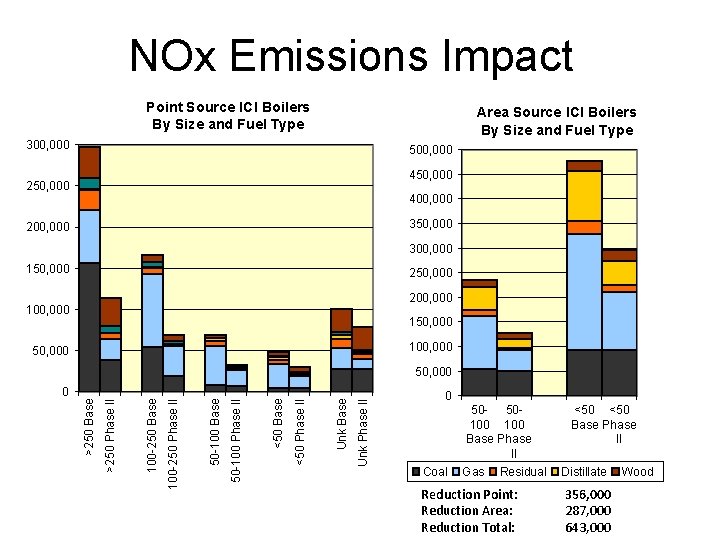
NOx Emissions Impact Point Source ICI Boilers By Size and Fuel Type Area Source ICI Boilers By Size and Fuel Type 300, 000 500, 000 450, 000 250, 000 400, 000 350, 000 200, 000 300, 000 150, 000 200, 000 150, 000 100, 000 50, 000 Unk Phase II Unk Base <50 Phase II <50 Base 50 -100 Phase II 50 -100 Base 100 -250 Phase II 100 -250 Base >250 Phase II 0 >250 Base 50, 000 0 50 - 50100 Base Phase II Coal Gas Residual Reduction Point: Reduction Area: Reduction Total: <50 Base Phase II Distillate 356, 000 287, 000 643, 000 Wood
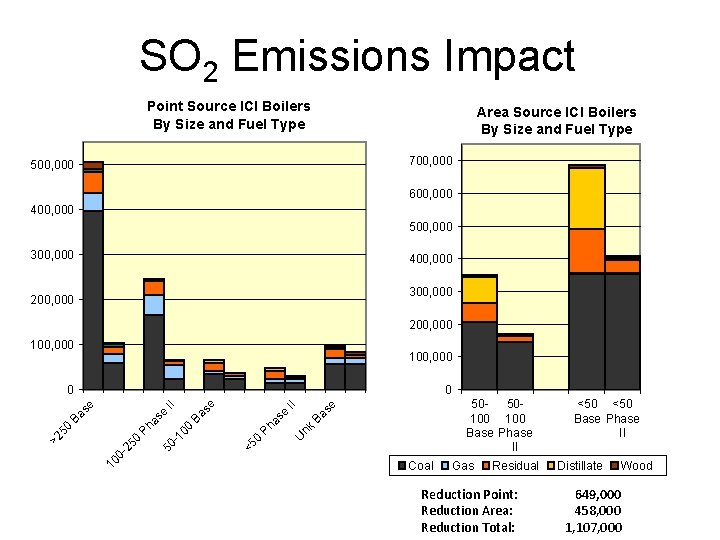
SO 2 Emissions Impact Point Source ICI Boilers By Size and Fuel Type Area Source ICI Boilers By Size and Fuel Type 700, 000 500, 000 600, 000 400, 000 500, 000 300, 000 400, 000 300, 000 200, 000 100, 000 0 U nk B as e 5050100 Base Phase II <5 0 Ph as e II se 0 Ba -1 0 50 -2 50 10 0 >2 50 P h as B a se e II 0 Coal Gas Residual Reduction Point: Reduction Area: Reduction Total: <50 Base Phase II Distillate Wood 649, 000 458, 000 1, 107, 000
- Slides: 27