
Ice loss processes in the Seal Nunataks ice
- Slides: 12
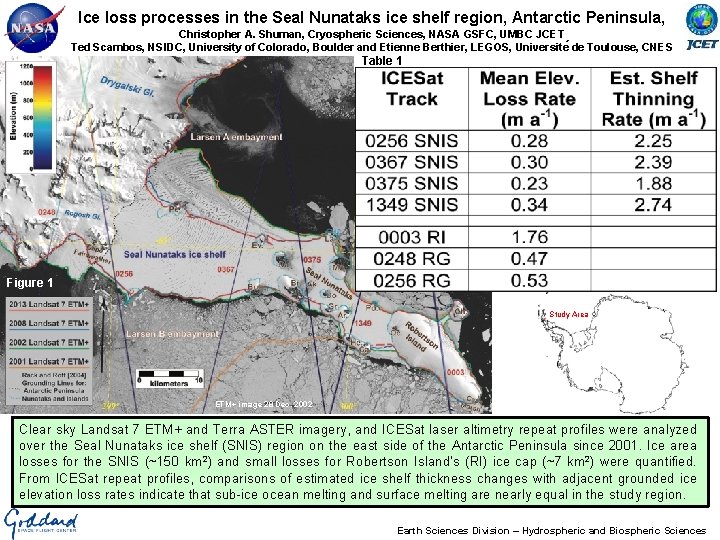
Ice loss processes in the Seal Nunataks ice shelf region, Antarctic Peninsula, Christopher A. Shuman, Cryospheric Sciences, NASA GSFC, UMBC JCET Ted Scambos, NSIDC, University of Colorado, Boulder and Etienne Berthier, LEGOS, Universite de Toulouse, CNES Table 1 Figure 1 Study Area ETM+ image 28 Dec. 2002 Clear sky Landsat 7 ETM+ and Terra ASTER imagery, and ICESat laser altimetry repeat profiles were analyzed over the Seal Nunataks ice shelf (SNIS) region on the east side of the Antarctic Peninsula since 2001. Ice area losses for the SNIS (~150 km 2) and small losses for Robertson Island’s (RI) ice cap (~7 km 2) were quantified. From ICESat repeat profiles, comparisons of estimated ice shelf thickness changes with adjacent grounded ice elevation loss rates indicate that sub-ice ocean melting and surface melting are nearly equal in the study region. Earth Sciences Division – Hydrospheric and Biospheric Sciences
Name: Christopher A. Shuman, Cryospheric Sciences, NASA GSFC and UMBC JCET E-mail: cshuman@umbc. edu, christopher. a. shuman@nasa. gov Phone: 301 -614 -5706 References: Shuman, C. A. , T. A. Scambos, and E. Berthier, (2016). Ice loss processes in the Seal Nunataks ice shelf region from satellite altimetry and imagery, Annals of Glaciology, in press. Scambos, T. A. , E. Berthier, T. Haran, C. A. Shuman, A. J. Cook, S. R. M. Ligtenberg, and J. Bohlander (2014). Detailed ice loss pattern in the northern Antarctic Peninsula: widespread decline driven by ice front retreats, The Cryosphere, 8, 2135 -2145, doi: 10. 5194/tc-8 -2135 -2014. Berthier, E. , T. A. Scambos, and C. A. Shuman (2012). Mass loss of Larsen B tributary glaciers (Antarctic Peninsula) unabated since 2002, Geophysical Research Letters, 39 (13), L 13501. doi: 10. 1029/2012 GL 051755 Shuman, C. A. , E. Berthier and T. Scambos, (2011). 2001 -2009 elevation and mass losses in the Larsen A & B embayments, Antarctic Peninsula. Journal of Glaciology, 57(204), pp. 737 -754, doi: 10. 3189/002214311797409811. Scambos, T. A. , E. Berthier and C. A. Shuman (2011). The triggering of sub-glacial lake drainage during the rapid glacier drawdown: Crane Glacier, Antarctic Peninsula. Annals of Glaciology, 52(59), pp. 74 -82, doi: 10. 3189/172756411799096204. Data Sources: Landsat 7 and Terra ASTER panchromatic imagery, and ICESat repeat profiles were used to create this time series of recent (since 2001) ice edge positions and ice shelf and tributary glacier thickness changes, respectively, for the northernmost Antarctic Peninsula ice shelf of substantial size. At GSFC, the support of Patricia Vornberger and Katherine Melocik was important to the imagery portion of the study and the assistance of Michelle Hofton was important for the ICESat portion of the analysis. Please see the paper for additional details. Technical Description of Figures: Figure 1 is a December 2002 Landsat 7 base map showing the locations of the four ICESat tracks crossing the Seal Nunataks ice shelf (SNIS) remnant on the east side of the Antarctic Peninsula as well as the three tracks crossing the grounded Rogosh Glacier (RG) tributary and Robertson Island (RI) ice cap. Ice margins were determined from multiple Landsat 7 ETM+ images for the ice shelf and ASTER images were used for the smaller RI. The SNIS area changed from ~992 km 2 in 2002 to ~743 km 2 in 2013. RI decreased from ~166 km 2 in 2001 to ~159 km 2 in 2012. Colored lines are used to indicate the area changes. Table 1: The ICESat repeat tracks allowed ~2 meter ice shelf thinning rates to be estimated for the four SNIS tracks (top rows) during 2003 -2009 as well as substantial elevation losses for RG and RI (bottom rows). Comparing these rates indicates that substantial thickness losses are due nearly equally to surface (atmospheric) and subsurface (oceanic) melting. Ice velocities are very slow in this area so dynamic thinning was discounted as a factor. Imagery analysis indicates that regular surface melting, e. g. dark, curvilinear melt ponds on SNIS in Figure 1, and additional rifting/calving occurred through the study period and that the SNIS remnant is unlikely to persist for very long into the future. Scientific significance, societal relevance, and relationships to future missions: The continuing observations from the Landsat and ASTER sensors of areas of unmistakable climate change in the polar regions provides compelling visuals for the public, scientific colleagues, and policymakers. The repeat laser altimetry from ICESat, concluding in 2009, suggests the kinds of processes that will be further explored when ICESat-2 launches in 2018. Earth Sciences Division – Hydrospheric and Biospheric Sciences
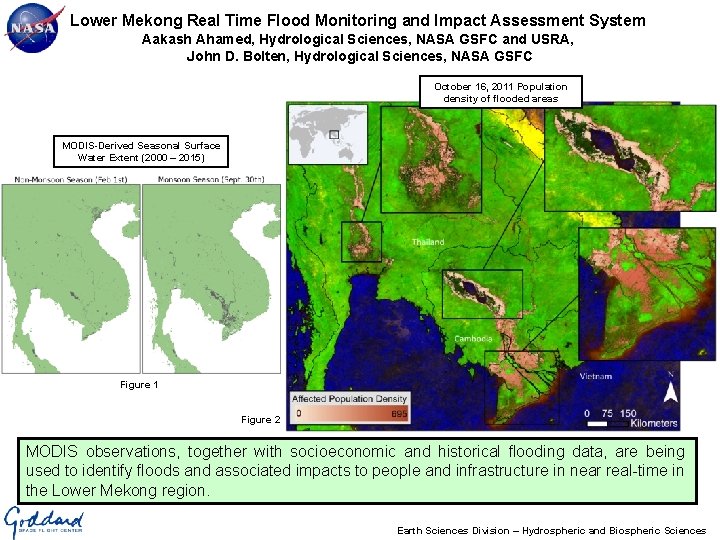
Lower Mekong Real Time Flood Monitoring and Impact Assessment System Aakash Ahamed, Hydrological Sciences, NASA GSFC and USRA, John D. Bolten, Hydrological Sciences, NASA GSFC October 16, 2011 Population density of flooded areas MODIS-Derived Seasonal Surface Water Extent (2000 – 2015) Figure 1 Figure 2 MODIS observations, together with socioeconomic and historical flooding data, are being used to identify floods and associated impacts to people and infrastructure in near real-time in the Lower Mekong region. Earth Sciences Division – Hydrospheric and Biospheric Sciences
Name: John Bolten, Hydrological Sciences, NASA GSFC E-mail: john. bolten@nasa. gov Phone: 301 -614 -6529 References: Ahamed, A. , Bolten, J. D. , Doyle, C. S. , (In Prep). Near Real-Time Flood Impact Assessment Systems for Southeast Asia. Ahamed, A. , Bolten, J. D. , Doyle, C. S. , Fayne, J. , 2016 (Accepted). Near Real Time Flood Monitoring and Impact Assessment Systems. In Remote Sensing of Hydrological Extremes. Project website: http: //projectmekongnasa. appspot. com Data Sources: Earth observation datasets – MODIS Surface Reflectance (MOD/MYD 09 Q 1 and A 1 for historic product, MOD/MYD 09 GA and MOD 35 for Near Real-Time product), MODIS Permanent Water Bodies (MOD 44 W). Population Data – Worldpop (http: //worldpop. org) Infrastructure Data – Open Street Map (http: //www. openstreetmap. org/) Technical Description of Figures: Figure 1. Illustrates strong seasonal surface water variations in the Mekong River Basin and Southeast Asia. Average Surface Water extent (2000 – 2015) for the non-monsoon season (February 1 st) is shown in the left panel and average Surface Water extent (2000 – 2015) for the peak of the monsoon season (September 30 th) is shown in the right panel. Surface water is classified by determining the seasonal NDVI values of permanent water bodies and classifying pixels matching these spectral criteria as seasonal surface water. Figure 2. Shows the population density of areas affected by severe flooding in 2011. The top left inset is a zoom in the Bangkok area of Thailand. The top right inset is a zoom of Tonle Sap Lake region and Phnom Penh, Cambodia. The middle-right inset is a zoom of the Vietnamese Mekong Delta. The background image is a false color, cloud filtered MODIS composite of images acquired between 9/27/2011 and 11/30/2011. Code used to generate the background image is available at https: //code. earthengine. google. com/6 cae 60 e 4 dd 1 d 1 d 625158 b 4 b 0 a 895796 a. Scientific significance, societal relevance, and relationships to future missions: Flood disaster events in Southeast Asia result in significant loss of life and economic damage. Remote sensing information systems designed to monitor floods and assess their severity can help governments and international agencies formulate an effective response during a disaster, and ultimately alleviate impacts to population, infrastructure, and agriculture. MODIS instruments can be used to automatically formulate near real-time estimates of flood extent and impacts to population and infrastructure. This operational system (available at http: //projectmekongnasa. appspot. com) can help governments and international agencies respond effectively to sudden onset flood events. In addition, MODIS-based flood products can be used to inform radar satellite tasking to persistently cloudy or highly damaged areas. MODIS-derived surface water extent products (e. g. Figure 1) exhibit good agreement (80 -90%) when compared to high resolution (22 m – 150 m) radar data (Terra. SAR-X, Envisat ASAR, Disaster Monitoring Constellation), during both flood and nonflood conditions. These methods may be extended to other sensors (e. g. VIIRS, Landsat), as well as future missions. Earth Sciences Division – Hydrospheric and Biospheric Sciences
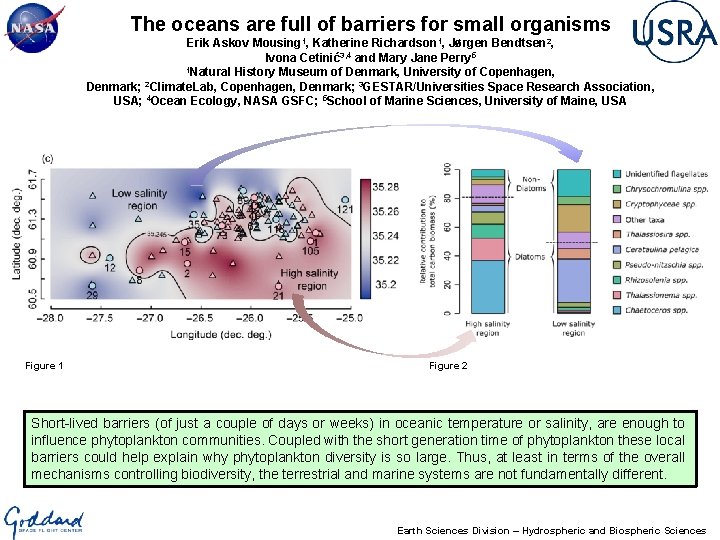
The oceans are full of barriers for small organisms Erik Askov Mousing 1, Katherine Richardson 1, Jørgen Bendtsen 2, Ivona Cetinić3, 4 and Mary Jane Perry 5 1 Natural History Museum of Denmark, University of Copenhagen, 2 Denmark; Climate. Lab, Copenhagen, Denmark; 3 GESTAR/Universities Space Research Association, USA; 4 Ocean Ecology, NASA GSFC; 5 School of Marine Sciences, University of Maine, USA Figure 1 Figure 2 Short-lived barriers (of just a couple of days or weeks) in oceanic temperature or salinity, are enough to influence phytoplankton communities. Coupled with the short generation time of phytoplankton these local barriers could help explain why phytoplankton diversity is so large. Thus, at least in terms of the overall mechanisms controlling biodiversity, the terrestrial and marine systems are not fundamentally different. Earth Sciences Division – Hydrospheric and Biospheric Sciences
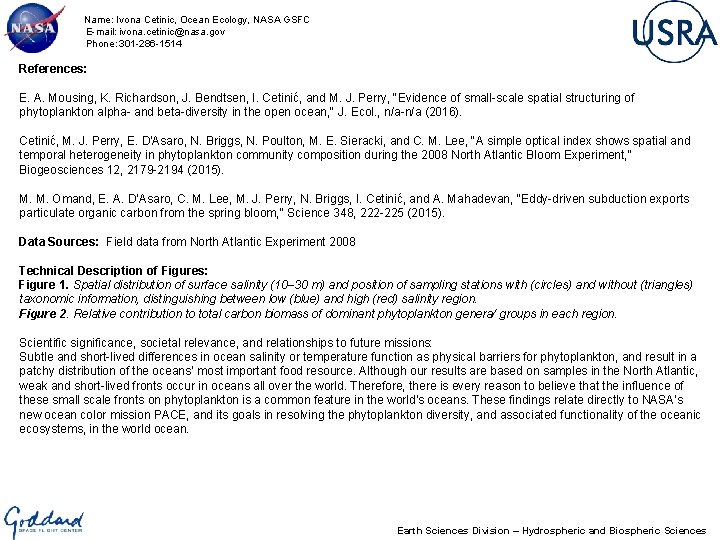
Name: Ivona Cetinic, Ocean Ecology, NASA GSFC E-mail: ivona. cetinic@nasa. gov Phone: 301 -286 -1514 References: E. A. Mousing, K. Richardson, J. Bendtsen, I. Cetinić, and M. J. Perry, "Evidence of small-scale spatial structuring of phytoplankton alpha- and beta-diversity in the open ocean, " J. Ecol. , n/a-n/a (2016). Cetinić, M. J. Perry, E. D'Asaro, N. Briggs, N. Poulton, M. E. Sieracki, and C. M. Lee, "A simple optical index shows spatial and temporal heterogeneity in phytoplankton community composition during the 2008 North Atlantic Bloom Experiment, " Biogeosciences 12, 2179 -2194 (2015). M. M. Omand, E. A. D’Asaro, C. M. Lee, M. J. Perry, N. Briggs, I. Cetinić, and A. Mahadevan, "Eddy-driven subduction exports particulate organic carbon from the spring bloom, " Science 348, 222 -225 (2015). Data Sources: Field data from North Atlantic Experiment 2008 Technical Description of Figures: Figure 1. Spatial distribution of surface salinity (10– 30 m) and position of sampling stations with (circles) and without (triangles) taxonomic information, distinguishing between low (blue) and high (red) salinity region. Figure 2. Relative contribution to total carbon biomass of dominant phytoplankton genera/ groups in each region. Scientific significance, societal relevance, and relationships to future missions: Subtle and short-lived differences in ocean salinity or temperature function as physical barriers for phytoplankton, and result in a patchy distribution of the oceans’ most important food resource. Although our results are based on samples in the North Atlantic, weak and short-lived fronts occur in oceans all over the world. Therefore, there is every reason to believe that the influence of these small scale fronts on phytoplankton is a common feature in the world’s oceans. These findings relate directly to NASA’s new ocean color mission PACE, and its goals in resolving the phytoplankton diversity, and associated functionality of the oceanic ecosystems, in the world ocean. Earth Sciences Division – Hydrospheric and Biospheric Sciences
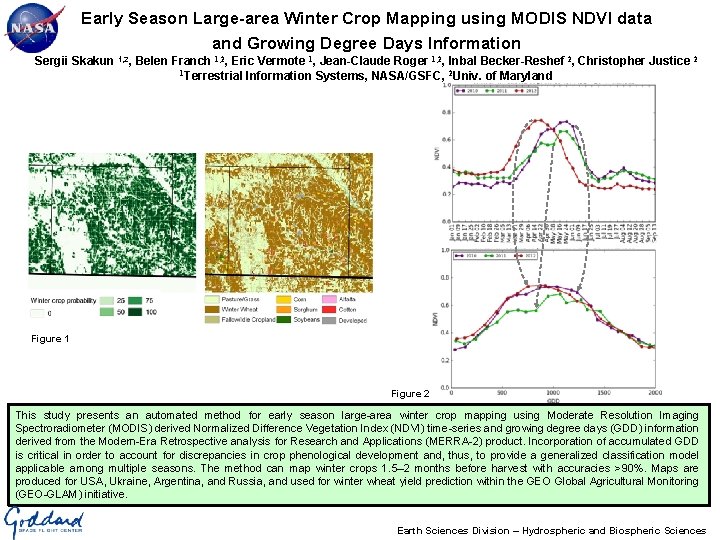
Early Season Large-area Winter Crop Mapping using MODIS NDVI data and Growing Degree Days Information Sergii Skakun 1, 2, Belen Franch 1, 2, Eric Vermote 1, Jean-Claude Roger 1, 2, Inbal Becker-Reshef 2, Christopher Justice 2 1 Terrestrial Information Systems, NASA/GSFC, 2 Univ. of Maryland Figure 1 Figure 2 This study presents an automated method for early season large-area winter crop mapping using Moderate Resolution Imaging Spectroradiometer (MODIS) derived Normalized Difference Vegetation Index (NDVI) time-series and growing degree days (GDD) information derived from the Modern-Era Retrospective analysis for Research and Applications (MERRA-2) product. Incorporation of accumulated GDD is critical in order to account for discrepancies in crop phenological development and, thus, to provide a generalized classification model applicable among multiple seasons. The method can map winter crops 1. 5– 2 months before harvest with accuracies >90%. Maps are produced for USA, Ukraine, Argentina, and Russia, and used for winter wheat yield prediction within the GEO Global Agricultural Monitoring (GEO-GLAM) initiative. Earth Sciences Division – Hydrospheric and Biospheric Sciences
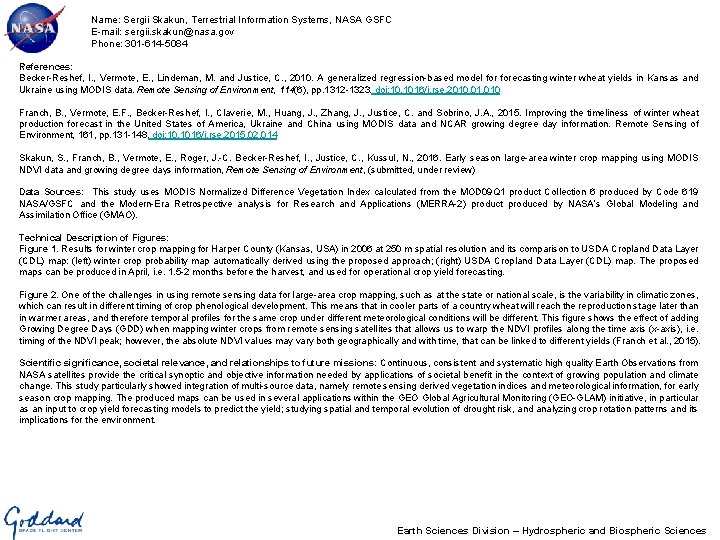
Name: Sergii Skakun, Terrestrial Information Systems, NASA GSFC E-mail: sergii. skakun@nasa. gov Phone: 301 -614 -5084 References: Becker-Reshef, I. , Vermote, E. , Lindeman, M. and Justice, C. , 2010. A generalized regression-based model forecasting winter wheat yields in Kansas and Ukraine using MODIS data. Remote Sensing of Environment, 114(6), pp. 1312 -1323. doi: 10. 1016/j. rse. 2010. 010 Franch, B. , Vermote, E. F. , Becker-Reshef, I. , Claverie, M. , Huang, J. , Zhang, J. , Justice, C. and Sobrino, J. A. , 2015. Improving the timeliness of winter wheat production forecast in the United States of America, Ukraine and China using MODIS data and NCAR growing degree day information. Remote Sensing of Environment, 161, pp. 131 -148. doi: 10. 1016/j. rse. 2015. 02. 014 Skakun, S. , Franch, B. , Vermote, E. , Roger, J. -C. Becker-Reshef, I. , Justice, C. , Kussul, N. , 2016. Early season large-area winter crop mapping using MODIS NDVI data and growing degree days information, Remote Sensing of Environment, (submitted, under review) Data Sources: This study uses MODIS Normalized Difference Vegetation Index calculated from the MOD 09 Q 1 product Collection 6 produced by Code 619 NASA/GSFC and the Modern-Era Retrospective analysis for Research and Applications (MERRA-2) product produced by NASA’s Global Modeling and Assimilation Office (GMAO). Technical Description of Figures: Figure 1. Results for winter crop mapping for Harper County (Kansas, USA) in 2006 at 250 m spatial resolution and its comparison to USDA Cropland Data Layer (CDL) map: (left) winter crop probability map automatically derived using the proposed approach; (right) USDA Cropland Data Layer (CDL) map. The proposed maps can be produced in April, i. e. 1. 5 -2 months before the harvest, and used for operational crop yield forecasting. Figure 2. One of the challenges in using remote sensing data for large-area crop mapping, such as at the state or national scale, is the variability in climatic zones, which can result in different timing of crop phenological development. This means that in cooler parts of a country wheat will reach the reproduction stage later than in warmer areas, and therefore temporal profiles for the same crop under different meteorological conditions will be different. This figure shows the effect of adding Growing Degree Days (GDD) when mapping winter crops from remote sensing satellites that allows us to warp the NDVI profiles along the time axis (x-axis), i. e. timing of the NDVI peak; however, the absolute NDVI values may vary both geographically and with time, that can be linked to different yields (Franch et al. , 2015). Scientific significance, societal relevance, and relationships to future missions: Continuous, consistent and systematic high quality Earth Observations from NASA satellites provide the critical synoptic and objective information needed by applications of societal benefit in the context of growing population and climate change. This study particularly showed integration of multi-source data, namely remote sensing derived vegetation indices and meteorological information, for early season crop mapping. The produced maps can be used in several applications within the GEO Global Agricultural Monitoring (GEO-GLAM) initiative, in particular as an input to crop yield forecasting models to predict the yield; studying spatial and temporal evolution of drought risk, and analyzing crop rotation patterns and its implications for the environment. Earth Sciences Division – Hydrospheric and Biospheric Sciences
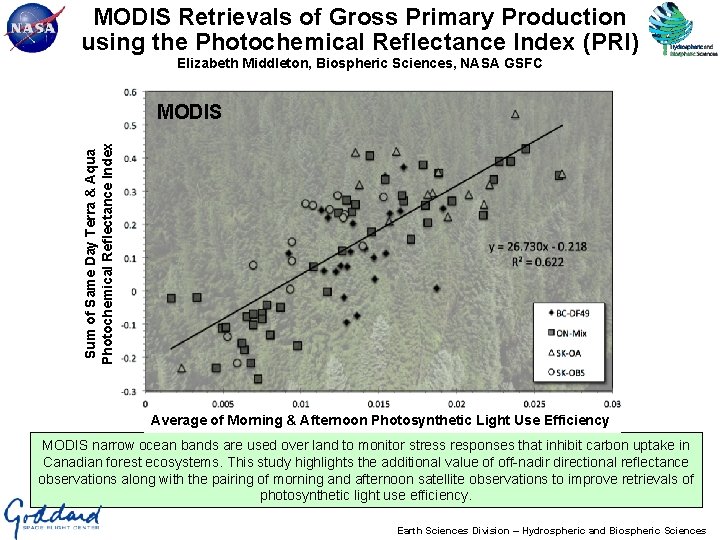
MODIS Retrievals of Gross Primary Production using the Photochemical Reflectance Index (PRI) Elizabeth Middleton, Biospheric Sciences, NASA GSFC Sum of Same Day Terra & Aqua Photochemical Reflectance Index MODIS Average of Morning & Afternoon Photosynthetic Light Use Efficiency MODIS narrow ocean bands are used over land to monitor stress responses that inhibit carbon uptake in Canadian forest ecosystems. This study highlights the additional value of off-nadir directional reflectance observations along with the pairing of morning and afternoon satellite observations to improve retrievals of photosynthetic light use efficiency. Earth Sciences Division – Hydrospheric and Biospheric Sciences
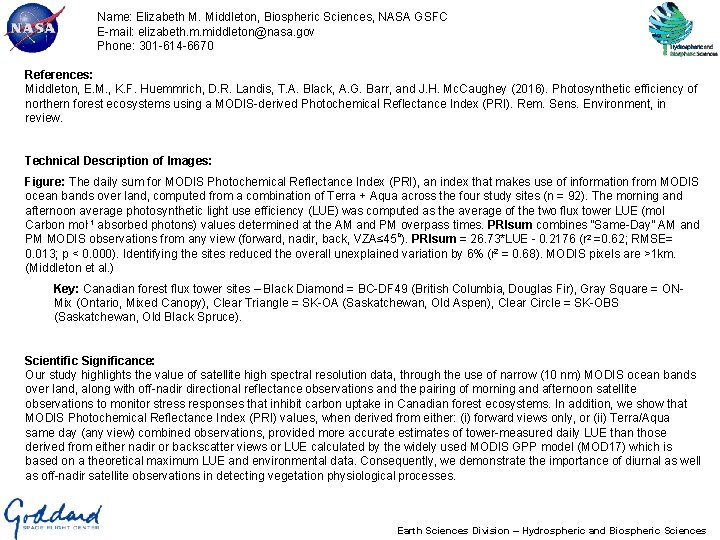
Name: Elizabeth M. Middleton, Biospheric Sciences, NASA GSFC E-mail: elizabeth. m. middleton@nasa. gov Phone: 301 -614 -6670 References: Middleton, E. M. , K. F. Huemmrich, D. R. Landis, T. A. Black, A. G. Barr, and J. H. Mc. Caughey (2016). Photosynthetic efficiency of northern forest ecosystems using a MODIS-derived Photochemical Reflectance Index (PRI). Rem. Sens. Environment, in review. Technical Description of Images: Figure: The daily sum for MODIS Photochemical Reflectance Index (PRI), an index that makes use of information from MODIS ocean bands over land, computed from a combination of Terra + Aqua across the four study sites (n = 92). The morning and afternoon average photosynthetic light use efficiency (LUE) was computed as the average of the two flux tower LUE (mol Carbon mol-1 absorbed photons) values determined at the AM and PM overpass times. PRIsum combines “Same-Day” AM and PM MODIS observations from any view (forward, nadir, back, VZA≤ 45 o). PRIsum = 26. 73*LUE - 0. 2176 (r 2 =0. 62; RMSE= 0. 013; p < 0. 000). Identifying the sites reduced the overall unexplained variation by 6% (r 2 = 0. 68). MODIS pixels are >1 km. (Middleton et al. ) Key: Canadian forest flux tower sites – Black Diamond = BC-DF 49 (British Columbia, Douglas Fir), Gray Square = ONMix (Ontario, Mixed Canopy), Clear Triangle = SK-OA (Saskatchewan, Old Aspen), Clear Circle = SK-OBS (Saskatchewan, Old Black Spruce). Scientific Significance: Our study highlights the value of satellite high spectral resolution data, through the use of narrow (10 nm) MODIS ocean bands over land, along with off-nadir directional reflectance observations and the pairing of morning and afternoon satellite observations to monitor stress responses that inhibit carbon uptake in Canadian forest ecosystems. In addition, we show that MODIS Photochemical Reflectance Index (PRI) values, when derived from either: (i) forward views only, or (ii) Terra/Aqua same day (any view) combined observations, provided more accurate estimates of tower-measured daily LUE than those derived from either nadir or backscatter views or LUE calculated by the widely used MODIS GPP model (MOD 17) which is based on a theoretical maximum LUE and environmental data. Consequently, we demonstrate the importance of diurnal as well as off-nadir satellite observations in detecting vegetation physiological processes. Earth Sciences Division – Hydrospheric and Biospheric Sciences
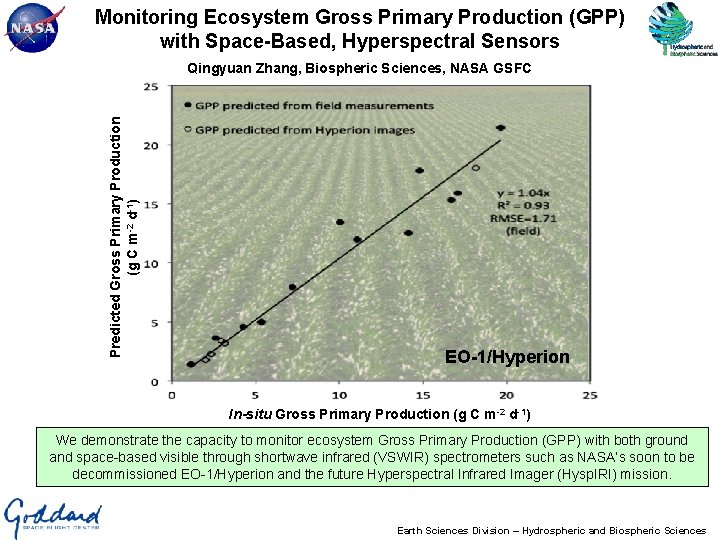
Monitoring Ecosystem Gross Primary Production (GPP) with Space-Based, Hyperspectral Sensors Predicted Gross Primary Production (g C m-2 d-1) Qingyuan Zhang, Biospheric Sciences, NASA GSFC EO-1/Hyperion In-situ Gross Primary Production (g C m-2 d-1) We demonstrate the capacity to monitor ecosystem Gross Primary Production (GPP) with both ground and space-based visible through shortwave infrared (VSWIR) spectrometers such as NASA’s soon to be decommissioned EO-1/Hyperion and the future Hyperspectral Infrared Imager (Hysp. IRI) mission. Earth Sciences Division – Hydrospheric and Biospheric Sciences
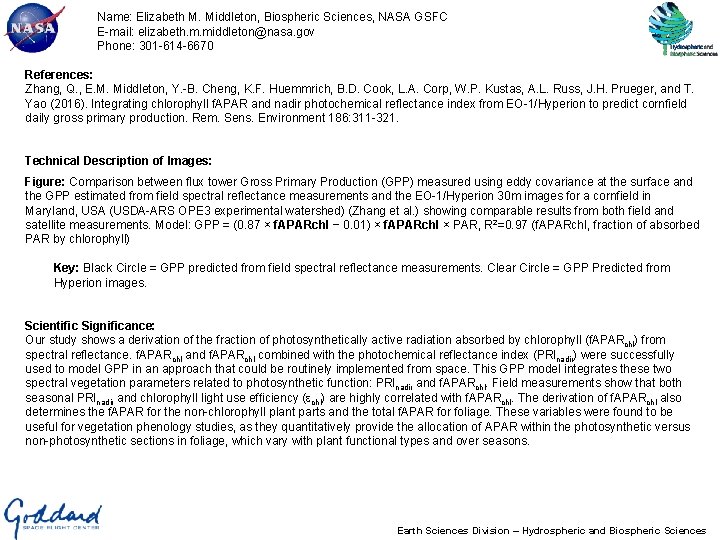
Name: Elizabeth M. Middleton, Biospheric Sciences, NASA GSFC E-mail: elizabeth. m. middleton@nasa. gov Phone: 301 -614 -6670 References: Zhang, Q. , E. M. Middleton, Y. -B. Cheng, K. F. Huemmrich, B. D. Cook, L. A. Corp, W. P. Kustas, A. L. Russ, J. H. Prueger, and T. Yao (2016). Integrating chlorophyll f. APAR and nadir photochemical reflectance index from EO-1/Hyperion to predict cornfield daily gross primary production. Rem. Sens. Environment 186: 311 -321. Technical Description of Images: Figure: Comparison between flux tower Gross Primary Production (GPP) measured using eddy covariance at the surface and the GPP estimated from field spectral reflectance measurements and the EO-1/Hyperion 30 m images for a cornfield in Maryland, USA (USDA-ARS OPE 3 experimental watershed) (Zhang et al. ) showing comparable results from both field and satellite measurements. Model: GPP = (0. 87 × f. APARchl − 0. 01) × f. APARchl × PAR, R 2=0. 97 (f. APARchl, fraction of absorbed PAR by chlorophyll) Key: Black Circle = GPP predicted from field spectral reflectance measurements. Clear Circle = GPP Predicted from Hyperion images. Scientific Significance: Our study shows a derivation of the fraction of photosynthetically active radiation absorbed by chlorophyll (f. APARchl) from spectral reflectance. f. APARchl and f. APARchl combined with the photochemical reflectance index (PRInadir) were successfully used to model GPP in an approach that could be routinely implemented from space. This GPP model integrates these two spectral vegetation parameters related to photosynthetic function: PRInadir and f. APARchl. Field measurements show that both seasonal PRInadir and chlorophyll light use efficiency (echl) are highly correlated with f. APARchl. The derivation of f. APARchl also determines the f. APAR for the non-chlorophyll plant parts and the total f. APAR for foliage. These variables were found to be useful for vegetation phenology studies, as they quantitatively provide the allocation of APAR within the photosynthetic versus non-photosynthetic sections in foliage, which vary with plant functional types and over seasons. Earth Sciences Division – Hydrospheric and Biospheric Sciences