Ibn Sina National College for Medical Studies Medical
 Assessment Result Histogram")
Ibn Sina National College for Medical Studies Medical Education Unit (MEU) Assessment Result Histogram Program: ……… Course Name: ……… Course Coordinator: ………

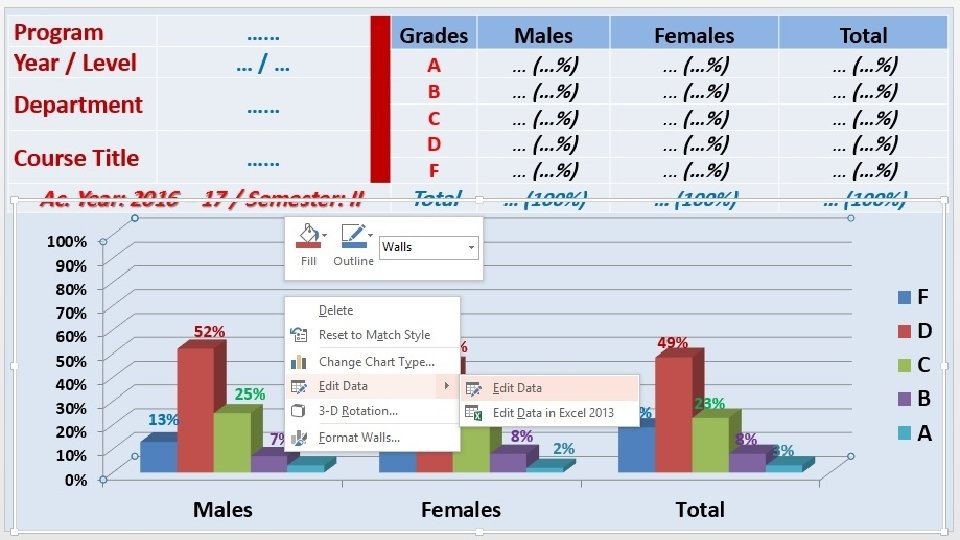
Program Year / Level …… …/… Department …… Course Title …… Ac. Year: 2016 – 17 / Semester: II 100% 90% 80% 70% 60% 50% 40% 30% 20% 10% 0% Grades Males Females Total A B C D F … (…%) … (…%) … (…%) … (100%) … (…%) … (…%) … (100%) Total F 52% 25% 13% 7% Males D 49% 45% 20% 8% 3% Females 19% C 23% 8% 2% Total B 3% A

Comments and Analysis In one or more slides, comment on the histogram for males, females and average (e. g. , normal distribution, right skewness, left skewness …) and analyze the possible reasons and actions taken/will be taken for correction.

Instructions on Completing your Course Statistics Histogram In the first slide there are 3 components: 1. Course Data: Complete the details of your course first (program, department, and course title). 2. Table of Grades: Fill it in with the accurate numbers and percentages of grades of your course. 3. Histogram (Chart): a. After you fill-in the table with the numbers specific to your course, right-click anywhere on the chart area. A dialog box will appear (see next slide). Choose “Edit Data…”.

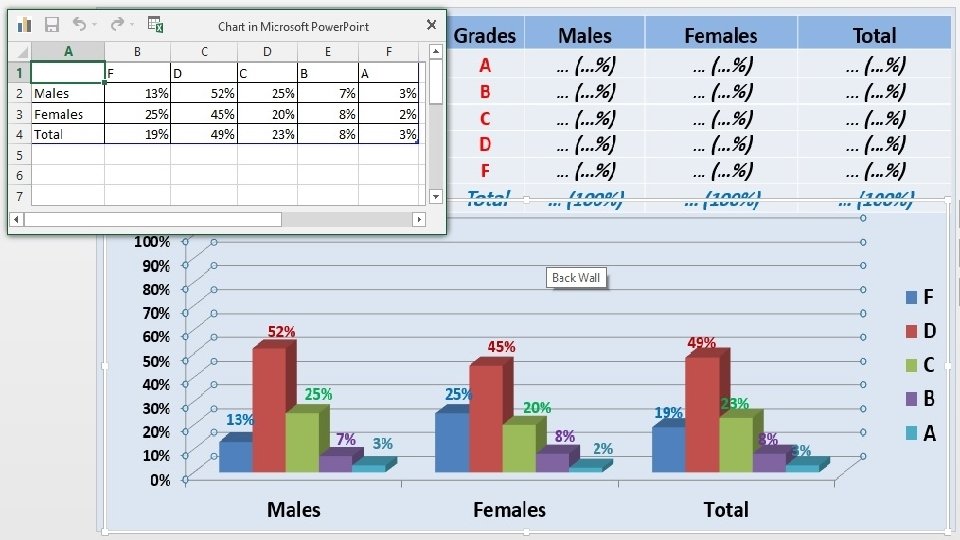
Cont’d: b. A Microsoft Excel page will appear that contains a simple table containing the grades and the percentages (see next slide). c. Change the numbers with your course’s real percentages (percentage of students in A, in B, in C, and so on). The histogram will automatically change accordingly. d. Close the Excel page and save your work. e. Complete the “Comments and Analysis” slide(s). f. Rename your file to “Program_Year_Course_Academic Year” (for example: “MBBS_6_Surgery_2016”) and submit it to doctorhani 2000@yahoo. com.
- Slides: 7