IBL 381 METODOLOGI PENELITIAN 12 Quantitative Research Method
")
IBL 381 METODOLOGI PENELITIAN 12. Quantitative Research Method (Part 2: Data Processing and Interpreting) Radisti A. Praptiwi, ST. M. Sc. Ph. D

Introduction • Dalam penelitian, informasi yang didapatkan melalui pengambilan data merupakan informasi sampel dari target populasi. Informasi ini belum dapat menunjukkan apapun. Untuk mengambil kesimpulan dari target populasi tersebut, data kuantitatif yang diambil harus melalui proses analisa – statistik. • Statistik memiliki peran penting dalam membantu peneliti memahami hubungan antar variabel – terutama jika dalam pengambilan data didapatkan lebih dari 2 variabel. • Bergantung dari pengalamannya, seorang peniliti dapat melihat hubungan antara dua variabel tanpa melakukan analisa statistik, tetapi peneliti yang sudah berpengalaman sekalipun akan sulit untuk “mengukur” kuatnya sebuah hubungan. • Statistik dapat membantu memberikan informasi tepat mengenai kekuatan hubungan antar variabel. Analisa yang diberikan melalui statistik dapat (i) mengkonfirmasi atau mengkontradiksi informasi yang didapatkan, (ii) mengindikasikan kekuatan hubungan antar variabel, dan (iii) memperkuat kesimpulan yang dapat diambil dari hasil analisa. • Dalam kasus terdapatnya lebih dari 2 variabel, analisa statistic dapat membantu memahami keterkaitan antara variabel-vaeriabel tersebut, dan kontribusi masing variabel terhadap sebuah fenomena yang diteliti.

Drawing a conclusion from statistical analysis All statistical inferences are based on three primary entities: • the population (U) that is of interest, • the set of characteristics (variables) of the units of this population (V), and • the probability distribution (P) of these characteristics in the population.
 • The population is a collection of units of observation that are")
Population (U) • The population is a collection of units of observation that are of interest, and is the target of the investigation. For example, in determining the effectiveness of a particular drug for a disease, the population would consist of all possible patients with this disease. • It is essential, in any research study, to identify the population clearly and precisely. • The success of the investigation will depend to a large extent on the identification of the population of interest. • Often, the population of interest is not observable, and a smaller population is identified as the subject of investigation.
 • Once the population is identified, we should clearly define what characteristics")
Variables (V) • Once the population is identified, we should clearly define what characteristics of the units of this population (subjects of the study) we are planning to investigate. • Clear and precise definitions and methods for measuring these characteristics (a simple observation, a laboratory measurement, questionnaire) are essential for the success of the research study.
 • The variables are characterized in many ways; for statistical considerations, the")
Variables (V) • The variables are characterized in many ways; for statistical considerations, the variables are usually classified as discrete or continuous. • Discrete variables are those in which only a small number of values is possible (e. g. sex: male, female), incidence of a disease (yes, no)). • Continuous variables are those which, theoretically, can take any value within a specified range of minimum and maximum value (e. g. age, blood pressure).
 • The most crucial link between the population and its characteristics,")
Probability Distribution (P) • The most crucial link between the population and its characteristics, which allows us to draw inferences on the population based on sample observations, depends on this probability distribution. • The probability distribution is a way to enumerate the different values the variable can have, and how frequently each value appears in the population. The actual frequency distribution is approximated to a theoretical curve that is used as the probability distribution.
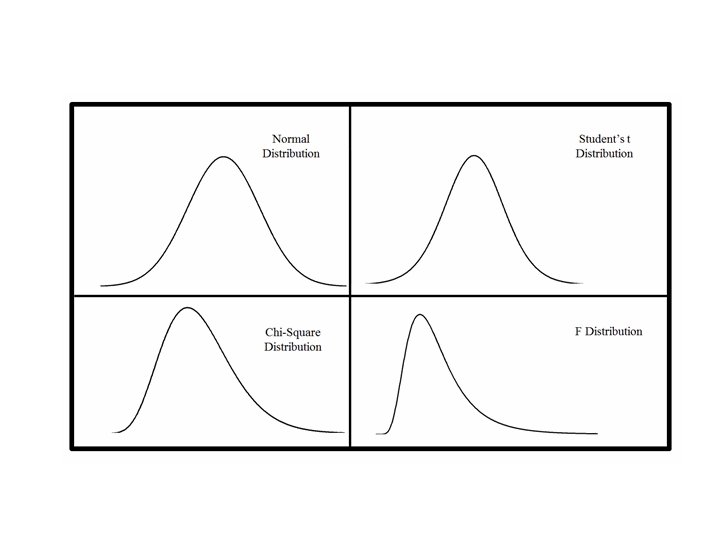
 • Common examples of probability distributions are the binomial, Poisson and")
Probability Distribution (P) • Common examples of probability distributions are the binomial, Poisson and normal. • For example, the incidence of a relatively common illness may be approximated by a binomial distribution, • whereas the incidence of a rare condition (e. g. number of deaths from motor vehicle accidents) may be considered to have a Poisson distribution. • Distributions of continuous variables (blood pressure, heart rate) are often considered to be normally distributed.

Summary of Basic Statistical Analysis The researcher will have to use either descriptive statistics or inferential statistics for the purpose of the analysis. 1. The descriptive statistics (i. e. stats used to describe the characteristic of the gathered data) may be on any of the following forms: (a) Measures of Central Tendency (b) Measures of Variability (c) Measures of Relationship
 Measures of Central Tendency: These measures")
Summary of Basic Statistical Analysis Descriptive statistics (a) Measures of Central Tendency: These measures are mean, median (b) Measures of Variability: These measures are range, mean deviation, quartile deviation and standard deviation. In social statistics the first two measures are rarely. The use of standard deviation is very frequently made for thepurpose of analysis. (c) Measures of Relationship: There measures are Co-efficient of Correlation, partial correlation and multiple correlations.

Summary of Basic Statistical Analysis The inferential statistics (used to infer something about the population from the sample) may be in any one of the following forms: (a) Significance of Difference between Means: It is used to determine whether a true difference exists between population means of two samples. (b) Analysis of Variance: The Z or t tests are used to determine whethere was any significant difference between the means of two random samples
 Chi Square Test: It is used to estimate")
Summary of Basic Statistical Analysis (c) Chi Square Test: It is used to estimate the like hood that some factor other than chance accounts to the observed relationship. (d) Regression Analysis: For calculating the probability of occurrence of any phenomenon or for predicting the phenomenon or relationship between different variables. Other more ‘advanced’ statistical analysis, such as hypothesis testing and ANOVA also exist. These should be applied according to the data collected, the purpose of the study and the formulated hypotheses so as to generate inputs for pertinent interpretation of the study results.

Association vs Causation • An association is said to exist between two variables when a change in one variable parallels or coincides with a change in another. This is also called ‘covariation’ or ‘correlation’. • An association is said to be causal when it can be proved that a change in the independent variable produces (induces, results in, leads to, determines or causes) a change in the dependent variable. • A variable may be independent in one hypothesis, a dependent in another. Take for instance, ‘hypertension’ in the simplified example below: o Hypertension (independent) causes coronary heart disease Independent o Salt intake causes hypertension (Dependent)

Measuring an association One measure of association is the correlation between two variables. This can be expressed graphically in a correlation or scatter diagram. The relationship can be expressed in terms of a correlation coefficient. The correlation coefficient varies between +1 and -1. r (correlation coefficient) Degree of association • • • ± 1. 0 Perfect ± 0. 7 to ± 1. 0 Strong ± 0. 4 to ± 0. 7 Moderate ± 0. 2 to ± 0. 4 Weak ± 0. 01 to ± 0. 2 Negligible 0. 0 No association
 to")
Steps in establishing causality The requirements for making a causal inference aim (i) to exclude a non-causal association, and (ii) to ascertain the likelihood of a causal association. The requirements are given below: 1. The association actually exists and is statistically meaningful. This requires that: the association is not due to chance (e. g. tested by using the Chi-Square test) 2. The association is not spurious (i. e. not due to bias). Spurious association can be of three types: due to selection bias, due to information or measurement bias.
. The stronger the association,")
Steps in establishing causality 3. The association is strong (strength). The stronger the association, the higher the likelihood of a causal relationship. 4. The association follows a time sequence (temporality). It goes without saying that the cause must precede the condition or effect. 5. The association is plausible. there should be some theoretical basis explaining the association. 6. The association is consistent. Causality is more likely when the association is supported by other investigations conducted by different persons in different places, circumstances and time-frames, and using different research designs

Interpretation of Data • Interpretation means an adequate exposition of the true meaning of the data obtained analysed in terms of the purposes of the study. • The following are the main purposes of interpretation of data or results; (i) To throw light on the real significance of the data in the wider context. (ii) To understand implications of the data. (iii) To provide hints of conclusions and recommendations for the researcher. (iv) To refer to important generalization.

Interpretation of Data The researcher should keep the following factors in consideration in interpretation of data; (i) Not to ignore those possible existing variables which are unstudied. For example if a comparison has been made between the traditional method of teaching and any modern method of teaching in respect of effectiveness of teaching, the interpretation that successful attainment is the result of method of teaching only is complete denial of the role of general mental ability, high achievement motivation and better study habits etc.
 Not to ignore the relative size of sample to the")
Interpretation of Data (ii) Not to ignore the relative size of sample to the population For instance, when the subjects are generally so large that the researcher collects the data from a selected group only. The researcher should remember that some factors which have not been included in selective group are equally important in their impact upon findings. For example, if the researcher collects data from a particular school in a particular area and then he should remind that the conclusion he infers might not apply to all the existing schools
- Slides: 20