
IAT 355 Time Feb 9 2017 SCHOOL OF
IAT 355 Time ___________________________________________ Feb 9, 2017 SCHOOL OF INTERACTIVE ARTS + TECHNOLOGY [SIAT] | WWW. SIAT. SFU. CA IAT 355 1
Time Series Data • Fundamental chronological component to the data set • Random sample of 4000 graphics from 15 of world’s newspapers and magazines from ’ 74 -’ 80 found that 75% of graphics published were time series – Tufte, Vol 1 Feb 9, 2017 IAT 355 2
Data Sets • Each data case is likely an event of some kind • One of the variables can be the date and time of the event • Ex: sunspot activity, hockey games, medicines taken, cities visited, stock prices, etc. Feb 9, 2017 IAT 355 3
Meta Level • Consider multiple stocks being examined • Is each stock a data case, or is a price on a particular day a case, with the stock name as one of the other variables? • Conflation of data entity with data cases Feb 9, 2017 IAT 355 4
Data Mining • Data mining domain has techniques for algorithmically examining time series data, looking for patterns, etc. • Good when objective is known a priori • But what if not? – Which questions should I be asking? – Info. Vis better for that Feb 9, 2017 IAT 355 5
Time Series Tasks • Examples – When was something greatest/least? – Is there a pattern? – Are two series similar? – Do any of the series match a pattern? – Provide simple, fast access to the series Feb 9, 2017 IAT 355 6
More Time Tasks • • Does data element exist at time t ? When does a data element exist? How long does a data element exist? How often does a data element occur? How fast are data elements changing? In what order do data elements appear? Do data elements exist together? » Muller & Schumann 03, citing Mac. Eachern ‘ 95 Feb 9, 2017 IAT 355 7
Taxonomy • • Discrete points vs. interval points Linear time vs. cyclic time Ordinal time vs. continuous time Ordered time vs. branching time vs. time with multiple perspectives » Muller & Schumann ’ 03 citing Frank ‘ 98 Feb 9, 2017 IAT 355 8
Fundamental Tradeoff • Is the visualization time-dependent, ie, changing over time (beyond just being interactive) – Static • Shows history, multiple perspectives, allows comparison – Dynamic (animation) • Gives feel for process & changes over time, has more space to work with Feb 9, 2017 IAT 355 9
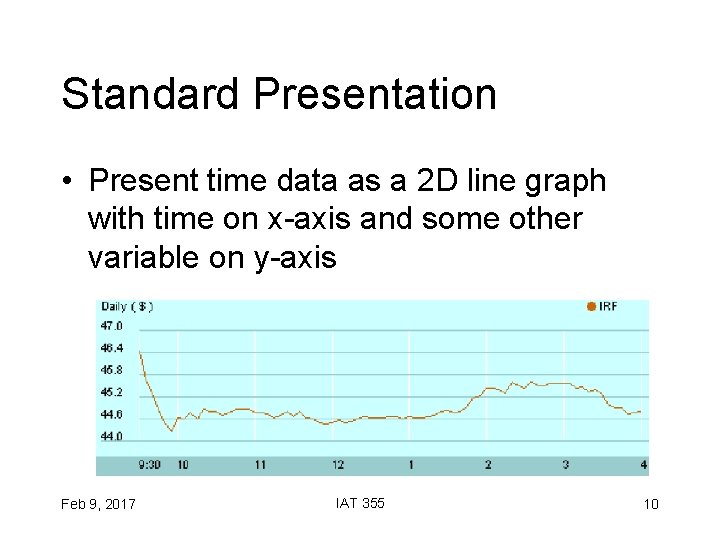
Standard Presentation • Present time data as a 2 D line graph with time on x-axis and some other variable on y-axis Feb 9, 2017 IAT 355 10

Feb 9, 2017 IAT 355 11
Today’s Focus • Examination of a number of case studies • Learn from some of the different visualization ideas that have been created • Can you generalize these techniques into classes or categories? Feb 9, 2017 IAT 355 12
Example 1 • Calendar visualization • Present series of events in context of calendar • Tasks – See commonly available times for group of people – Show both details and broader context Feb 9, 2017 IAT 355 13
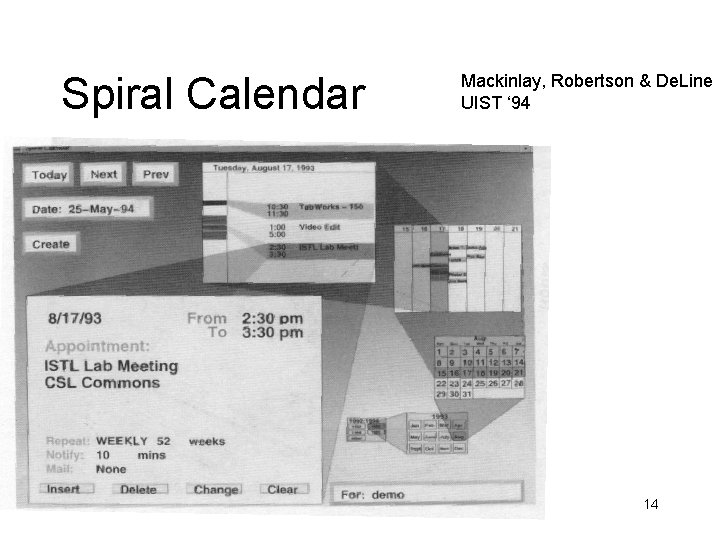
Spiral Calendar Feb 9, 2017 IAT 355 Mackinlay, Robertson & De. Line UIST ‘ 94 14
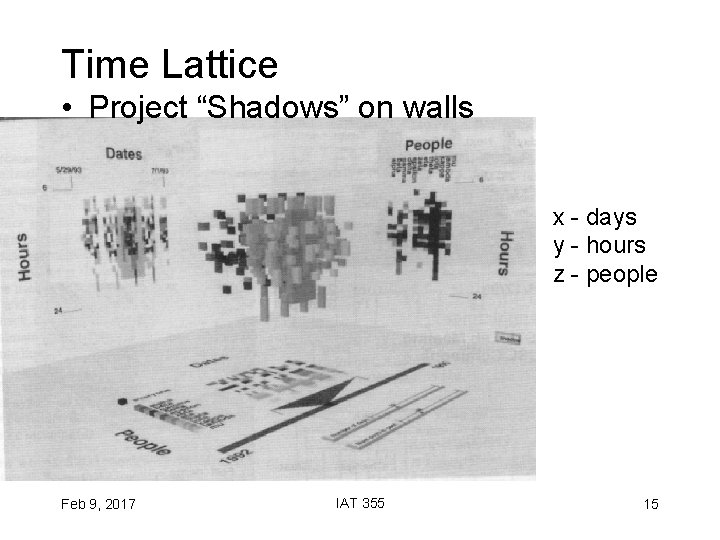
Time Lattice • Project “Shadows” on walls x - days y - hours z - people Feb 9, 2017 IAT 355 15
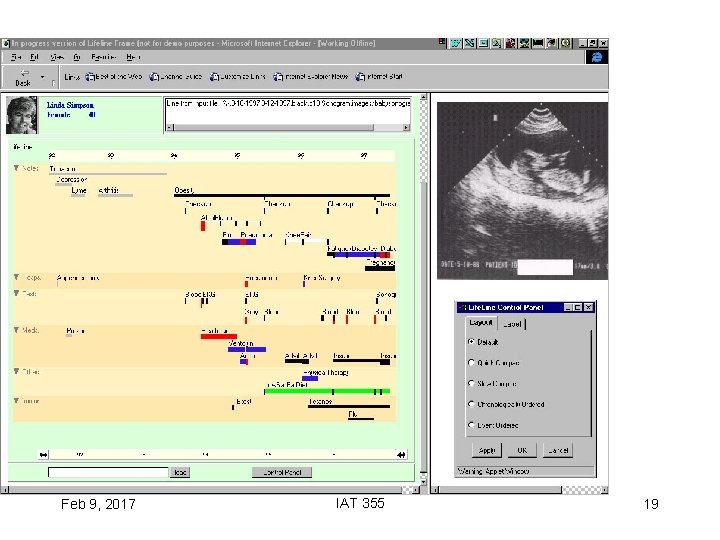
Example 2 • Personal histories – Consider a chronological series of events in someone’s life – Present an overview of the events • Examples – Medical history – Educational background – Criminal history Feb 9, 2017 IAT 355 16
Tasks • • Put together complete story Garner information for decision-making Notice trends Gain an overview of the events to grasp the big picture Feb 9, 2017 IAT 355 17
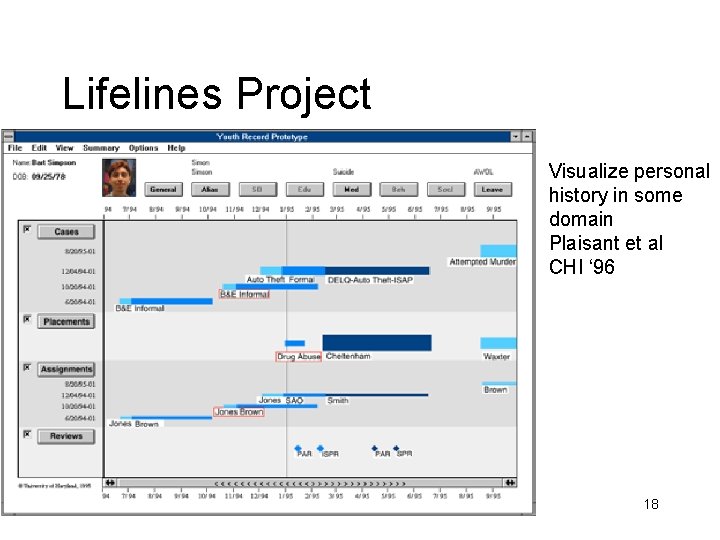
Lifelines Project Visualize personal history in some domain Plaisant et al CHI ‘ 96 Feb 9, 2017 IAT 355 18
Feb 9, 2017 IAT 355 19
Lifelines Features • Different colors for different event types • Line thickness can correspond to another variable • Interaction: Clicking on an event produces more details • Certainly could also incorporate some dynamic query capabilities Feb 9, 2017 IAT 355 20
Benefits + Challenges • Benefits – – Reduce chances of missing information Facilitate spotting trends or anomalies Streamline access to details Remain simple and tailorable to various applications • Challenges – Scalability – Can multiple records be visualized in parallel well? Feb 9, 2017 IAT 355 21
Example 3 • People’s presence/movements in some space – Eg. Halo 2 average health on a level • Situation: – Workers punch in and punch out of a factory – Want to understand the presence patterns over a calendar year Feb 9, 2017 IAT 355 22
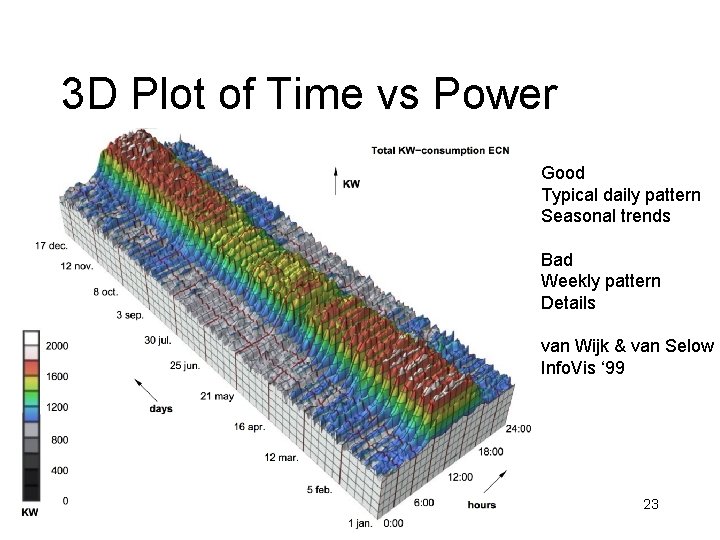
3 D Plot of Time vs Power Good Typical daily pattern Seasonal trends Bad Weekly pattern Details van Wijk & van Selow Info. Vis ‘ 99 Feb 9, 2017 IAT 355 23
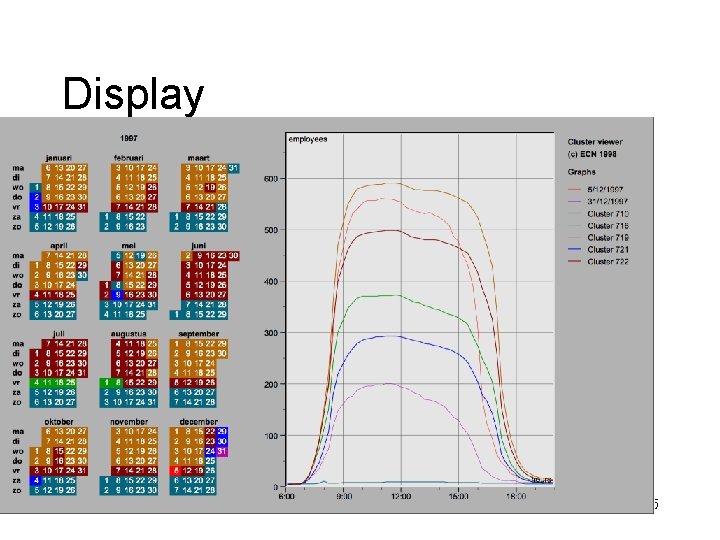
Another Approach • Cluster analysis – Find two most similar days, make into one new composite – Keep repeating until some preset number left or some condition met • How can this be visualized? Feb 9, 2017 IAT 355 24
Display Feb 9, 2017 IAT 355 25
Interaction • Click on day, see its graph • Select a day, see similar ones • Add/remove clusters Feb 9, 2017 IAT 355 26
Insights • • • Traditional office hours followed Most employees present in late morning Fewer people are present on summer Fridays Just a few people work holidays When were the holidays – School vacations occurred May 3 -11, Oct 11 -19, Dec 21 - 31 • Many people take off day after holiday • Many people leave at 4 pm on December 5 Feb 9, 2017 IAT 355 27
Example 4 • Consider a set of speeches or documents over time • Can you represent the flow of ideas and concepts in such a collection? Feb 9, 2017 IAT 355 28
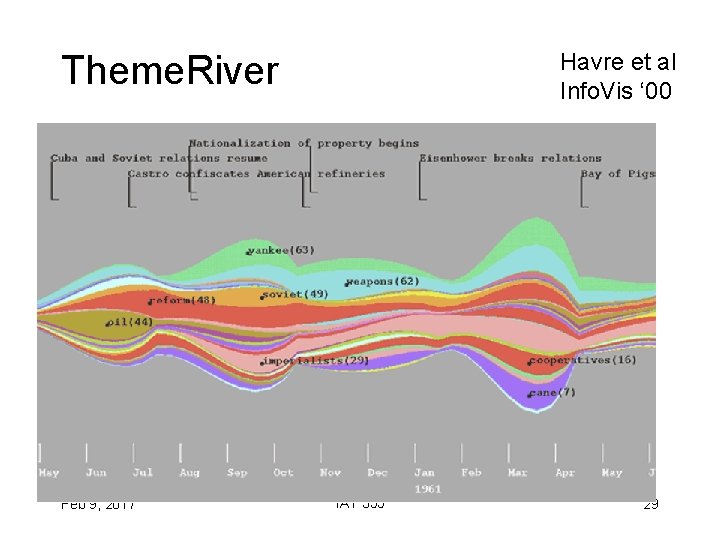
Theme. River Feb 9, 2017 Havre et al Info. Vis ‘ 00 IAT 355 29
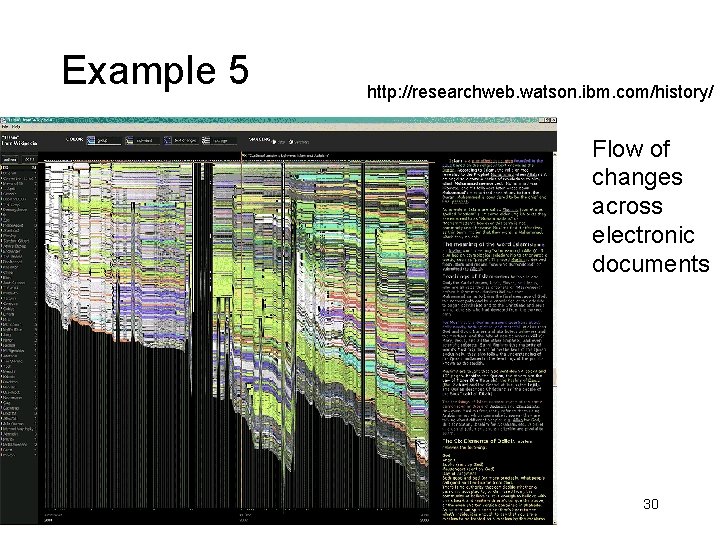
Example 5 http: //researchweb. watson. ibm. com/history/ Flow of changes across electronic documents Feb 9, 2017 IAT 355 30
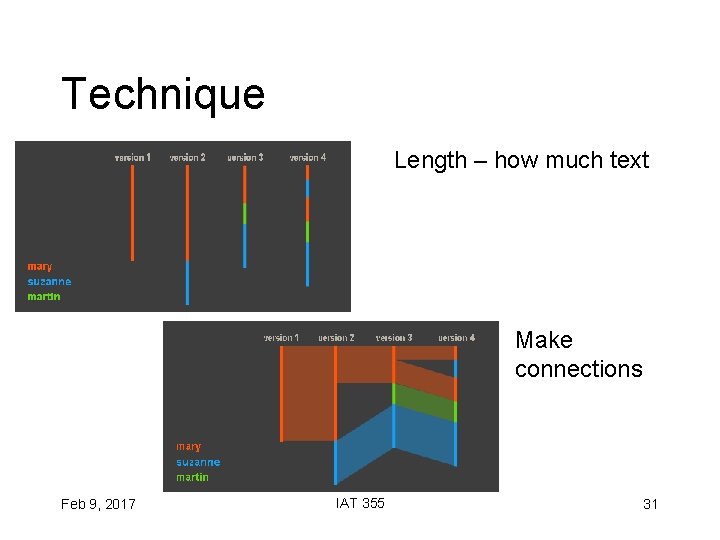
Technique Length – how much text Make connections Feb 9, 2017 IAT 355 31
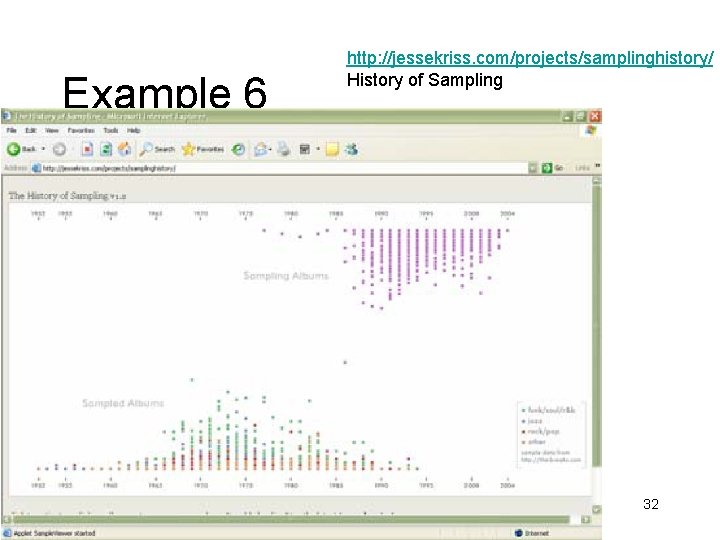
Example 6 Feb 9, 2017 http: //jessekriss. com/projects/samplinghistory/ History of Sampling IAT 355 32
Interaction • Note key role interaction plays in previous example • Common theme in time-series visualization Feb 9, 2017 IAT 355 33
Example 7 • Computer system logs • Potentially huge amount of data – Tedious to examine the text • Looking for unusual circumstances, patterns, etc. • Mie. Log – System to help computer systems administrators examine log files – Interesting characteristics – Takada & Koike LISA ‘ 02 Feb 9, 2017 IAT 355 34
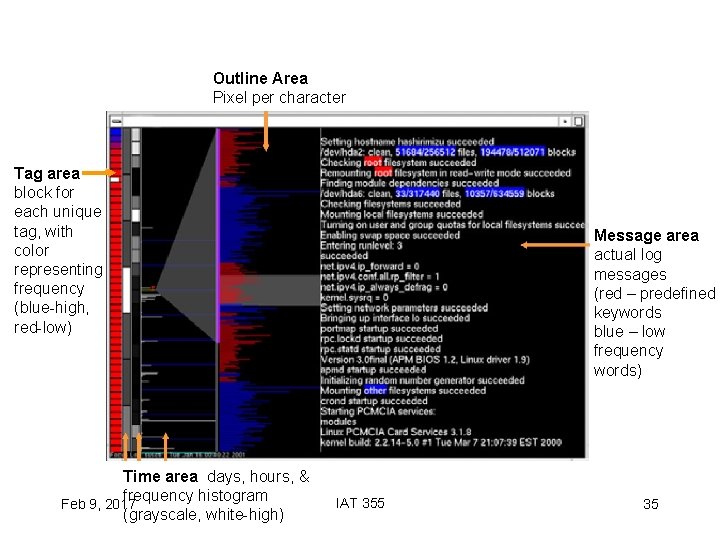
Outline Area Pixel per character Tag area block for each unique tag, with color representing frequency (blue-high, red-low) Time area days, hours, & frequency histogram Feb 9, 2017 (grayscale, white-high) Message area actual log messages (red – predefined keywords blue – low frequency words) IAT 355 35
Interactions • Tag area – Click on tag shows only those messages • Time area – Click on tiles to show those times – Can put line on histogram to filter on values above/below • Outline area – Can filter based on message length – Just highlight messages to show them in text • Message area – Can filter on specific words Feb 9, 2017 IAT 355 36
Example 8 • Time. Finder • Dynamically query elements in the display • Create query rectangles that highlight items passing through them Feb 9, 2017 IAT 355 37
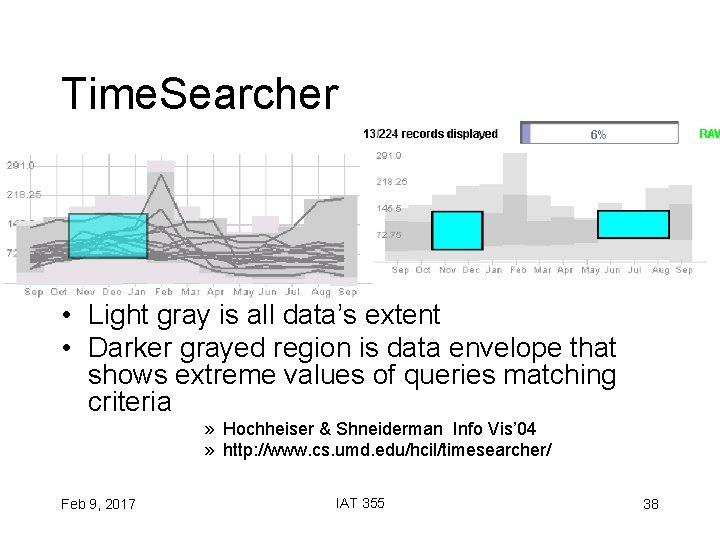
Time. Searcher • Light gray is all data’s extent • Darker grayed region is data envelope that shows extreme values of queries matching criteria » Hochheiser & Shneiderman Info Vis’ 04 » http: //www. cs. umd. edu/hcil/timesearcher/ Feb 9, 2017 IAT 355 38
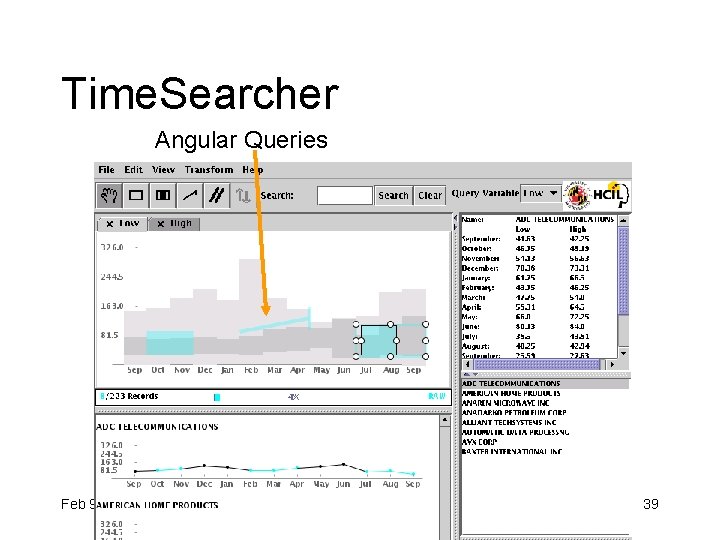
Time. Searcher Angular Queries Feb 9, 2017 IAT 355 39
Serial Periodic Data • Data that exhibits both serial and periodic properties • Time continues serially, but weeks, months, and years are periods that recur • Two types – Pure serial periodic data – Event-anchored serial periodic data Feb 9, 2017 IAT 355 40
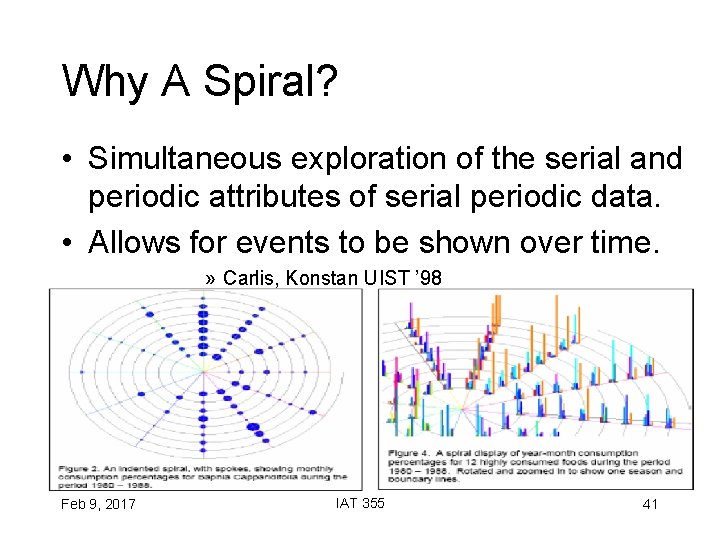
Why A Spiral? • Simultaneous exploration of the serial and periodic attributes of serial periodic data. • Allows for events to be shown over time. » Carlis, Konstan UIST ’ 98 Feb 9, 2017 IAT 355 41
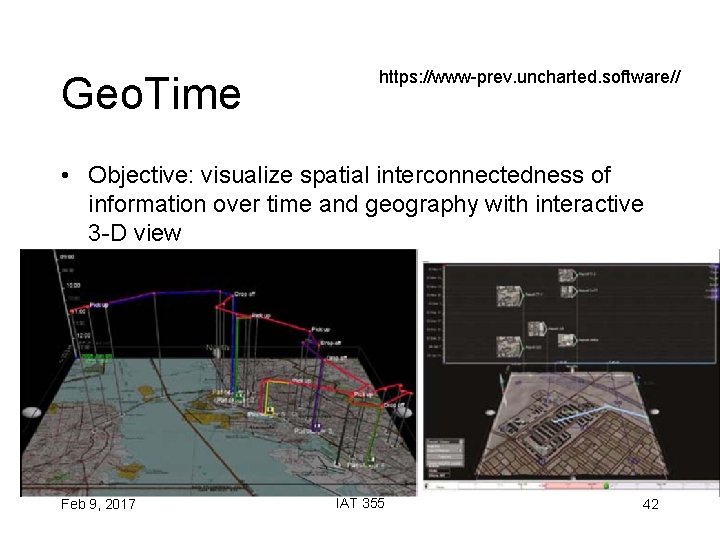
Geo. Time https: //www-prev. uncharted. software// • Objective: visualize spatial interconnectedness of information over time and geography with interactive 3 -D view Feb 9, 2017 IAT 355 42
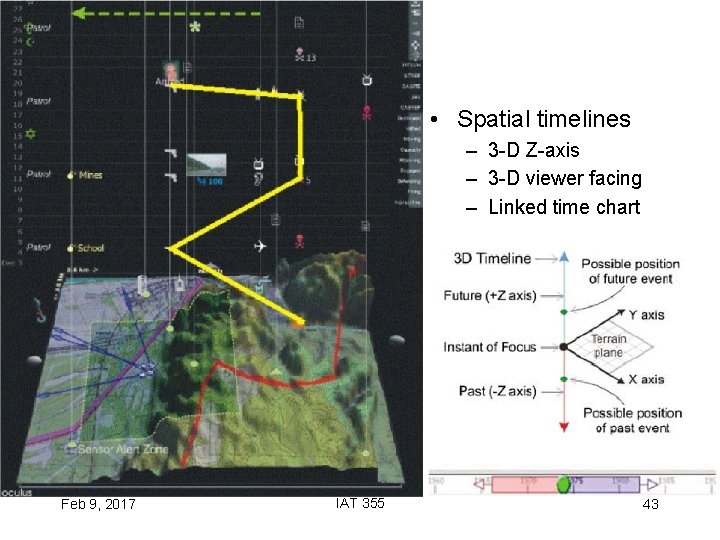
• Spatial timelines – 3 -D Z-axis – 3 -D viewer facing – Linked time chart Feb 9, 2017 IAT 355 43
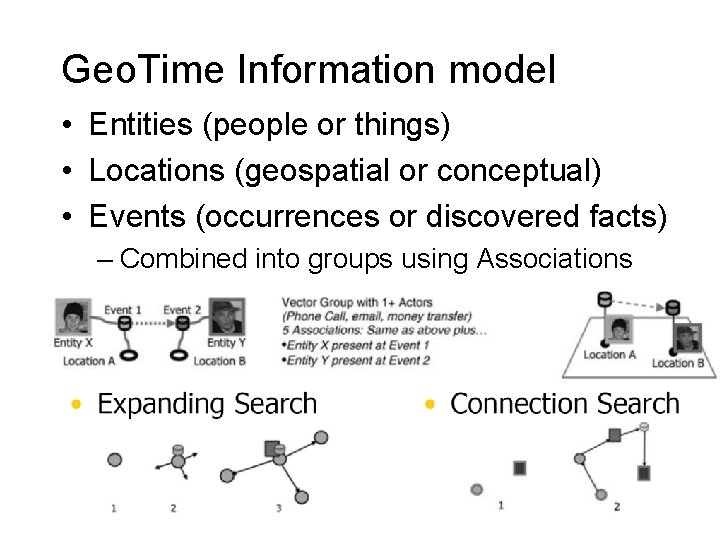
Geo. Time Information model • Entities (people or things) • Locations (geospatial or conceptual) • Events (occurrences or discovered facts) – Combined into groups using Associations Feb 9, 2017 IAT 355 44
Thanks • John Stasko, Georgia Tech Feb 9, 2017 IAT 355 45
- Slides: 45