I have no conflicts of interest to declare


- Slides: 22

I have no conflicts of interest to declare

Center for Global Health Division of Global HIV and TB High Uptake of Antiretroviral Therapy among HIV-Positive TB Patients Receiving Co-Located Services in Swaziland Ishani Pathmanathan, 1, 2 Munyaradzi Pasipamire, 3 Sherri Pals, 1 E. Kainne Dokubo, 1 Peter Preko, 5 Trong Ao, 5 Sikhathele Mazibuko, 3 Janet Ongole, 4 Themba Dhlamini, 6 Samson Haumba 4 1 Division of Global HIV and TB, United States Centers for Disease Control and Prevention, Atlanta, Georgia, USA 2 Epidemic Intelligence Service, United States Centers for Disease Control and Prevention, Atlanta, Georgia, USA 3 Swaziland National AIDS Programme, Ministry of Health, Mbabane, Swaziland 4 University Research Co. , LLC, Mbabane, Swaziland 5 Division of Global HIV and TB, United States Centers for Disease Control and Prevention, Swaziland 6 Swaziland National TB Control Program, Ministry of Health, Manzini, Swaziland The findings and conclusions in this presentation are those of the authors and do not necessarily represent the views of the Centers for Disease Control and Prevention (CDC)

Swaziland § Highest adult HIV prevalence 1 – 29% for adult aged 15– 49 – 220, 000 people living with HIV (PLHIV) § 3 rd highest TB incidence rate 2 – 565 cases per 100, 000 § Highest TB/HIV coinfection – 72% TB patients HIV-positive 1. UNAIDS, 2016. Swaziland: HIV and AIDS Estimates (2015); 2. WHO Global TB Report 2016; Map: swazilandhappenings. co. za

Background § Over the last decade, the Swaziland Ministry of Health and partners have adopted an integrated and co-located model for TB/HIV service delivery § As of 20141 – 97% notified TB patients knew HIV status – 79% notified HIV+ TB patients started ART – High TB mortality among co-infected patients (135 deaths per 100, 000 vs 51/100, 000 among HIV-negative population) 1. WHO Global TB Report 2015

Background § Swaziland adopted 2012 WHO TB/HIV policy recommendations 1 § Study Objective: To evaluate the timeliness of ART initiation relative to TB treatment for HIV-positive TB patients in Swaziland 1. WHO, 2012. WHO Policy on Collaborative TB/HIV Activities.

Methods § Setting: 11 care and treatment facilities – Purposefully selected to represent all 4 regions and public facility types (clinic, health center, hospital) – Provided both TB and HIV services and operational ≥ 1 year § Population: HIV-positive TB patients identified from TB registers – ≥ 15 years and seen between July 1–Sept 30, 2014 – If not documented in TB registers or treatment cards, HIV status determined from HIV program registers – Clinical history retrospectively assessed until TB treatment outcome (cure, treatment completion, treatment failure, default, death, transfer out)

Methods § Data analysis – Descriptive statistics to describe patient demographic information, clinical characteristics and timing of ART after TB treatment initiation – Logistic regression (adjusted for within-clinic correlation) to identify predictors of timely ART § “Timely ART” was defined in this study as – Within 8 weeks – Within 2 weeks of TB treatment initiation if CD 4 <50/µL or missing (assuming possibly <50/µL)

Results Demographic and Clinical Characteristics of the HIV+ TB Patients § 466 HIV+ TB patients – 240 male (52%), 225 female (48%) – Median age 36 (IQR 31– 43) for men, 32 (IQR 27– 40) for women – Facility type: 35% clinic, 24% health center, 41% hospital § Median CD 4 at TB treatment initiation 137/µL (IQR 58– 268) – Missing for 24% of patients

Results Timing of ART Uptake for 466 HIV+ TB Patients § 189 (41%) already on ART § 2 (0. 4%) never started ART § 1 (0. 2%) did not have timing of ART documented § 274 (59%) started ART after TB treatment initiation – Only 5 (1. 8%) did not receive ART within 6 months – Median time to ART was 15 days (IQR 14– 28)

Results Timing of ART after TB Treatment Initiation, by CD 4 Count (n=274) ART within 2 weeks ART within 2 -8 weeks ART between 8 weeks-6 months ART after 6 months 120% 100% 5 4 23 9 ART within 2 -8 weeks 80% 134 60% 38 40% 20% 112 ART within 2 weeks 26 7 5 1 2 89. 8% of the 274 patients started ART within 8 weeks of TB treatment initiation 20 25 21 CD 4 <50 CD 4 Missing 25 51 40 0% Total CD 4 >200 CD 4 50 -200

Results Timing of ART after TB Treatment Initiation, by CD 4 Count (n=274) ART within 2 weeks ART within 2 -8 weeks ART between 8 weeks-6 months ART after 6 months 120% 100% 5 23 4 9 7 5 1 2 80% 134 60% 25 38 51 40% 20% 112 88. 6% of those with a CD 4 ≥ 50/µL started ART within 8 weeks of TB treatment initiation 26 40 20 25 21 CD 4 <50 CD 4 Missing 0% Total CD 4 >200 CD 4 50 -200

Results Timing of ART after TB Treatment Initiation, by CD 4 Count (n=274) ART within 2 weeks ART within 2 -8 weeks ART between 8 weeks-6 months ART after 6 months 120% 100% 5 23 4 9 7 5 1 2 80% 134 60% 25 38 51 40% 20% 112 26 40 25 0% Total CD 4 >200 20 CD 4 50 -200 CD 4 <50 Only 45. 5% of those with a CD 4 <50/µL started ART within 2 weeks 21 CD 4 Missing

Results Timing of ART after TB Treatment Initiation, by CD 4 Count (n=274) ART within 2 weeks ART within 2 -8 weeks ART between 8 weeks-6 months ART after 6 months 120% 100% 5 23 4 9 7 5 1 2 80% 134 60% 25 38 20 51 40% 20% 112 26 40 25 21 CD 4 <50 CD 4 Missing 0% Total CD 4 >200 CD 4 50 -200

Results Predictors of Timely ART Uptake for 466 HIV+ TB Patients § Higher CD 4 associated with better odds of receiving timely ART – Recall: guideline-based criteria for “timely ART” differed by baseline CD 4 Variable CD 4, TB Treatment Start <50/µL 50 -200/µL >200/µL Missing N (%)* OR (95% CI) p-value AOR (95% CI) p-value 25 (45. 5) 91 (89. 2) 64 (87. 7) 21 (47. 7) ref 9. 93 (3. 75, 26. 28) 8. 53 (3. 91, 18. 63) 1. 10 (0. 48, 2. 49) <. 0001 ref 11. 32 (4. 98, 25. 77) 10. 38 (4. 89, 22. 03) 1. 15 (0. 40, 3. 29) <. 0001 *N (%) = number and proportion of patients receiving timely ART, defined as within 8 weeks if CD 4 ≥ 50/µL or within 2 weeks if CD 4 <50/µL or missing § Timeliness of ART not significantly associated with: gender, age, facility or patient type, disease site and missed appointments

Results Adverse Events among HIV+ TB Patients § Adverse events while on TB and HIV treatment – Mostly peripheral neuropathy and skin rash – Too infrequent to draw conclusions about relationship to timing of ART Timing # Adverse Events % 0 3 11 7 2 0 23 0 1. 6 9. 8 5. 2 8. 7 0 4. 9 Never started (n=2) Before TB Tx (n=189) <2 weeks (n=112) 2 -8 weeks (n=134) > 8 wks-6 mo (n=23) >6 months (n=5) TOTAL (n=465*) *1 of the 466 patients had missing timing of ART § No switches in ART regimen reported while on TB treatment

Results TB Outcomes among HIV+ TB Patients § 86% of 274 patients who began ART after TB treatment initiation achieved TB cure or treatment completion – Similar proportion to those who began ART before TB treatment initiation – TB treatment outcomes not significantly associated with timely ART initiation TB Treatment Outcome N % Cured Completed Failure Default Died Transfer Out Missing TOTAL 154 83 7 8 16 5 1 274 56. 2 30. 3 2. 6 2. 9 5. 8 1. 8 0. 4

Discussion Successes § 99% of HIV-positive TB patients on ART by 6 months – Compare with 58– 80% uptake in similarly integrated sub-Saharan African settings (even lower in non-integrated settings)* § 90% initiated ART within 8 weeks; median time 15 days – Compare with 59– 78% and median time 34– 75 days in other settings* – Possible effect of task-shifting and TB/HIV integration efforts *Multiple sources: Owiti P 2015; Patel MR 2014; Kerschberger B, 2012; Tweya H 2014; Pepper DJ 2011; Nglazi MD, 2012; Kanyerere HS, 2012; Lawn SD, 2011; Takarinda KC, 2012; Zachariah R, 2006

Discussion Challenges § ~60% patients with a known CD 4 <50/µL did not receive ART within 2 weeks (timing of ART similar regardless of CD 4 cell count) – Room for improvement § CD 4 not documented at TB treatment initiation in ~25% patients – Consistent with reported reagent stock outs/laboratory shortages

Limitations § Purposeful site-selection § Retrospective chart review § Unable to assess longer-term HIV treatment outcomes

Conclusions § This study shows that very high levels of timely ART uptake for HIVpositive TB patients can be achieved in resource-limited, but integrated settings § Improvements needed to identify and rapidly treat patients with most advanced disease, who are in greatest need for earlier ART

Acknowledgements § Dr. Marianne Calnan § Swaziland Ministry of Health § Dr. Anand Date § Members of the data collection team § Dr. Peter Ehrenkranz § Healthcare providers at the sampled clinics § Rosanna Jeffries § Dr. Kikanda Kindandi § Dr. Arnold Mafukidze § Gugu Mchunu § Dr. Caroline Ryan This research has been supported by the U. S. President’s Emergency Plan for AIDS Relief (PEPFAR) through CDC

For more information, contact CDC 1 -800 -CDC-INFO (232 -4636) TTY: 1 -888 -232 -6348 www. cdc. gov The findings and conclusions in this report are those of the authors and do not necessarily represent the official position of the Centers for Disease Control and Prevention.
 Genius
 I have nothing to declare but my genius
 Conflict with interest
 Most conflicts have their roots in
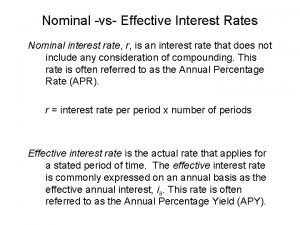
 What is real interest rate and nominal interest rate
 Effective rate
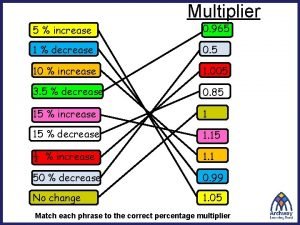
 Compound interest multiplier
 What did the vietminh declare as its main goal?
 Declare a two dimensional array of strings named chessboard
 Declare a struct
 Exec sql begin declare section
 What did the vietminh declare as its main goal
 Strings in c
 Exec sql begin declare section
 Mips dynamic array
 Declare an array alpha of 15 elements of type int.
 Deklarasi variabel adalah
 Declare deptrec is record
 12 edges 6 faces
 Internal conflict literary definition
 Chapter 9 lesson 2 resolving conflicts answer key
 What is the conflict of the lady or the tiger
 Person vs supernatural


