I Chemical Bonding Model of a Buckyball with

I. Chemical Bonding Model of a Buckyball with Potassium Ion

Interaction of H Atoms

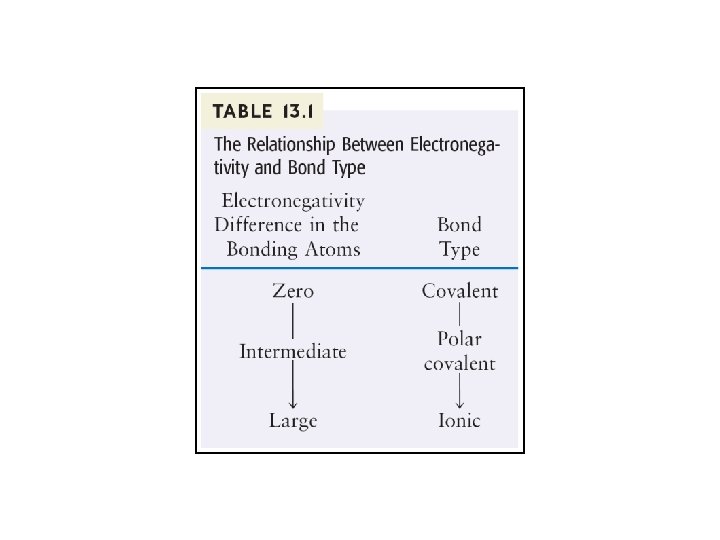
Pauling Electronegativity Values

Dipolar HF Showing Dipole Moment

Electrostatic Potential Map of HF

Charge Distribution in Water Molecule; Electrostatic Potential Diagram of Water

Structure and Charge Distribution of NH 3; Electrostatic Potential Diagram of NH 3

Cancellation of Bond Polarities in CO 2; Electrostatic Potential Diagram for CO 2

Ionic Compound in Solid State

Gas Phase of Ionic Substance

Structure of Li. F

Chemical Bonds • Covalent Bonds § Bonds form between atoms by sharing electrons. § Resulting collection of atoms is called a molecule. Copyright © Cengage Learning. All rights reserved 14

Covalent Bonding Copyright © Cengage Learning. All rights reserved 15

Chemical Bonds • Ionic Bonds § Bonds form due to force of attraction between oppositely charged ions. § Ion – atom or group of atoms that has a net positive or negative charge. § Cation – positive ion; lost electron(s). § Anion – negative ion; gained electron(s). Copyright © Cengage Learning. All rights reserved 16

Molecular vs. Ionic Compounds Copyright © Cengage Learning. All rights reserved 17

Crystals of Sodium Chloride Charles D. Winters #C 5090 D
")
Crystals of Copper II Sulfate (Cu. SO 4)

Structure of Quartz
")
Structure of Ice (Hydrogen Bond)

Electrostatic Diagram Showing Three Possible Types of Bonds

Structures of Ethane and Ethanol

Molecular Structures of Vitamins A and C

Molecular Structure of Vitamin A Frank Cox

Molecular Structure of Vitamin C Frank Cox

Graphite and Diamond #200457884 -001 Credit: Photodisc Red
 1996 Nobel Prize")
Structures of Diamond, Graphite, and Buckyball (C 60) 1996 Nobel Prize
 2010 Nobel Prize")
Graphene (石墨� ) 2010 Nobel Prize

Combination of H 1 s Atomic Orbitals to Form MOs.

MO Energy-Level Diagram for H 2

FIGURE 14. 27: Bonding and Antibonding MOs

MO Energy-Level Diagram for H 2
")
Correct MO Energy-Level Diagram for B 2 (: B: B: )

Apparatus Used to Measure Paramagnetism of a Sample

Diagrams, Bond Orders, Bond Energies, and Bond Lengths for Diatomic Molecules B 2 to F 2

Partial MO Energy-Level Diagram for HF

Electron Probability Distribution in the Bonding MO of HF

Sigma Bonding System in Benzene
 Pi MO System in Benzene, (b) Delocalized Pi MO Over")
FIGURE 14. 50: (a) Pi MO System in Benzene, (b) Delocalized Pi MO Over Entire Ring of C Atoms

Structure of Benzoic Acid
 Tom Pantages")
Members of Halogen Family (X 2) Tom Pantages
 Ken O'Donoghue")
Sulfur Crystals (S 8) Ken O'Donoghue

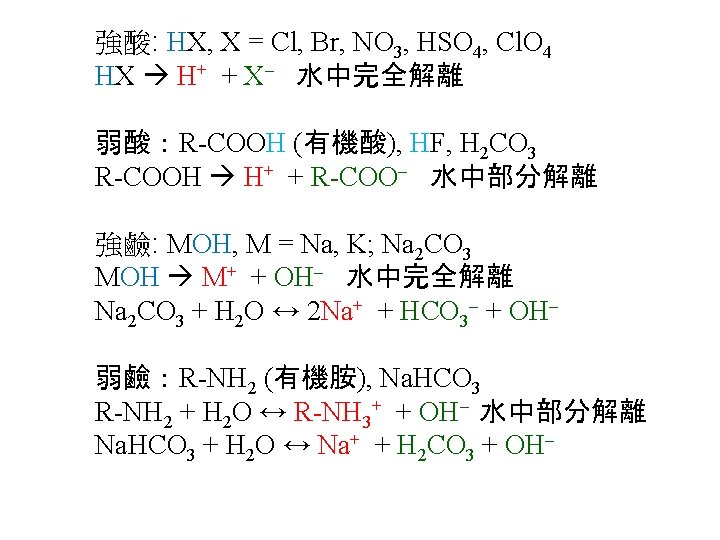
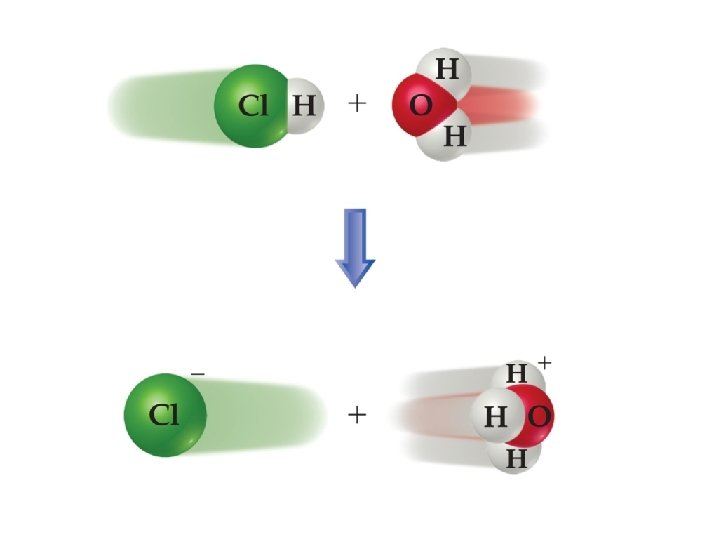
Acids and Bases

Dissociation of Acid in Water
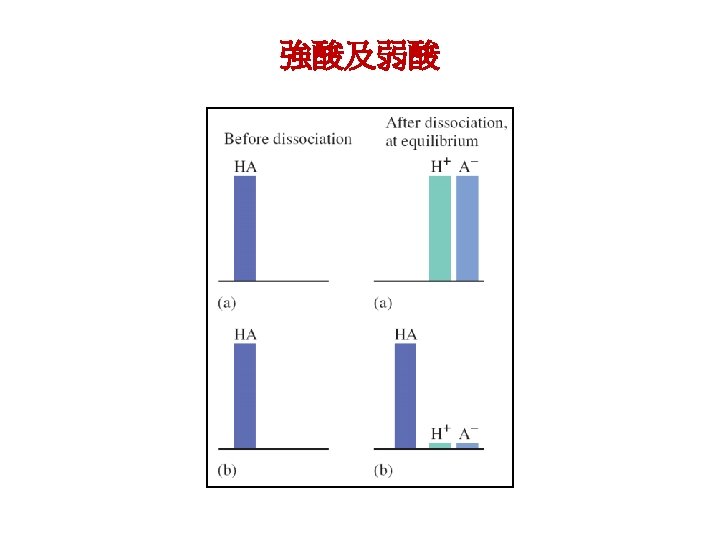

Acid Molecules

Organic Acids: Acetic Acid and Benzoic Acid

How Do We Measure p. H? • For less accurate measurements, one can use – Litmus paper (石蕊試紙) • “Red” paper turns blue above ~p. H = 8 • “Blue” paper turns red below ~p. H = 5 – Or an indicator. � 2009, Prentice-Hall,

How Do We Measure p. H? For more accurate measurements, one uses a p. H meter, which measures the voltage in the solution. � 2009, Prentice-Hall,

Measuring the p. H of Vinegar and Aqueous Ammonia

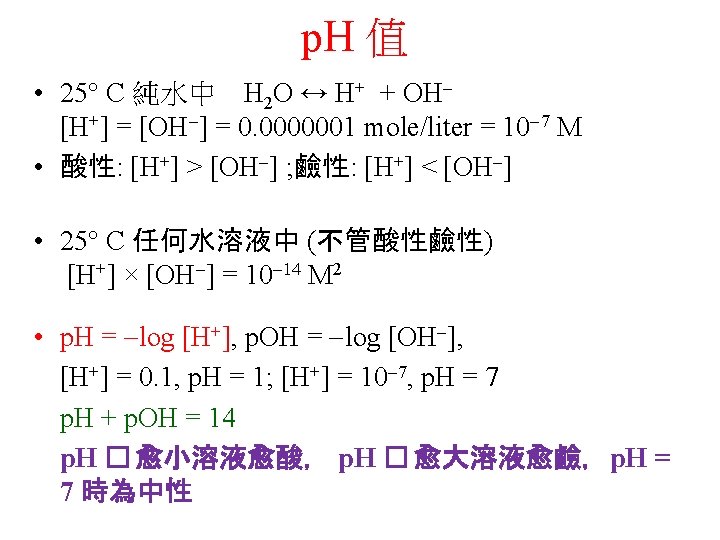
p. H Scale
- Slides: 55