
I Chemical Bonding Model of a Buckyball with

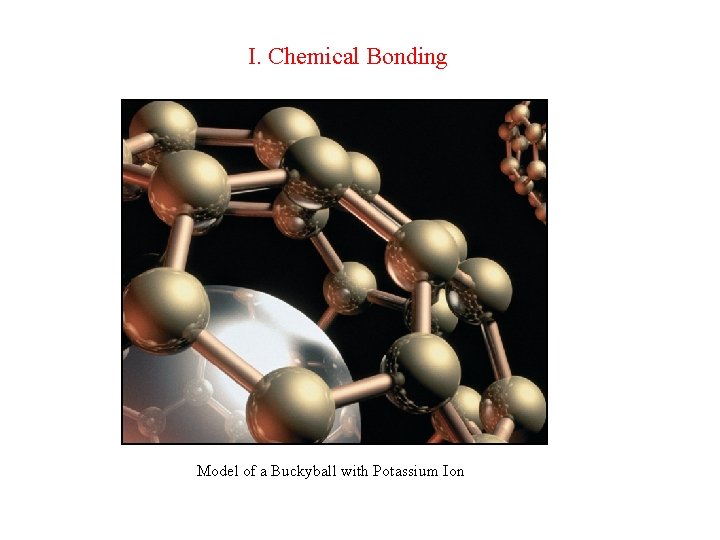
I. Chemical Bonding Model of a Buckyball with Potassium Ion
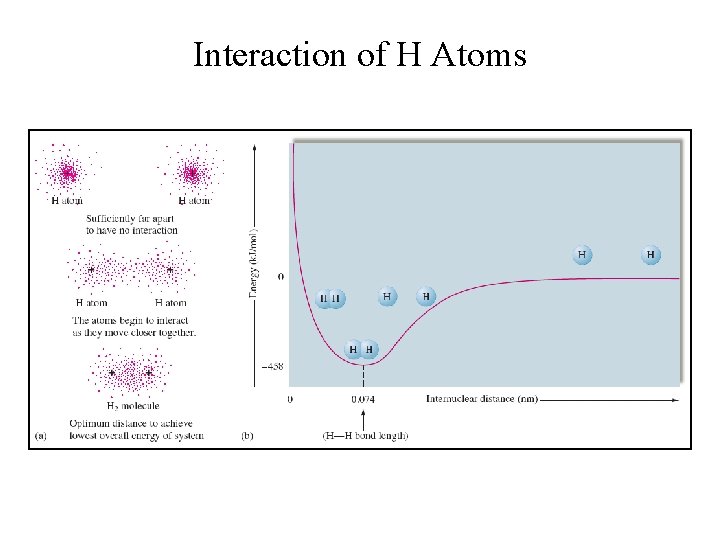
Interaction of H Atoms
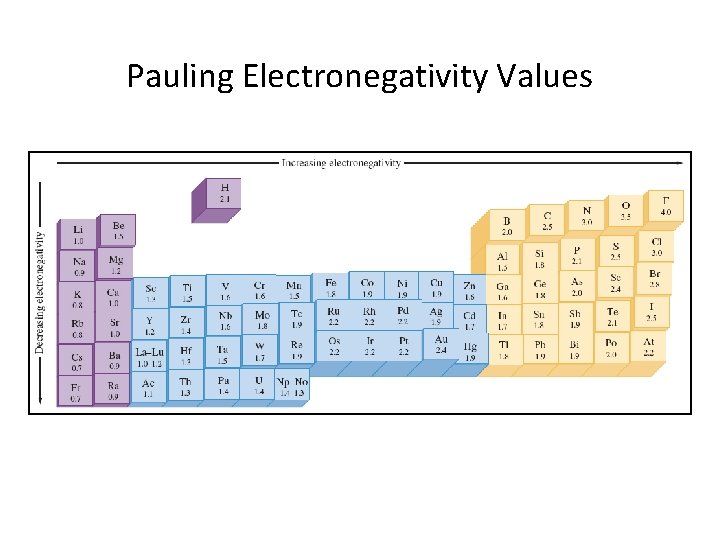
Pauling Electronegativity Values
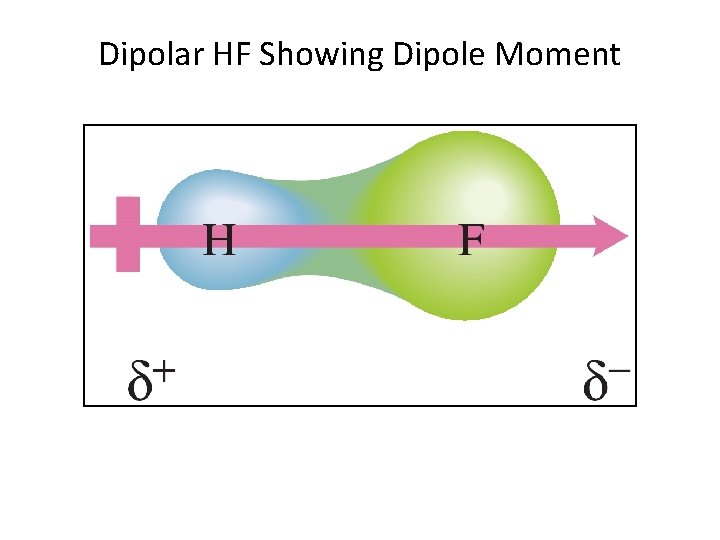
Dipolar HF Showing Dipole Moment
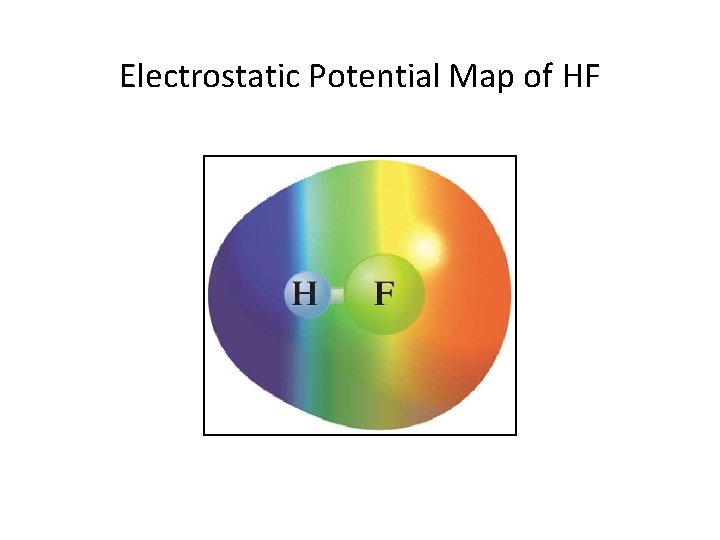
Electrostatic Potential Map of HF
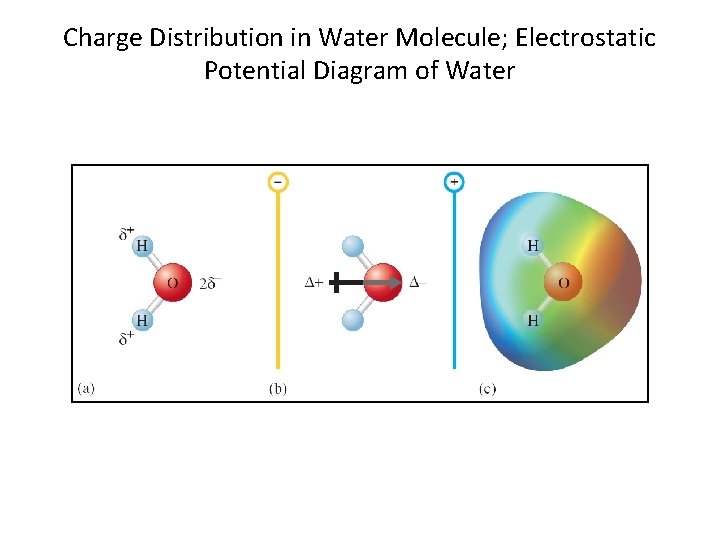
Charge Distribution in Water Molecule; Electrostatic Potential Diagram of Water
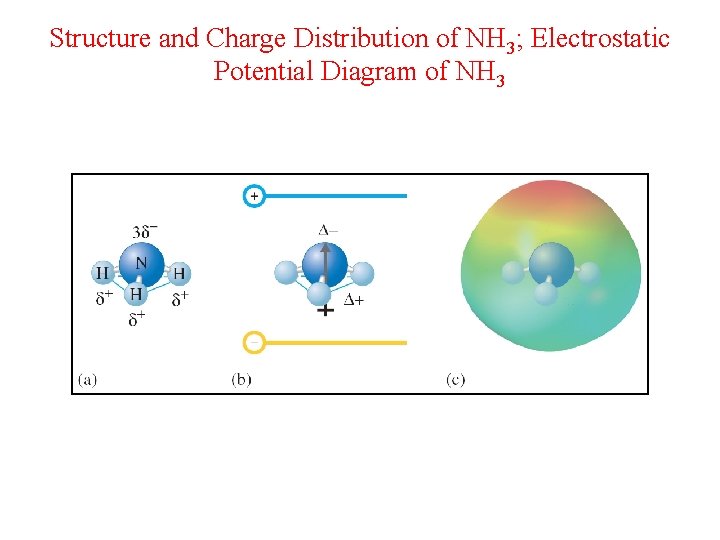
Structure and Charge Distribution of NH 3; Electrostatic Potential Diagram of NH 3
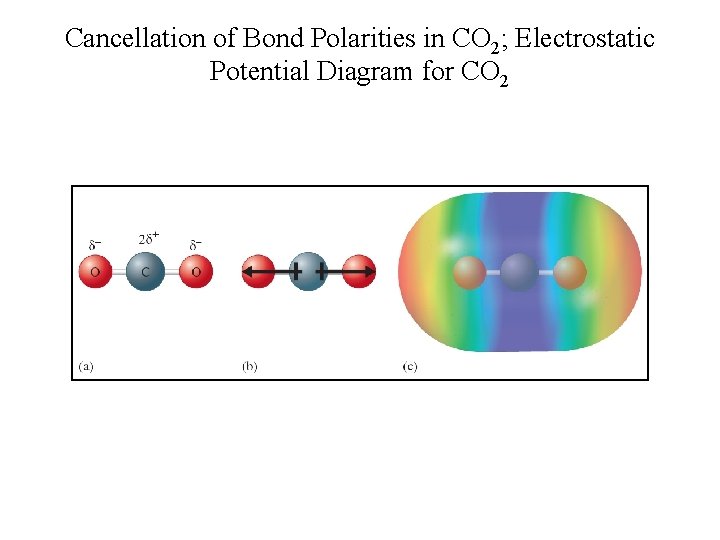
Cancellation of Bond Polarities in CO 2; Electrostatic Potential Diagram for CO 2
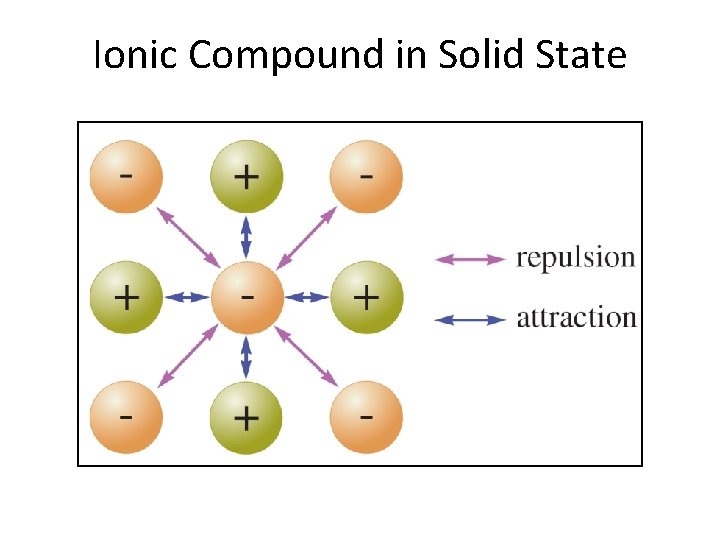
Ionic Compound in Solid State
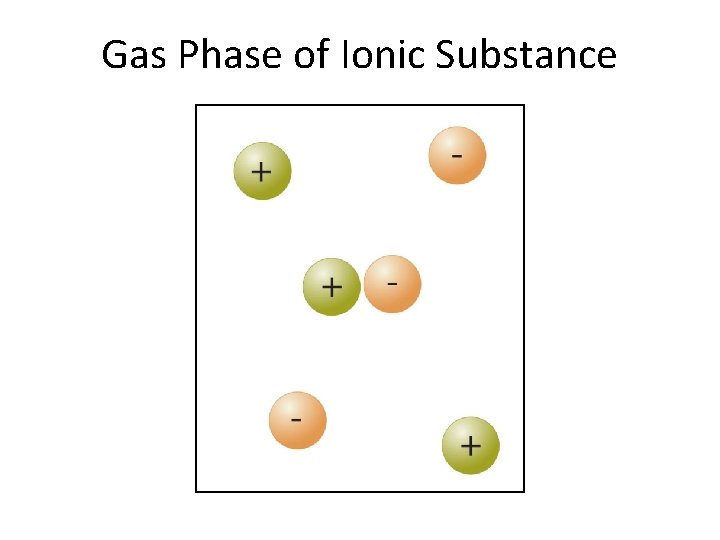
Gas Phase of Ionic Substance
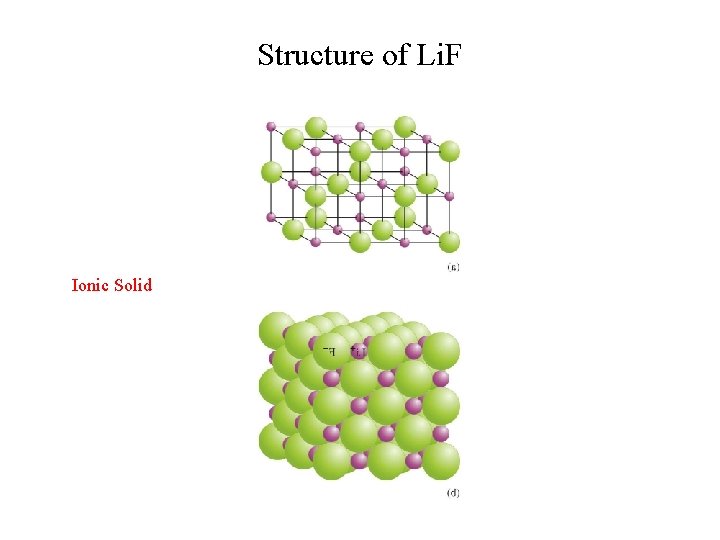
Structure of Li. F Ionic Solid
Chemical Bonds • Covalent Bonds § Bonds form between atoms by sharing electrons. § Resulting collection of atoms is called a molecule. Copyright © Cengage Learning. All rights reserved 14
Covalent Bonding Copyright © Cengage Learning. All rights reserved 15
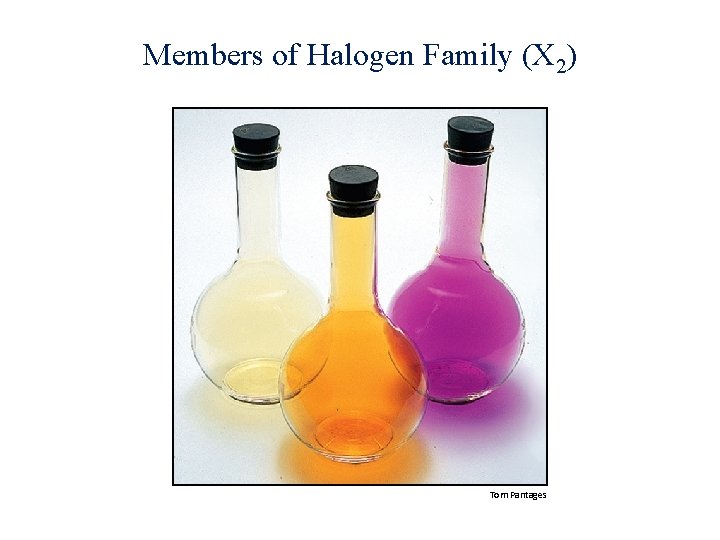
Members of Halogen Family (X 2) Tom Pantages
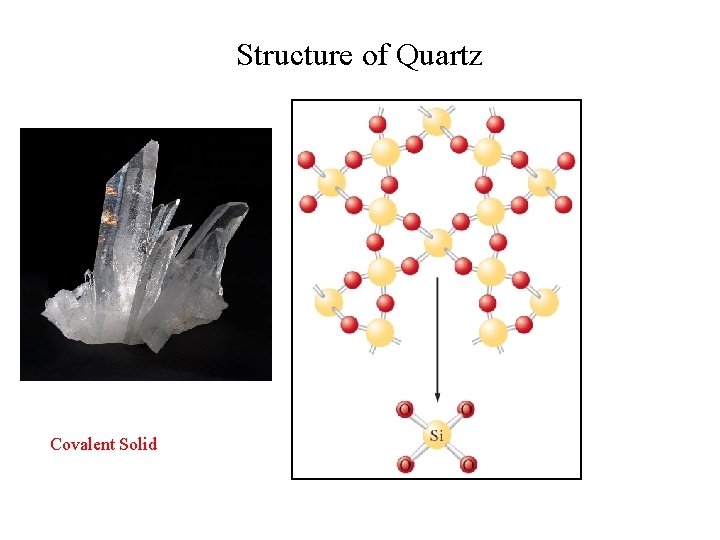
Structure of Quartz Covalent Solid
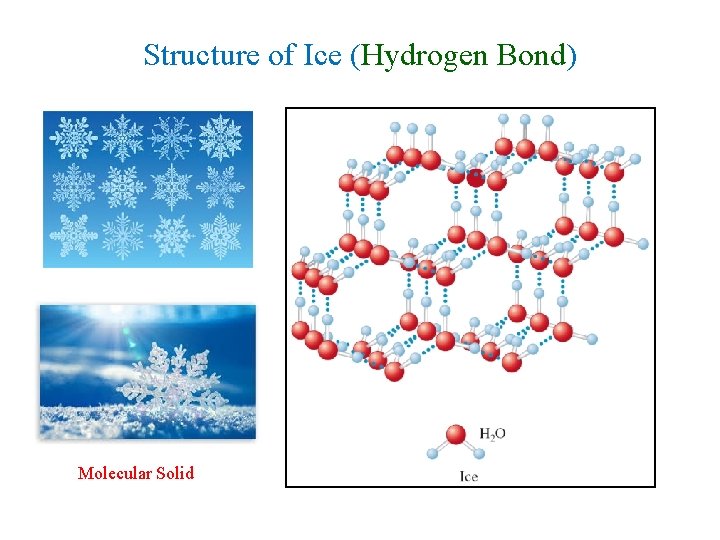
Structure of Ice (Hydrogen Bond) Molecular Solid
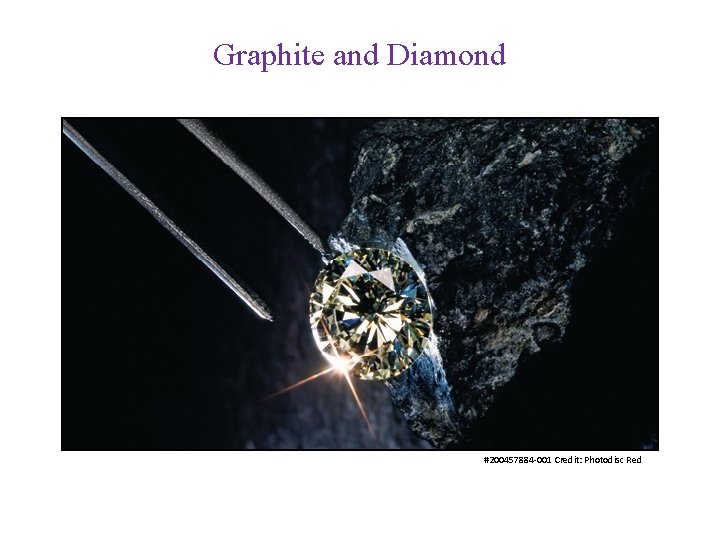
Graphite and Diamond #200457884 -001 Credit: Photodisc Red
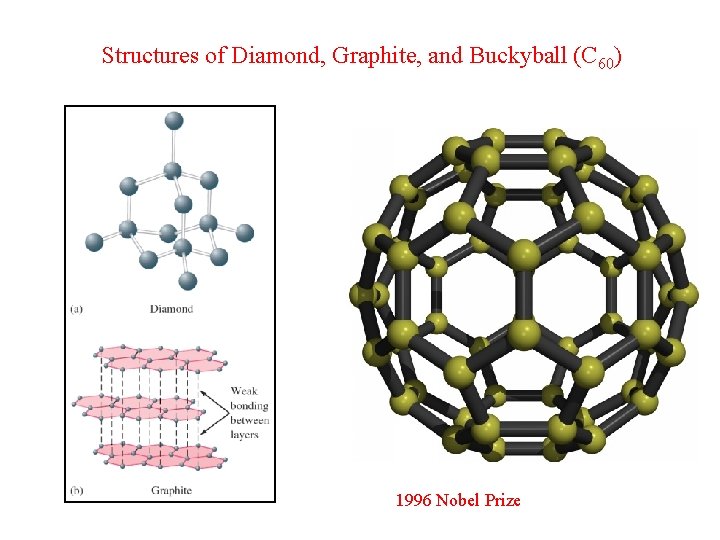
Structures of Diamond, Graphite, and Buckyball (C 60) 1996 Nobel Prize
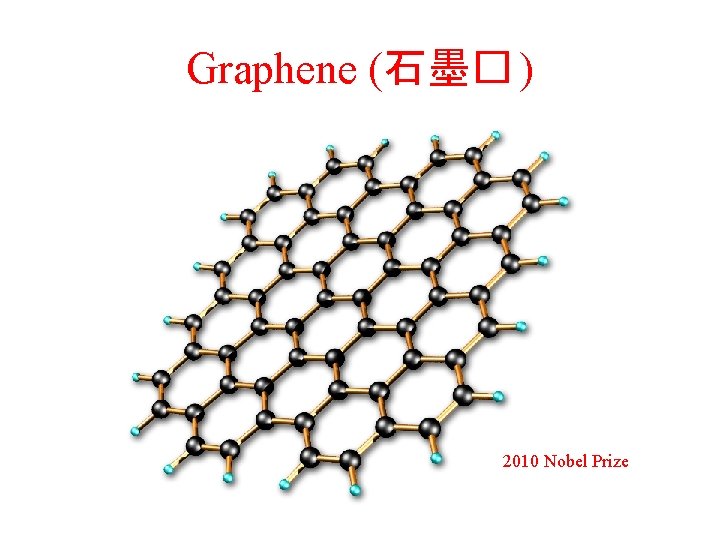
Graphene (石墨� ) 2010 Nobel Prize
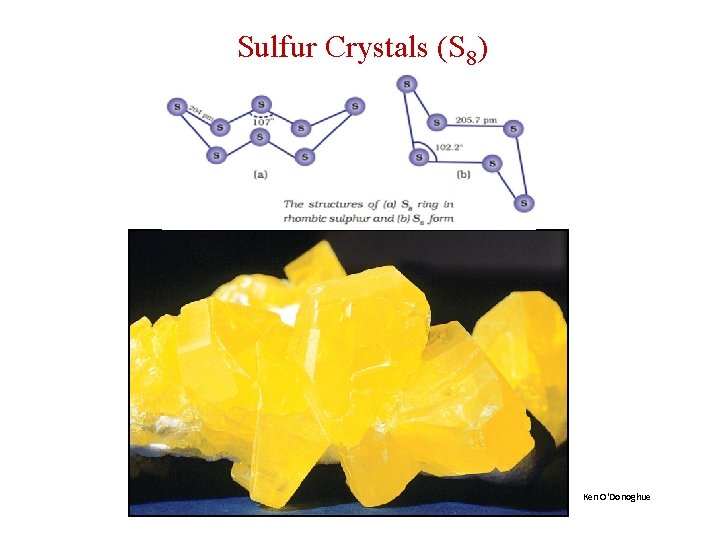
Sulfur Crystals (S 8) Ken O'Donoghue
Chemical Bonds • Ionic Bonds § Bonds form due to force of attraction between oppositely charged ions. § Ion – atom or group of atoms that has a net positive or negative charge. § Cation – positive ion; lost electron(s). § Anion – negative ion; gained electron(s). Copyright © Cengage Learning. All rights reserved 23
Molecular vs. Ionic Compounds Copyright © Cengage Learning. All rights reserved 24
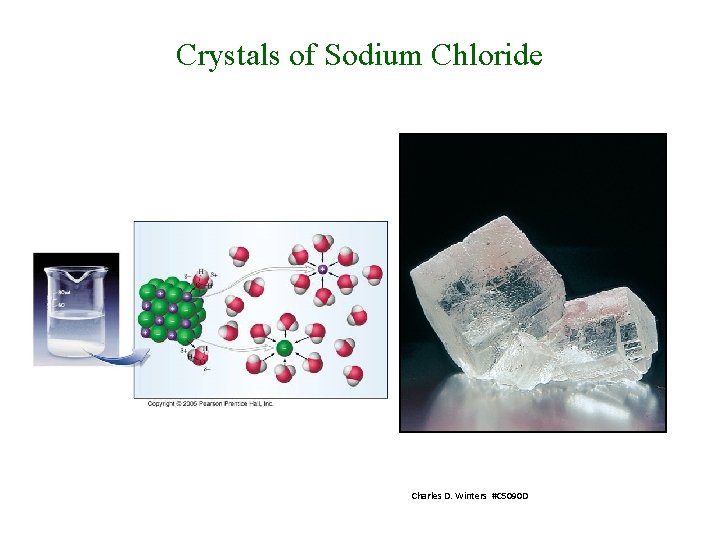
Crystals of Sodium Chloride Charles D. Winters #C 5090 D
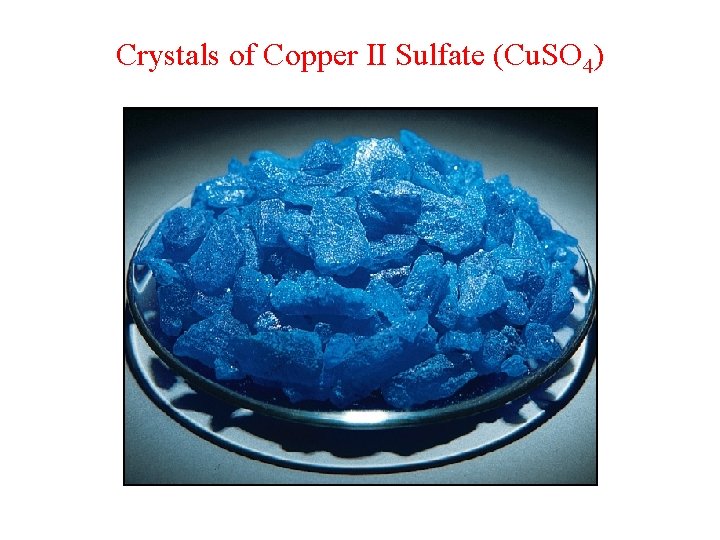
Crystals of Copper II Sulfate (Cu. SO 4)
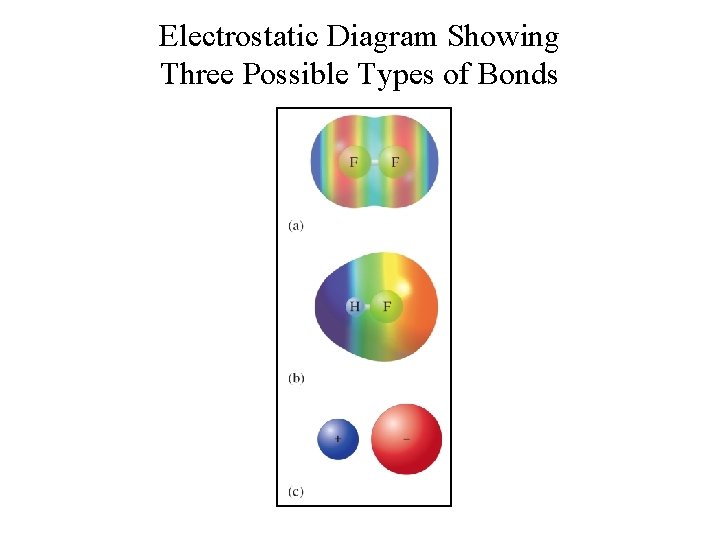
Electrostatic Diagram Showing Three Possible Types of Bonds
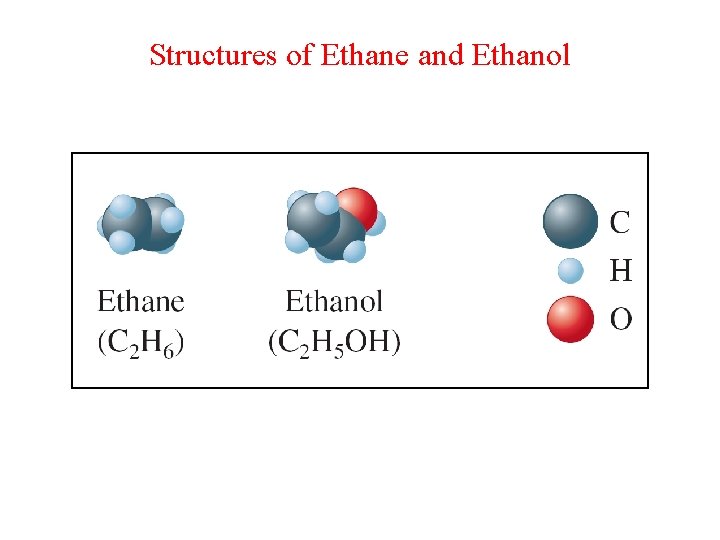
Structures of Ethane and Ethanol
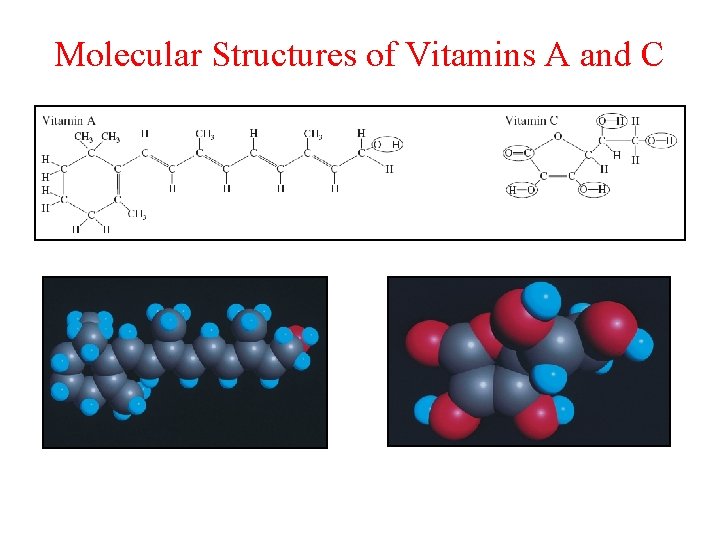
Molecular Structures of Vitamins A and C
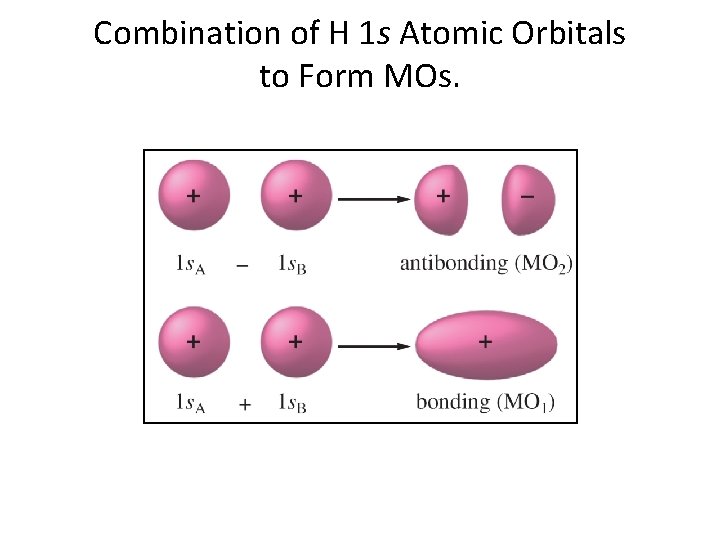
Combination of H 1 s Atomic Orbitals to Form MOs.
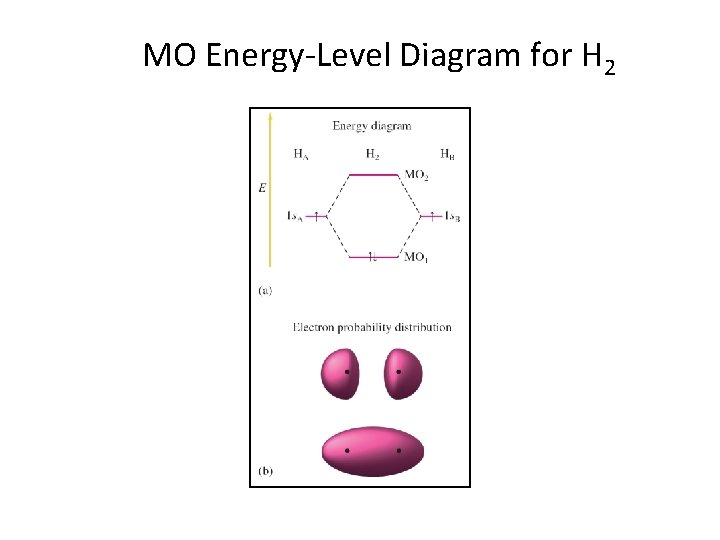
MO Energy-Level Diagram for H 2
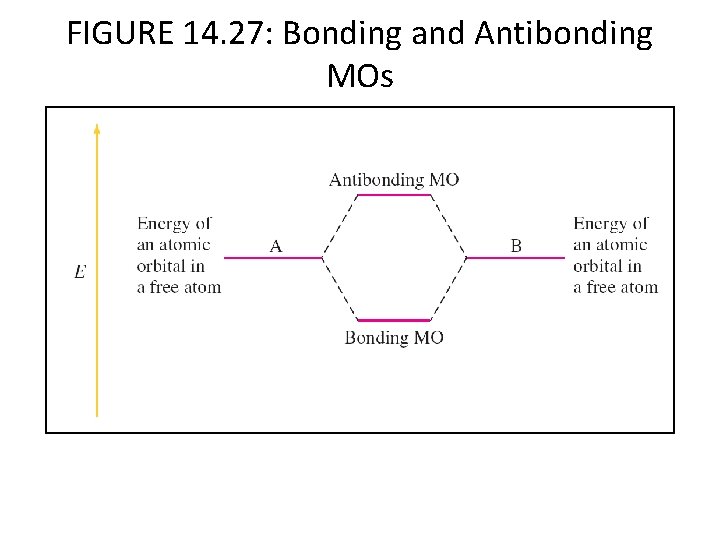
FIGURE 14. 27: Bonding and Antibonding MOs
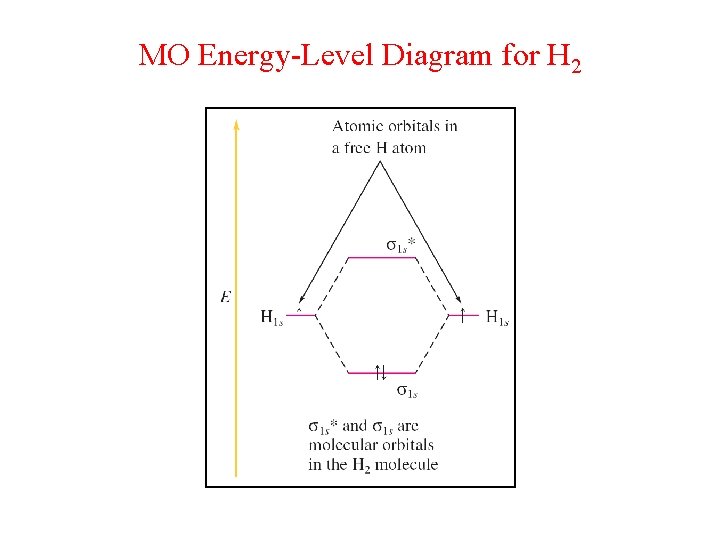
MO Energy-Level Diagram for H 2
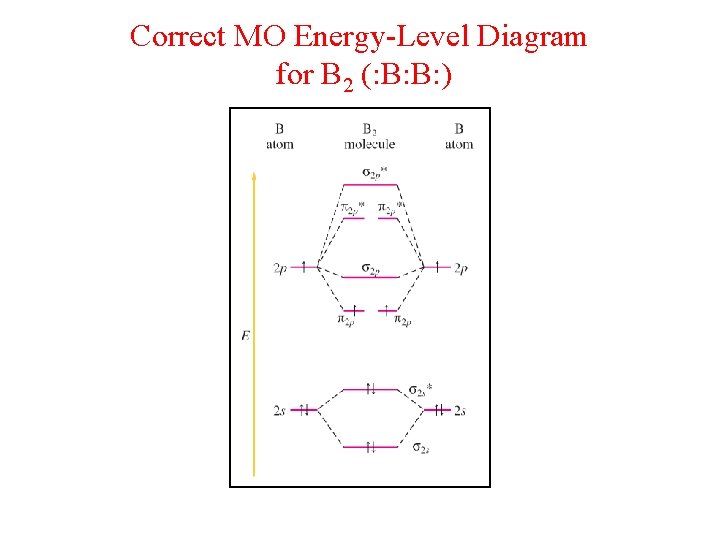
Correct MO Energy-Level Diagram for B 2 (: B: B: )
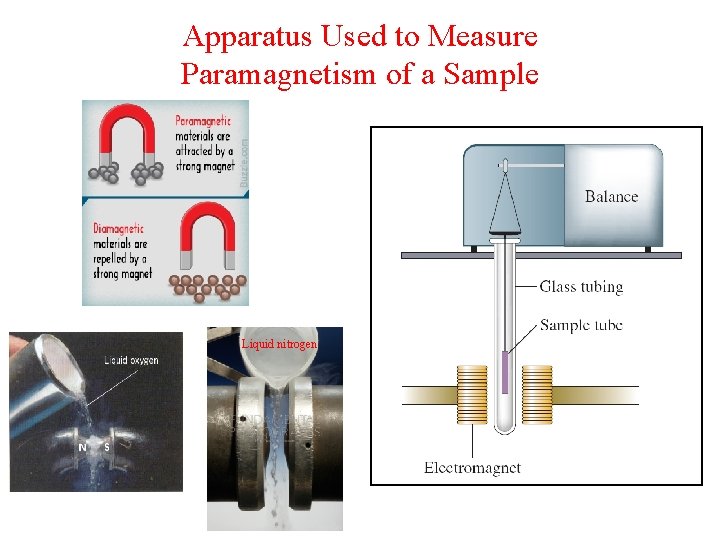
Apparatus Used to Measure Paramagnetism of a Sample Liquid nitrogen
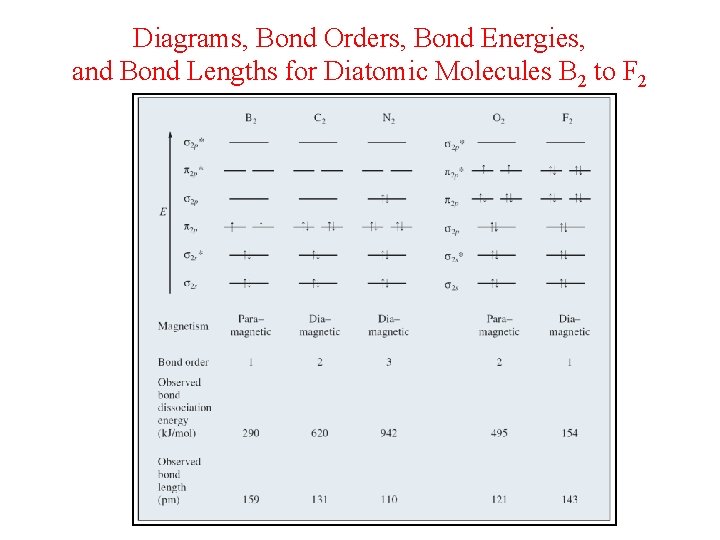
Diagrams, Bond Orders, Bond Energies, and Bond Lengths for Diatomic Molecules B 2 to F 2
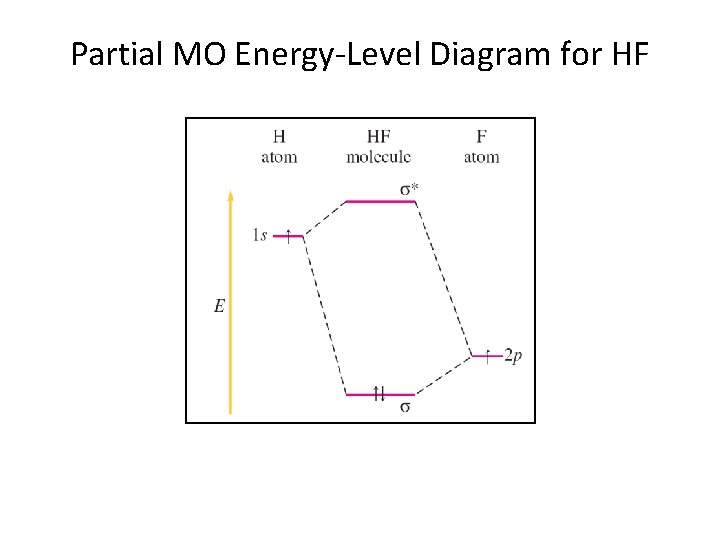
Partial MO Energy-Level Diagram for HF
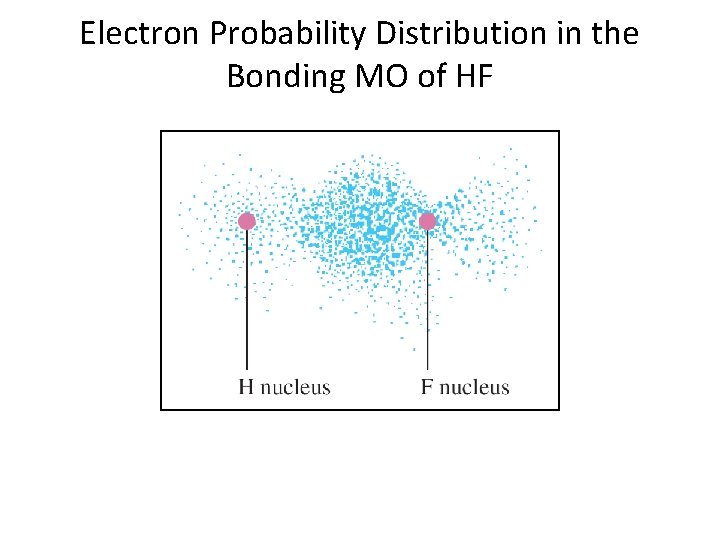
Electron Probability Distribution in the Bonding MO of HF
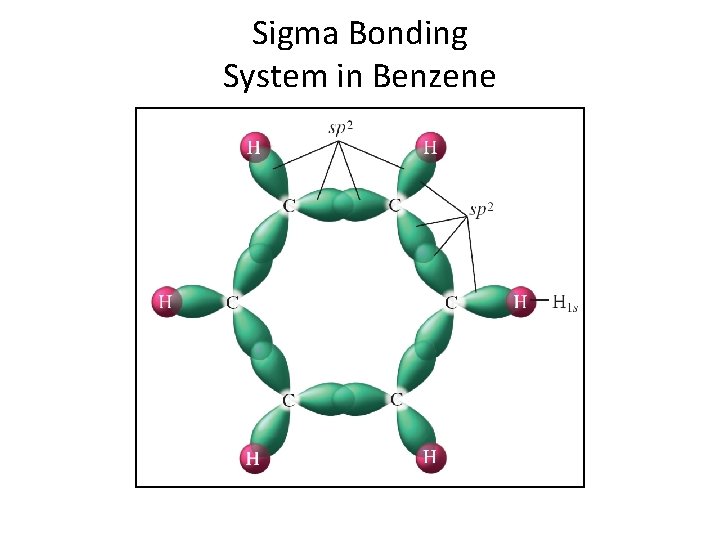
Sigma Bonding System in Benzene
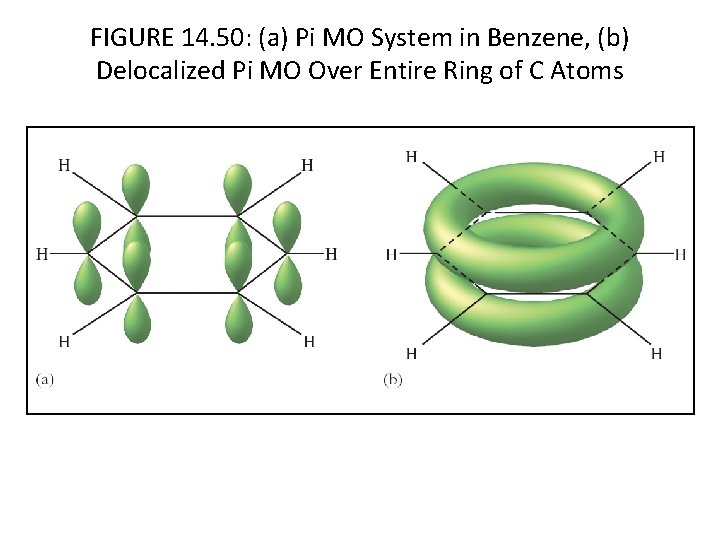
FIGURE 14. 50: (a) Pi MO System in Benzene, (b) Delocalized Pi MO Over Entire Ring of C Atoms
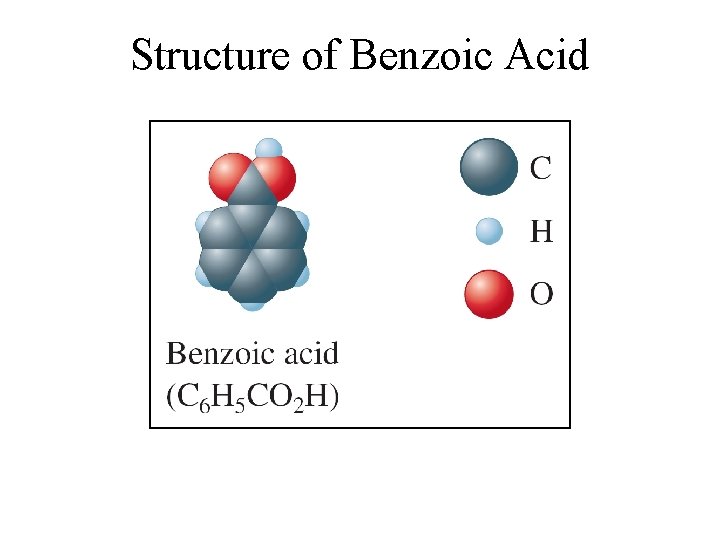
Structure of Benzoic Acid
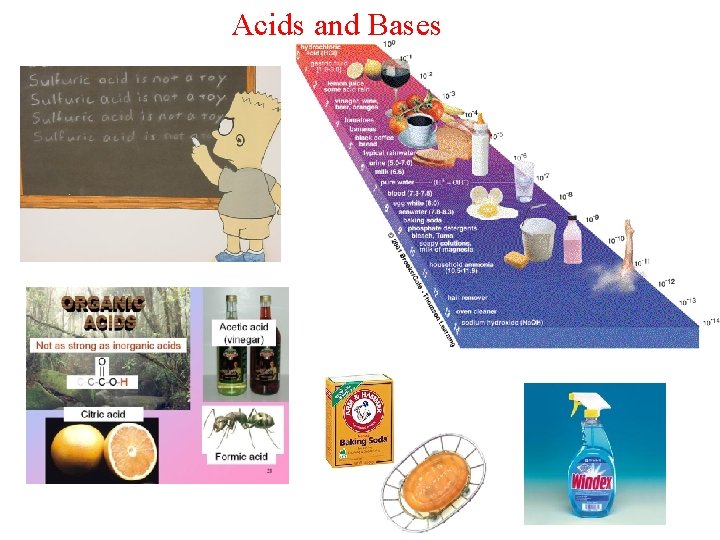
Acids and Bases
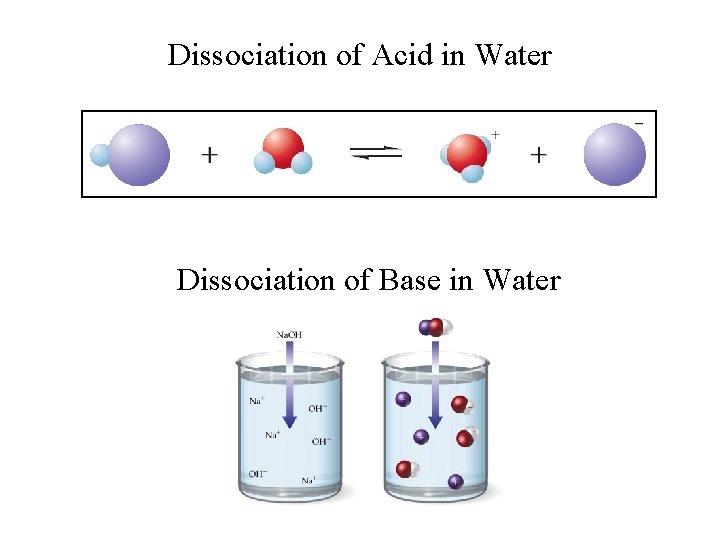
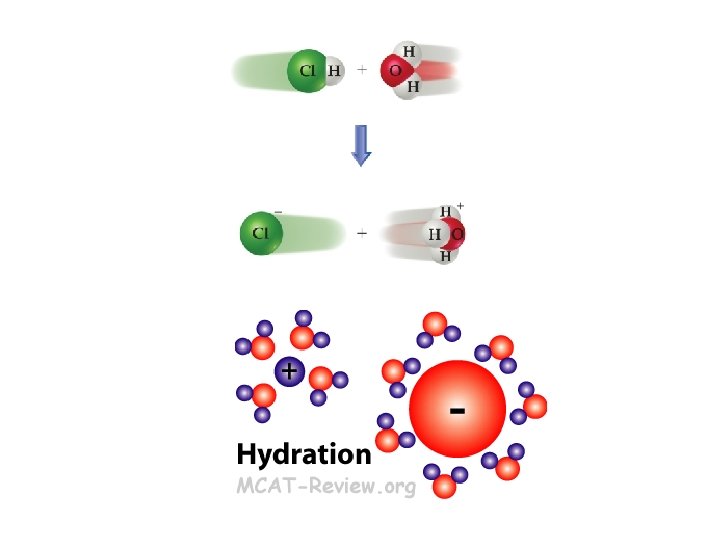
Dissociation of Acid in Water Dissociation of Base in Water
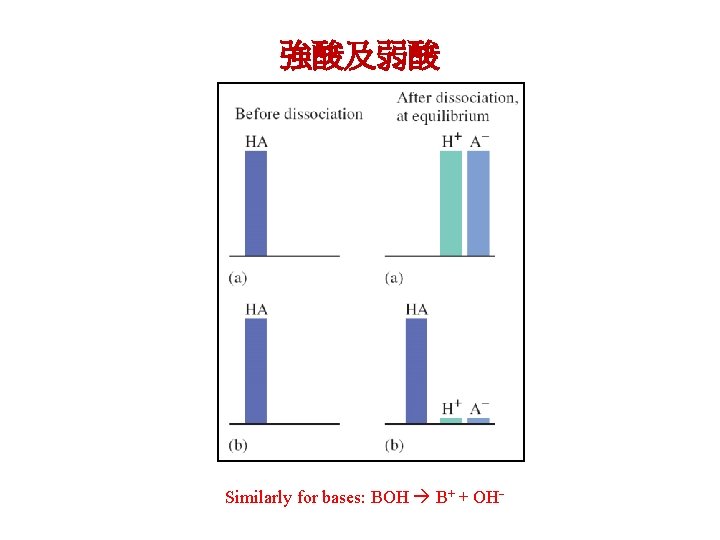
強酸及弱酸 Similarly for bases: BOH B+ + OH-
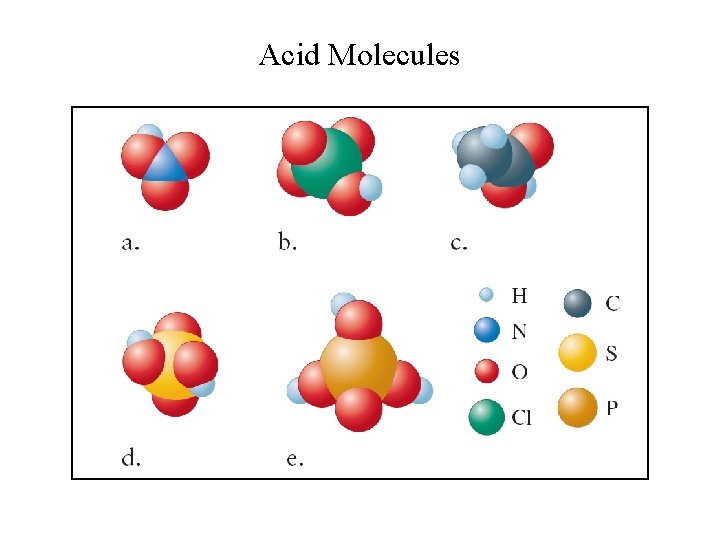
Acid Molecules
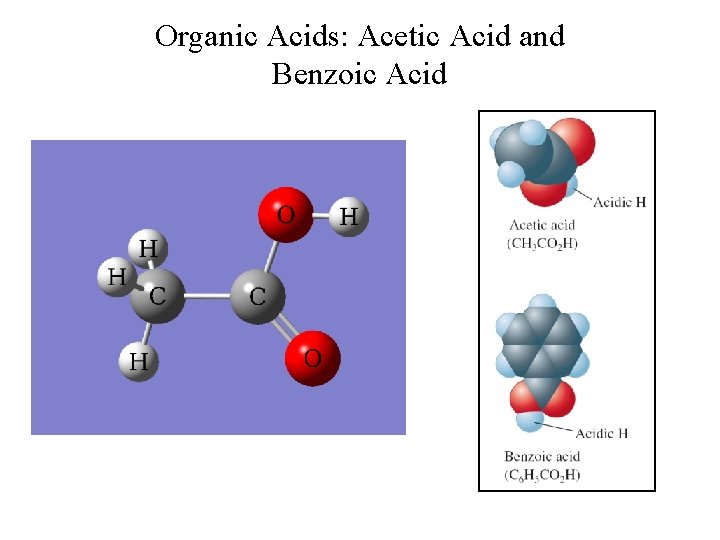
Organic Acids: Acetic Acid and Benzoic Acid

強酸: HX, X = Cl, Br, NO 3, HSO 4, Cl. O 4 + HX H + X 水中完全解離 弱酸:R-COOH (有機酸), HF, H 2 CO 3 R-COOH H+ + R-COO- 水中部分解離 強鹼: MOH, M = Na, K; Na 2 CO 3 MOH M+ + OH- 水中完全解離 Na 2 CO 3 + H 2 O ↔ 2 Na+ + HCO 3 - + OH弱鹼:R-NH 2 (有機胺), Na. HCO 3 (小蘇打) R-NH 2 + H 2 O ↔ R-NH 3+ + OH- 水中部分解離 Na. HCO 3 + H 2 O ↔ Na+ + H 2 CO 3 + OH 2 Na. HCO 3 CO 2 + Na 2 CO 3 + H 2 O
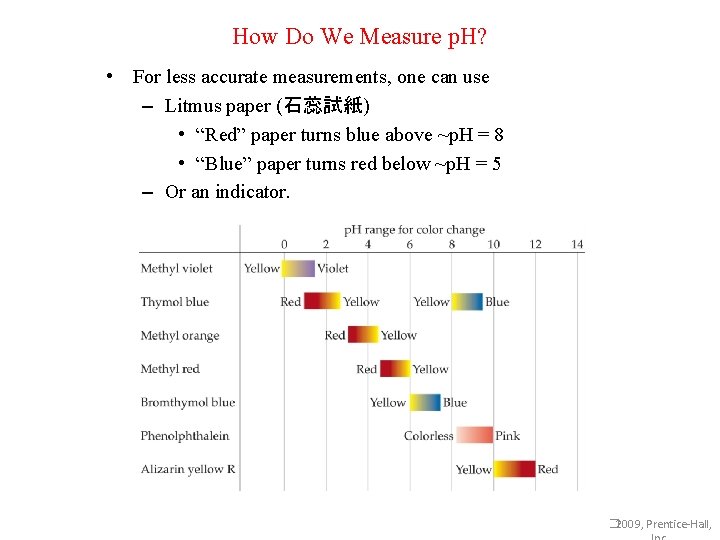
How Do We Measure p. H? • For less accurate measurements, one can use – Litmus paper (石蕊試紙) • “Red” paper turns blue above ~p. H = 8 • “Blue” paper turns red below ~p. H = 5 – Or an indicator. � 2009, Prentice-Hall,
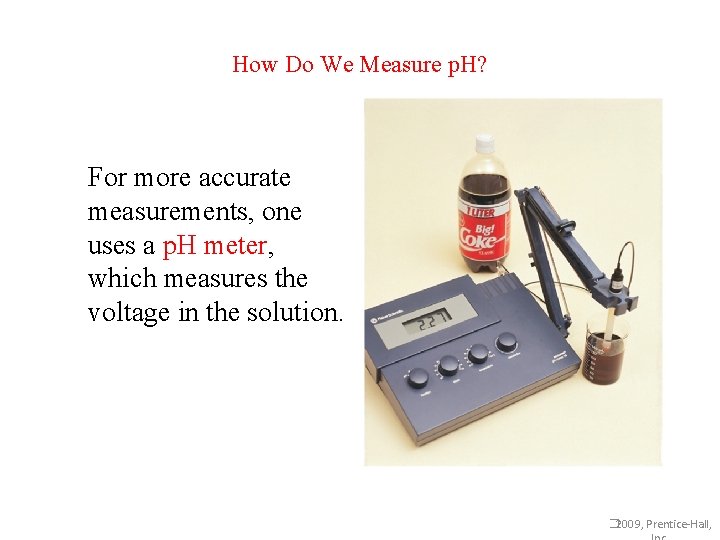
How Do We Measure p. H? For more accurate measurements, one uses a p. H meter, which measures the voltage in the solution. � 2009, Prentice-Hall,
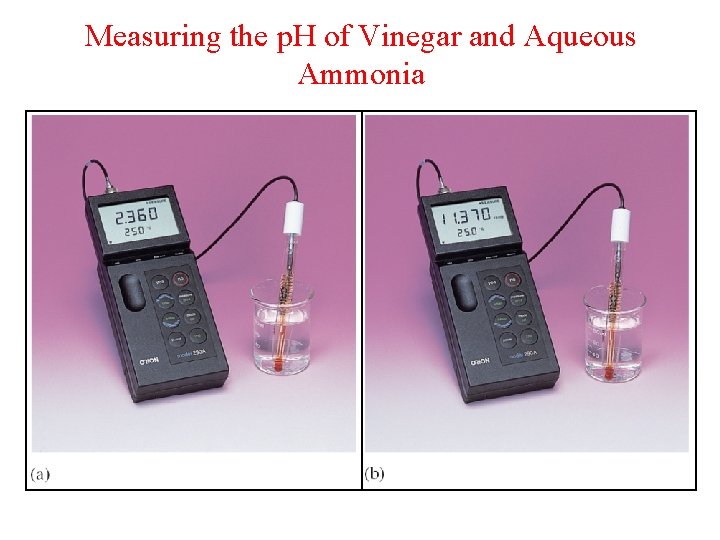
Measuring the p. H of Vinegar and Aqueous Ammonia
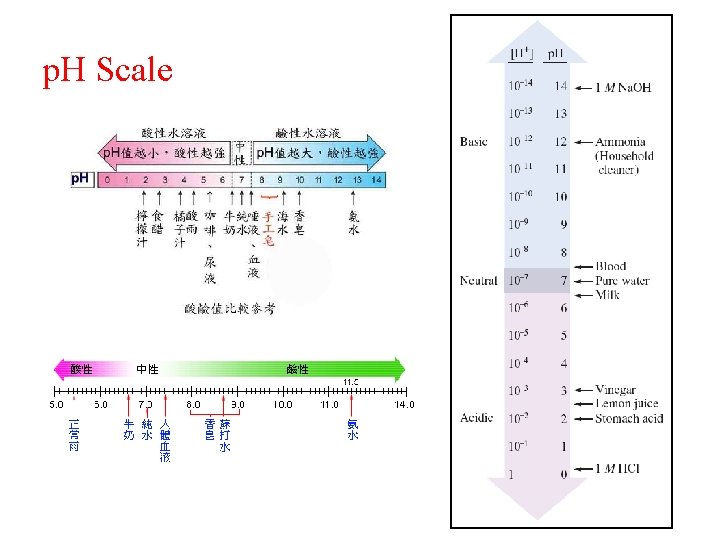
p. H Scale
- Slides: 53