I Air Pollution Sources Effects Most local air


 • Principally NO 2 •")

 Effects • • •")
- Slides: 16
I. Air Pollution – Sources & Effects • Most local air pollution associated with cities, esp. large cities and industrial centers • • Average concentration of airborne particles in urban areas ~10 x concentration in rural areas Major cities – air pollution causes thousands of deaths each year • • Los Angeles – 6000 New York – 4000 Detroit – 2000 Mexico City – Air quality so severe that some people estimate breathing is equivalent to smoking two packs of cigarettes a day Many air pollutants are hygroscopic • • • Combine with water and promote fog formation Particulate matter can affect local precipitation • Boulder, CO – Power plant produced fly ash aerosols and induced snowfall
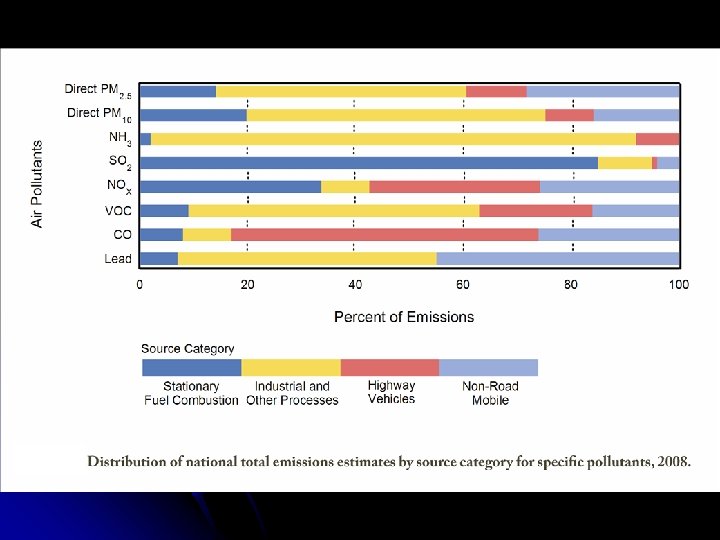
II. Air Pollution – Components • Primary • • • Secondary • • Require modification Ex – Ozone Many are components of photochemical smog (react chemically with light) Legislation addressing air pollution requires consideration of both primary and secondary pollutants • • • Problematic in the form in which they’re produced Ex – Lead, carbon monoxide Clean Air Act – 1970 Clean Air Act Amendments – 1990 EPA – NAAQS for six criteria pollutants
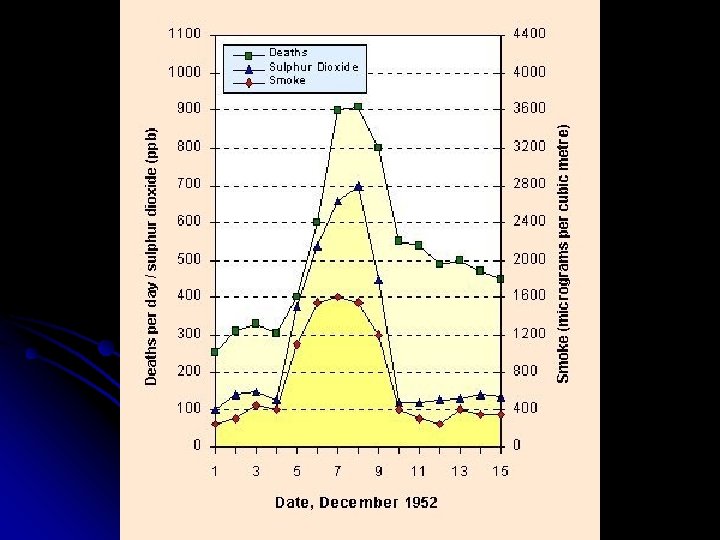
II. Air Pollution – Components A. Particulate Matter 1. Sources • • • 2. Combustion of fossil fuels, especially coal Mobile sources – Cars, trucks Stationary sources – Power plants, industrial furnaces, wood stoves Effects • • • By the 1950 s, air quality in London had deteriorated so much that incidences of death due to pollution weren’t uncommon • 1952 – “Killer Smog” in London 4000+ deaths Health – Respiratory impairment, lung damage, lung cancer • Especially children, elderly, people with chronic respiratory problems Acidic PM can damage structures, reduce visibility
LA - 1943 NYC - 1963
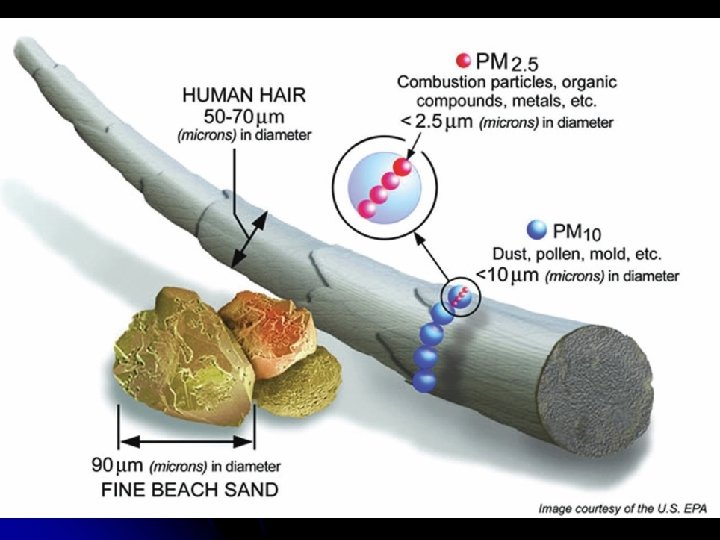
II. Air Pollution – Components A. Particulate Matter 3. Trends • • • EPA Standards • Pre-1987 – TSP (Total Suspended Particulates) • Post-1987 – PM 10 (Particles < 10 μm) • Post-1997 – PM 2. 5 (Particles < 2. 5 μm) NAAQS for PM 10 • Annual average = 50 μg m-3 (revoked Dec 2006) • Daily peak = 150 μg m-3 NAAQS for PM 2. 5 • Annual average = 15 μg m-3 • Daily peak = 35 μg m-3
1990 -2009: Direct PM 10 emissions down 67% 1990 -2009: Direct PM 2. 5 emissions down 50% http: //www. epa. gov/airtrends
II. Air Pollution – Components B. Carbon Monoxide • • Colorless, odorless gas Produced by incomplete combustion of fossil fuels (too little O 2 supplied in a normally tuned engine) Sources 1. • • • About 56% of CO emissions nationwide from on-road motor vehicles (24% from non-road vehicles) • In cities, 85 -95% of CO from motor vehicles Diesel engines typically produce less CO but more PM than gasoline engines Alternative to complete combustion of fuel is combustion of exhaust • Produces hazardous amounts of heat • Combustion temperature can be lowered using catalyst • Chemical catalysts poisoned by lead
II. Air Pollution – Components B. Carbon Monoxide 2. Effects • • • CO binds to hemoglobin in place of oxygen • Affinity for CO ~ 200 x higher than for O 2 Continued exposure can lead to • Impairment of vision • Difficulty estimating time • Reduced manual dexterity • Poor learning ability • Difficulty performing complex tasks • Greater risk of heart attacks in people with certain forms of heart disease (e. g. angina) Contributes to formation of ground-level ozone
1990 -2008 Vehicle miles traveled increased 36%
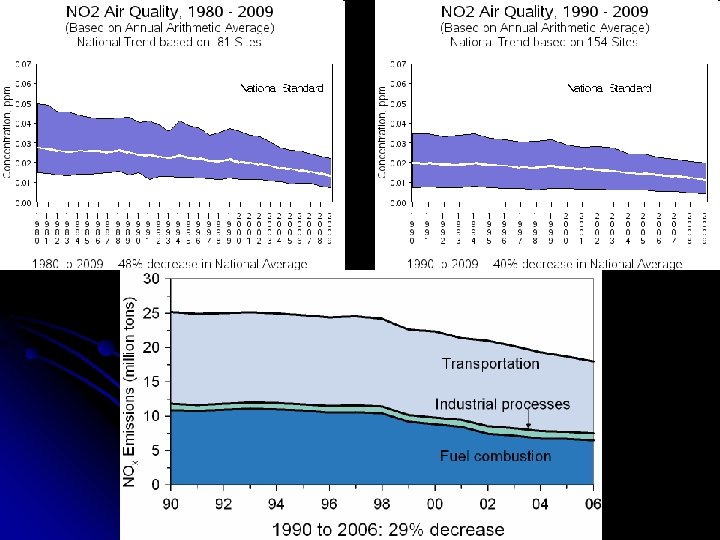
II. Air Pollution – Components C. Nitrogen Oxides (NOx) • Principally NO 2 • • Highly reactive reddish-brown gas Play a major role in the formation of ozone, PM, haze and acid rain Important component of photochemical smog Sources • 1. • Forms from FF combustion at high temperatures • Mobile – Cars & trucks (58%) • Stationary – Power plants (34%), home heaters, gas stoves, industrial plants (8% total) • Formation could be controlled by using pure oxygen for combustion (impractical and dangerous) • Formation reduced by low-temperature combustion
Denver
II. Air Pollution – Components C. 2. Nitrogen Oxides (NOx) Effects • • • Strong oxidizing agent • Reacts readily in air to form nitric acid and nitrates Health • Irritates lungs and lower resistance to respiratory infections • Lung damage Environment • Damages plant foliage, impairs growth • Precursor of ground-level ozone, PM, smog • Contributes to acid rain - Leaching of minerals from soil - Acidification of lakes and waterways • Contributes to eutrophication of lakes & waterways • Contributes to global warming (N 2 O)