I Air Pollution Components D GroundLevel Ozone O
 • Primary constituent of")
 2. Effects • •")


 Effects • •")
 • Mostly SO 2 but")
 Effects • • Major")
 1. Sources • • • Formerly")
 2. Effects • • • Not")


 • Local")
- Slides: 17
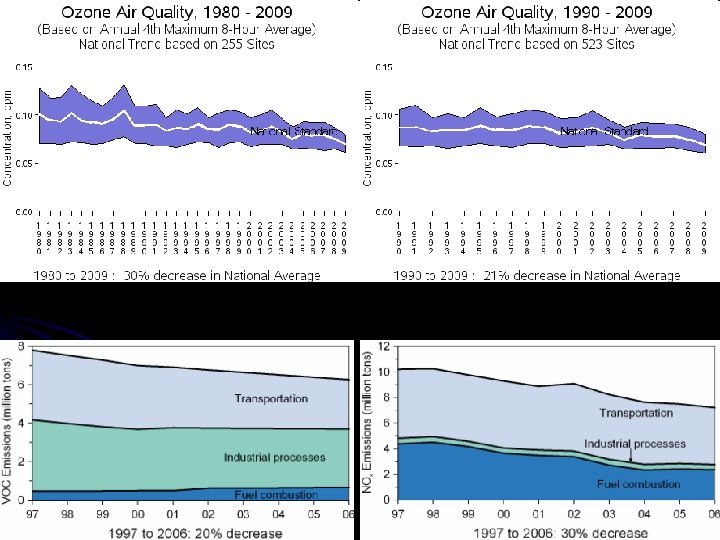
I. Air Pollution – Components D. Ground-Level Ozone (O 3) • Primary constituent of photochemical smog • • 1. Secondary pollutant (ground-level ozone) Formed from NOx and volatile organic chemicals (VOCs) in the presence of heat and sunlight Sources • • Gasoline vapors (gas tanks, gas cans) Chemical solvents (chemical plants, factories, refineries, commercial products) Fossil fuel combustion (motor vehicles) Precursor gas emissions may be concentrated in one area, but gases may be carried far from sources before forming ozone
I. Air Pollution – Components D. Ground-Level Ozone (O 3) 2. Effects • • 2008 – 40% of US population lived in counties with ozone levels above EPA standards • Worst city = Los Angeles Health • Respiratory inflammation • Reduction of lung function • Chest pain, coughing, nausea, pulmonary congestion • Permanent lung damage from repeated exposure
Phoenix
Taj Mahal
I. Air Pollution – Components D. 2. Ground-Level Ozone (O 3) Effects • • • 2008 – 40% of US population lived in counties with ozone levels above EPA standards • Worst city = Los Angeles Health • Respiratory inflammation • Reduction of lung function • Chest pain, coughing, nausea, pulmonary congestion • Permanent lung damage from repeated exposure Environment • Impair plant growth • Damage plant foliage • Ozone causes several billion dollars in agricultural crop loss each year • Damage to forest ecosystems
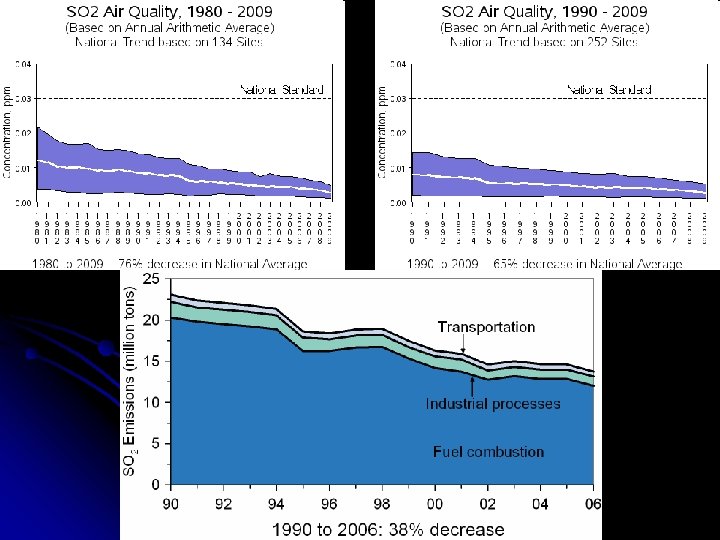
I. Air Pollution – Components E. Sulfur Oxides (SOx) • Mostly SO 2 but some SO 3 • • Reactive gases Important in the formation of photochemical smog and acid rain Sources 1. • Formed when fuel containing sulfur (mainly coal and oil) is burned • Electricity generation (84%) • Metal smelting (3%) • Paper manufacturing • Other industrial processes (9% total)
I. Air Pollution – Components E. 2. Sulfur Oxides (SOx) Effects • • Major precursor to PM 2. 5 Combine with water to form sulfuric acid • Major component of acid rain Health • Temporary breathing impairment • Respiratory illness • Aggravation of cardiovascular disease • Especially harmful to elderly and children Environment • Damage to structures and objects • Leaching of minerals from soil • Damage to plants/foliage • Acidification of lakes and waterways
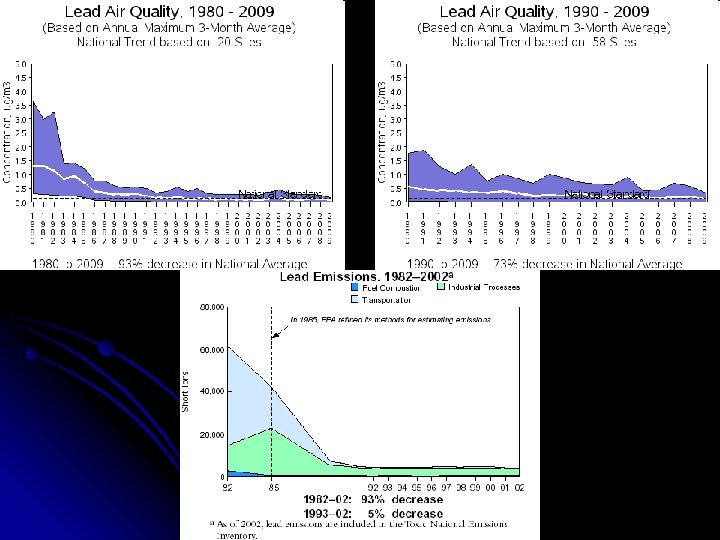
I. Air Pollution – Components F. Lead (Pb) 1. Sources • • • Formerly motor vehicles • Transition to unleaded gasoline virtually eliminated this source Industrial plants • Smelters • Battery manufacturers Human exposure mostly through inhalation of lead in air and dust • Food • Paint • Water
I. Air Pollution – Components F. Lead (Pb) 2. Effects • • • Not readily excreted by body • Accumulates in tissues, especially kidneys, liver, nervous system, bones Health • Anemia • Kidney disease • Reproductive disorders • Neurological problems (seizures, mental retardation, behavioral disorders) • Birth defects (CNS damage, retarded growth) • High blood pressure heart disease Environment • Deposition on leaves of plants is hazardous to grazing animals and humans (ingestion of meat)
Comparison of growth measures and emissions, 1990 -2008
**Ozone and PM 2. 5 shown relative to standards revised in 2008 and 2006, respectively**
Number of People Living in Counties with Air Quality Concentrations Above the Level of the NAAQS in 2008 http: //www. epa. gov/airtrends/aqtrends. html
II. Air Pollution – Regulation & Legislation • A. History – “Pollution is the price of progress” Air Quality Act (1967) • Authorized secretary of HEW to establish air quality regions • • • B. States given responsibility of adopting and enforcing pollution control standards Controversial – Air pollution doesn’t stop at regional boundaries Failure – Only a few regions were established, and no state had established a full pollution control program Clean Air Act (1970) • Established National Ambient Air Quality Standards (NAAQS) • • • Typically annual average concentration or daily maximum concentration Established statutory deadlines for compliance EPA (federal agency) responsible for recommending policy to Congress and monitoring/enforcing policy
II. Air Pollution – Regulation & Legislation B. Clean Air Act (1970) • Local enforcement left to state governments • • “Command Control” • • C. States allowed to have more stringent pollution standards than EPA established standards and technology used to achieve standards Non-compliance heavy fines Clean Air Act Amendments (1990) • Market-based approach to achieving NAAQS • • • “Cap and Trade” system Examples Time frames for compliance based on designation of “nonattainment areas” (marginal to extreme) • • Tailored to specific situations Established possibility of emissions trading • Allows economic and technological flexibility