Hypothesis Tests One Sample Mean Cal State Northridge


 = _____")


- Slides: 42
Hypothesis Tests: One Sample Mean Cal State Northridge 320 Andrew Ainsworth Ph. D
MAJOR POINTS Sampling distribution of the mean �An example Testing �An Psy 320 - Cal State Northridge revisited Testing hypotheses: sigma known hypotheses: sigma unknown example Factors affecting the test Measuring the size of the effect Confidence intervals 2
REVIEW: HYPOTHESIS TESTING STEPS 1. 2. 4. 5. 6. 7. Psy 320 - Cal State Northridge 3. State Null Hypothesis Alternative Hypothesis Decide on (usually. 05) Decide on type of test (distribution; z, t, etc. ) Find critical value & state decision rule Calculate test Apply decision rule 3
SAMPLING DISTRIBUTIONS In �“How likely is it that I could get a sample statistic of this value from a population if the corresponding population parameter 4 was ___” Psy 320 - Cal State Northridge reality, we take only one sample of a specific size (N) from a population and calculate a statistic of interest. Based upon this single statistic from a single sample, we want to know:
SAMPLING DISTRIBUTIONS BUT, Psy 320 - Cal State Northridge in order to answer that question, we need to know what the entire range of values this statistic could be. How can we find this out? Draw all possible samples of size N from the population and calculate a sample statistic on each of these samples (Chapter 8) Or we can calculate it 5
SAMPLING DISTRIBUTIONS A Central Tendency, Dispersion, Shape Psy 320 - Cal State Northridge distribution of all possible statistics calculated from all possible samples of size N drawn from a population is called a Sampling Distribution. Three things we want to know about any distribution? �– 6
AN EXAMPLE – BACK TO IQPLUS Returning Psy 320 - Cal State Northridge to our study of IQPLUS and its affect on IQ A group of 25 participants are given 30 mg of IQPLUS everyday for ten days At the end of 10 days the 25 participants are given the Stanford -Binet intelligence test. 7
IQPLUS The Psy 320 - Cal State Northridge mean IQ score of the 25 participants is 106 = 100, = 10 Is this increase large enough to conclude that IQPLUS was affective in increasing the participants IQ? 8
SAMPLING DISTRIBUTION OF THE MEAN Formal e. What kinds of means if = 100 and = 10? �This is the sampling distribution of the mean (Why? ) �i. 9 Psy 320 - Cal State Northridge solution to example given in Chapter 8. We need to know what kinds of sample means to expect if IQPLUS has no effect.
Psy 320 - Cal State Northridge What is the relationship between and the SD above? 10
SAMPLING DISTRIBUTION OF THE MEAN The �Mean Why? �St. dev. of sampled population Why? �Size of sampled population Psy 320 - Cal State Northridge sampling distribution of the mean depends on of sample Why? 11
SAMPLING DISTRIBUTION OF THE MEAN Shape of the sampling distribution Why? �Rate normal of approach depends on sample size Why? Basic theorem �Central Psy 320 - Cal State Northridge �Approaches limit theorem 12
CENTRAL LIMIT THEOREM Central Tendency mean of the Sampling Distribution of the mean is denoted as Dispersion �The Standard Deviation of the Sampling Distribution of the mean is called the Standard Error of the Mean and is denoted as Psy 320 - Cal State Northridge �The 13
CENTRAL LIMIT THEOREM Standard defined this manually in Chapter 8 �And it can be calculated as: Shape �The Psy 320 - Cal State Northridge �We Error of the Mean shape of the sampling distribution of the mean will be normal if the original population is normally distributed OR 14 �if the sample size is “reasonably large. ”
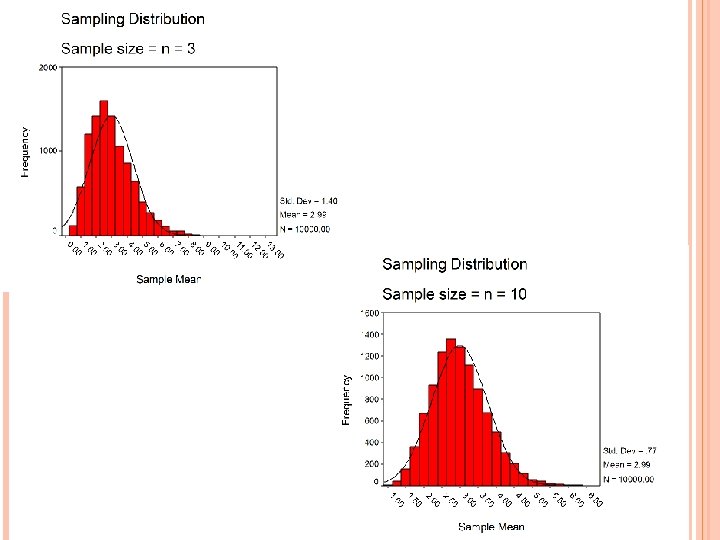
DEMONSTRATION Let Psy 320 - Cal State Northridge a population be very skewed Draw samples of size 3 and calculate means Draw samples of size 10 and calculate means Plot means Note changes in means, standard deviations, and shapes 15
PARENT POPULATION Psy 320 - Cal State Northridge 16
DEMONSTRATION Means �Except for minor sampling error Standard deviations have decreased appropriately Shape has become more normal as we move from n = 3 to n = 10 �See Psy 320 - Cal State Northridge have stayed at 3. 00 throughout superimposed normal distribution for 18 reference
TESTING HYPOTHESES: AND KNOWN Psy 320 - Cal State Northridge Called a 1 -sample Z-test H 0: = 100 H 1: 100 (Two-tailed) Calculate p (sample mean) = 106 if = 100 Use z from normal distribution Sampling distribution would be normal 19
USING Z TO TEST H 0 2 -TAILED =. 05 Calculate z z > + 1. 96, reject H 0 (Why 1. 96? ) ____ > 1. 96 �The Psy 320 - Cal State Northridge If difference is significant. 20
USING Z TO TEST H 0 1 -TAILED =. 05 Calculate �The difference is significant. Psy 320 - Cal State Northridge z (from last slide) If z > + 1. 64, reject H 0 (Why 1. 64? ) ____ > 1. 64 21
Z-TEST Compare �Calculate probability of getting this mean if null true. �Reject if that probability is too small. Psy 320 - Cal State Northridge computed z to histogram of sampling distribution The results should look consistent. Logic of test 22
TESTING HYPOTHESES: KNOWN NOT KNOWN same example, but not known We can make a guess at with s But, unless we have a large sample, s is likely to underestimate (see next slide) So, a test based on the normal distribution will lead to biased results (e. g. more Type 1 errors) Assume Psy 320 - Cal State Northridge 23
SAMPLING DISTRIBUTION OF THE VARIANCE If n = 5 and you take 10, 000 samples Psy 320 - Cal State Northridge 138. 89 Let’s say you have a population variance = 138. 89 58. 94% < 138. 89 24
TESTING HYPOTHESES: KNOWN NOT KNOWN s is the best estimate of ; is the best estimate of Since Z does not work in this case we need a different distribution Since that is based on s �Adjusts for the underestimation �And takes sample size (i. e. degrees of freedom) into account Psy 320 - Cal State Northridge �One 25
THE T DISTRIBUTION Symmetric, �For Psy 320 - Cal State Northridge mean = median = mode = 0. Asymptotic tails Infinite family of t distributions, one for every possible df. low df, the t distribution is more leptokurtic (e. g. spiked, thin, w/ fat tails) �For high df, the t distribution is more normal �With df = ∞, the t distribution and the z 26 distribution are equivalent.
THE T DISTRIBUTION Psy 320 - Cal State Northridge 27
DEGREES OF FREEDOM Skewness Psy 320 - Cal State Northridge of sampling distribution of variance decreases as n increases t will differ from z less as sample size increases Therefore need to adjust t accordingly Degrees of Freedom: df = n - 1 t based on df 28
TESTING HYPOTHESES: KNOWN NOT KNOWN Psy 320 - Cal State Northridge Called a 1 -sample t-test H 0: = 100 H 1: 100 (Two-tailed) Calculate p (sample mean) = 106 if = 100 Use t-table to look up critical value using degrees of freedom Compare tobserved to tcritical and make decision 29
USING T TOTEST H 0 2 -TAILED =. 05 as z except for s in place of . In our sample of 25, s = 7. 78 Same With = . 05, df=24, 2 -tailed tcritical = _____ (Table D. 6; see next slide) Since ____ > ____ reject H 0 Psy 320 - Cal State Northridge 30
T DISTRIBUTION Psy 320 - Cal State Northridge 31
USING T TOTEST H 0 1 -TAILED =. 05 ≤ 100 H 1: > 100 (One-tailed) The tobserved value is the same _____ With =. 05, df=24, 1 -tailed tcritical = ____ (Table D. 6; see next slide) Since _____ > _____ reject H 0: Psy 320 - Cal State Northridge 32
T DISTRIBUTION Psy 320 - Cal State Northridge 33
CONCLUSIONS With Psy 320 - Cal State Northridge n = 25, tobserved(24) = _____ Because _____ is larger than both _____ (1 -tailed) and _____ (2 tailed) we reject H 0 under both 1 and 2 -tailed hypotheses Conclude that taking IQPLUS leads to a higher IQ than normal. 34
FACTORS AFFECTING… t test between sample and population means �Magnitude of sample variance �Sample size Psy 320 - Cal State Northridge �Difference Decision level �One-tailed versus two-tailed test �Significance 35
SIZE OF THE EFFECT We �That doesn’t mean that it is important. Population mean = 100, Sample mean = 106 Difference is 6 words or roughly a 6% increase. Is this large? Psy 320 - Cal State Northridge know that the difference is significant. 36
EFFECT SIZE Later �In our sample s = 7. 78 �over 3/4 of a standard deviation Psy 320 - Cal State Northridge we develop this more in terms of standard deviations. For Example: 37
CONFIDENCE INTERVALS ON MEAN Sample Psy 320 - Cal State Northridge mean is a point estimate We want interval estimate Given the sample mean we can calculate an interval that has a probability of containing the population mean This can be done if is known or not 38
CONFIDENCE INTERVALS ON MEAN is known than the 95% CI is If is not known than the 95% CI is Psy 320 - Cal State Northridge If 39
FOR OUR DATA ASSUMING KNOWN Psy 320 - Cal State Northridge 40
FOR OUR DATA ASSUMING NOT KNOWN Psy 320 - Cal State Northridge 41
CONFIDENCE INTERVAL Neither Psy 320 - Cal State Northridge interval includes 100 - the population mean of IQ Consistent with result of t test. Confidence interval and effect size tell us about the magnitude of the effect. What else can we conclude from confidence interval? 42