Hypothesis Testing II 10101977 Wheres Waldo Waldo Stats


 This is a")

 We call this the margin of")


- Slides: 15
Hypothesis Testing II ? 10/10/1977?
Where’s Waldo
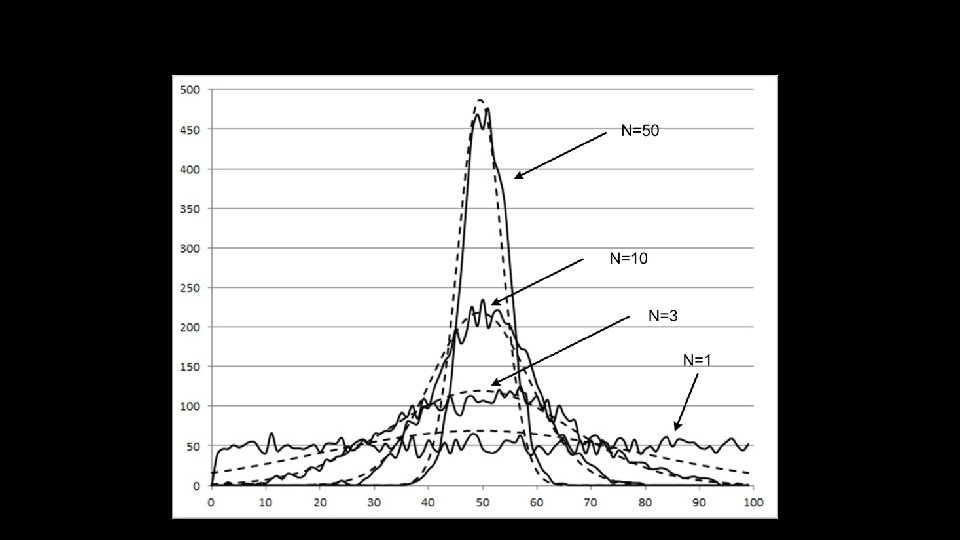
Waldo Stats. Is this a normal distribution?
Standard deviations and probability of the population mean
The process of testing hypothesis 1. Examine null hypothesis 2. If suspicious, try to disprove it (where’s the confidence numbers) 3. Decide how to sample randomly 4. Figure out how many N to sample? 5. Calculate mean 6. Calculate standard deviation 7. Calculate Z score (how many deviations away are you) 8. Reject or accept based on probability usually >=95%, definitely if over 99. 7%
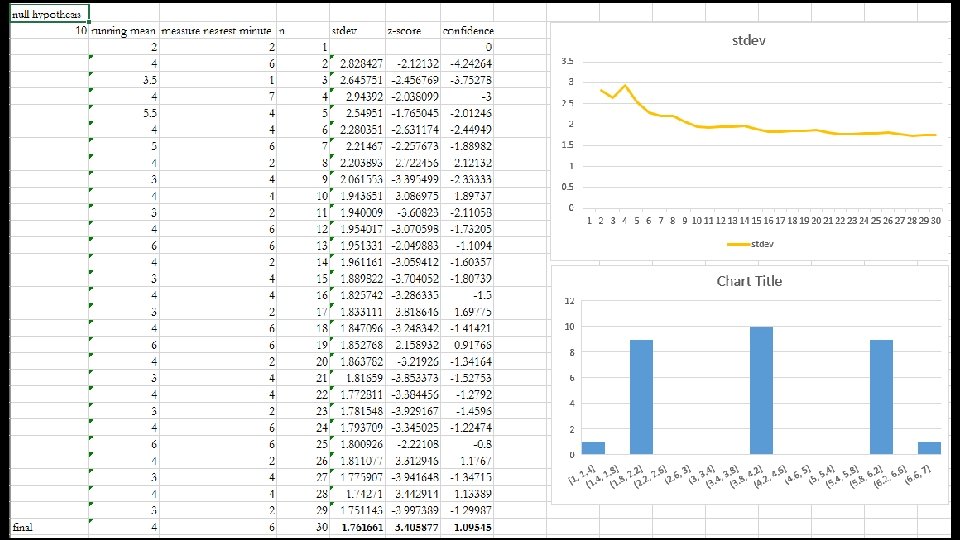
How many N to sample? More is better 1. Cost + time a factor 2. As N increases the standard deviation decreases 3. Confidence interval decreases, +- error
Z-Values A z-value gives you p-value (probability of getting this value) This is a cumulative from the mean so multiply your Z*2 to get a total probability. E. g. , z=2 p =. 47*2 = 95%
T-Values If N <30 then the standard deviations become larger since n is smaller. So it now takes 2. 262 deviations to get 95% of the data.
Any statistic has an error +- (we’re speculating) We call this the margin of error For the mean we have: Mean +-Z*(Standard Deviation/sqrt(N)) E. g. , for the Query analysis we did we have Mean = 4, Z=-3. 40, S=1. 76, so we have 4 +- 1. 09 @99. 97%. So we can say we are 999. 7% confident that population mean is 4 +- 1. 09 or we are 999. 7% confident that the population mean is within the confidence interval 2. 91 and 5. 09
Margin of Error continued We could have chosen a 95% margin of error also and by doing so our confidence interval would have decreased. E. g. , Mean = 4, Z=2, S=1. 76, so we have 4 +-. 64 @95%. So we can say we are 95% confident that population mean is 4 +-. 64 or we are 95% confident that the population mean is within the confidence interval 3. 36 and 4. 64. This is how you should present your findings. Statistic, N, Standard Deviation and confidence numbers.
Type I & Type II errors
Some examples • The average time it takes to find Waldo at Comic Con by a random group of people over age 6 is 7 minutes. We surveyed 30 random people over age six and they found Waldo in an average time of 5 minutes. Who is right? • Null hypo = mean = 7 • New hypo = mean = 5. N = 30, calculated sdev = 2. 08, Z-Score = -. 96 • Z-table look up gives =. 33*2 p = 66%. So there’s a 66% chance that the population mean is in this range. Margin of error = 5+-. 36 66% confidence. Should we reject?
Time permitting in class examples with Waldo