Hypothesis Testing Chapter 6 Inferential Statistics Making inferences


 Error Rejecting the null hypothesis when the null hypothesis is true")


. Not rejecting HO when it is false. Accepting HO")


? The p = value chosen (p")

 Error With a very extreme significance level: Greater probability to not")


: Doesn't sayhow")


- Slides: 44
Hypothesis Testing Chapter 6 Inferential Statistics: Making inferences about populations based on samples
Chapter Outline Hypothesis-Testing The Core Logic of Hypothesis Testing The Hypothesis-Testing Process One-Tailed and Two-Tailed Hypothesis Tests Decision Errors
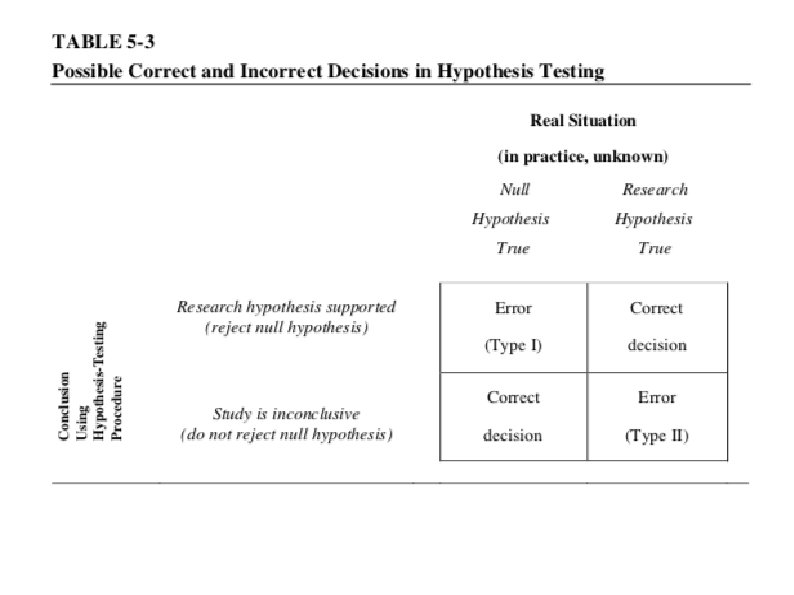
Decision Errors When the right procedures lead to the wrong decisions In spite of calculating everything correctly, conclusions drawn from hypothesis testing can still be incorrect. This is possible because you are making decisions about populations based on information in samples. Hypothesis testing is based on probability.
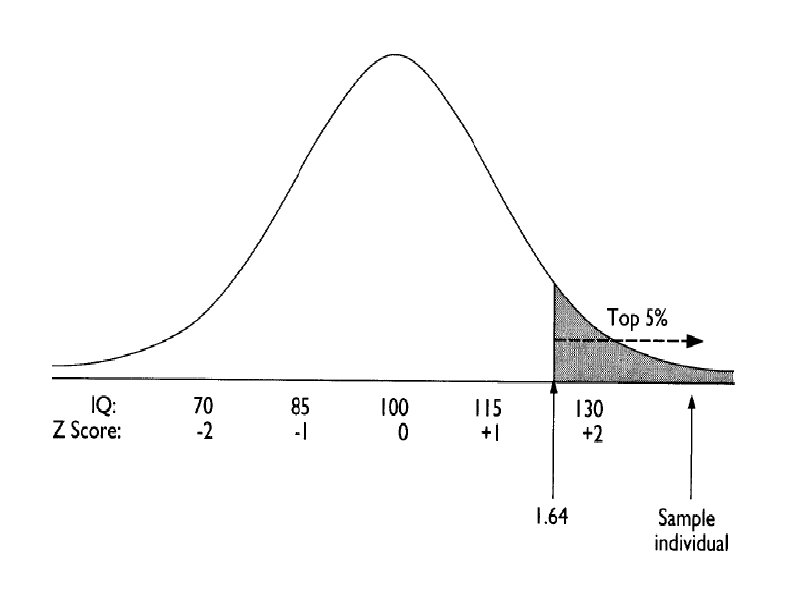
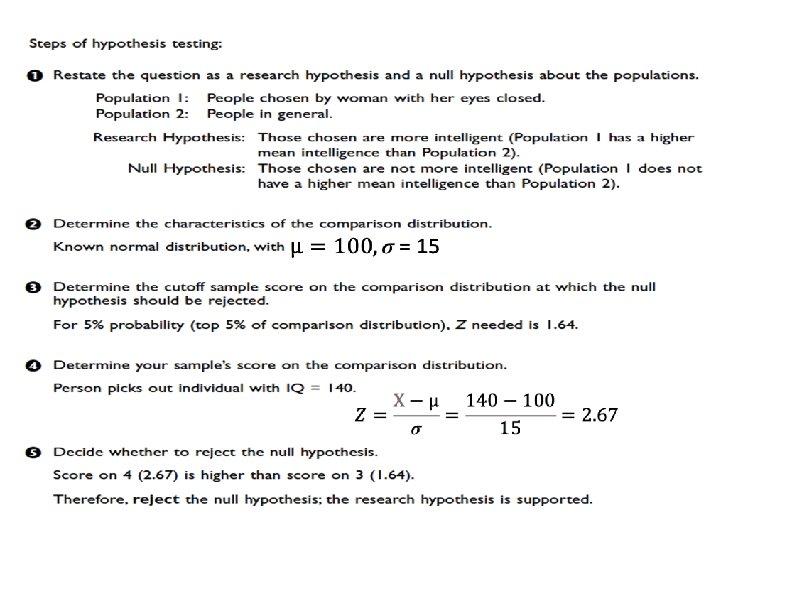
Hypothesis Testing Principle A person says that she can identify people of above average intelligence with her eyes closed. Is this true? 1. Define Populations & reframe hypotheses about populations Population 1: People chosen by woman Population 2: People in general (Known) H 1: µ 1 > Population µ 2 H 0: µ 1= µ 2 2. Characteristics of the comparison distribution Known normal distribution with µ = 100; σ = 16
TYPE I ERROR α 3. Determine the Cutoff Sample scores on the comparison distribution (criterion) at which the null hypothesis should be rejected (p =. 5) 50% probability (top 50%), Z needed is 0 A 30% Probability (top 30%)? Z =. 524
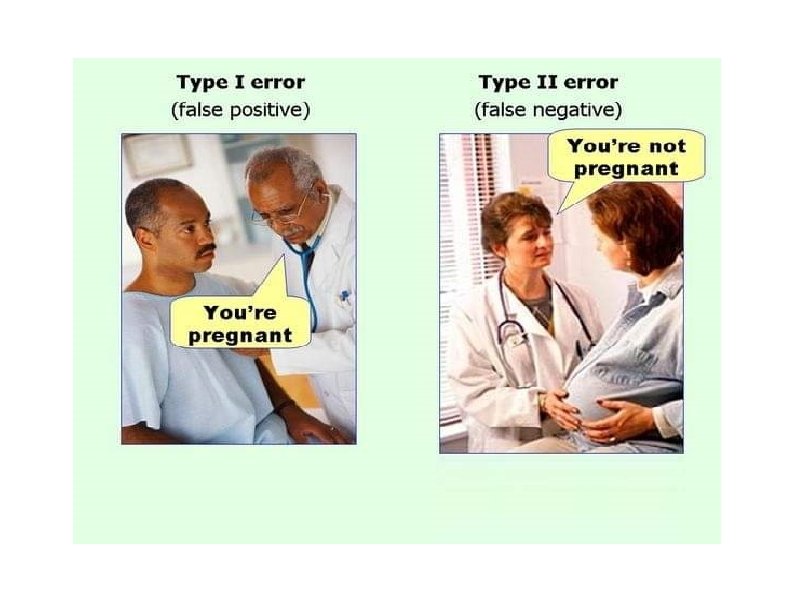
Type I (α) Error Rejecting the null hypothesis when the null hypothesis is true You find an effect when in fact there is no effect. A Type I error is a serious error as theories, research programs, treatment programs, and social programs are often based on conclusions of research studies. The chance of making a Type I error is the same as the significance level. If the significance level was set at p <. 01, there is less than a 1% chance that you could have gotten your result if the null hypothesis was true. Reduce chance of making a Type I error by decreasing significance level (e. g. , p <. 001).
Outcomes of Hypothesis Testing Type I error Reject the null hypothesis when it is correct. Saying there is a difference when there is not a difference We are rejecting a true null hypothesis. Accepting a research hypothesis when in fact it is not true
Acceptance Area Rejection Area
Acceptance Area Rejection Area
Type II Error ( ß). Not rejecting HO when it is false. Accepting HO when it is false. Saying there is not a difference when in fact there is a difference Why? Because the critical value (p <. 001) may be too extreme or low, and maybe sample representative. There maybe a difference but p value to low.
Type II Error With a very extreme significance level, there is a greater probability that you will not reject the null hypothesis when the research hypothesis is actually true. concluding that there is no effect when there is actually an effect The probability of making a Type II error can be reduced by setting a very lenient significance level (e. g. , p <. 10).
Relationship Between Type I and Type II Errors Decreasing the probability of a Type I error increases the probability of a Type II error. The compromise is to use standard significance levels of p <. 05 and p <. 01.
Probability of making a Type I error (α)? The p = value chosen (p <. 05): Probability of Type I error is 5 out of 100. This is why we do not use p’s =. 2 (20 out 100). The smaller the prob of Type I Error the more we are controlling: p <. 001 A p =. 2 increase Type I error.
TYPE II ERROR β 3. Determine the Cutoff Sample scores on the comparison distribution (criterion) at which the null hypothesis should be rejected (p =. 05) p = 5 % (top 5%), Z = 1. 64 p = 2. 5 % (top 2. 3 %), Z = 1. 96 p =1 % (top 1%), Z = 2. 33 How about a p <. 001 or a p <. 0001
Type II (ß) Error With a very extreme significance level: Greater probability to not reject H 0 when the H 1 is actually true. Concluding that there is no effect when there is actually an effect Reduce Type II error by increasing p-value (e. g. , p <. 10)
Acceptance Area Rejection Area
Acceptance Area Rejection Area
Acceptance Area Rejection Area
Acceptance Area Rejection Area
Acceptance Area Rejection Area
Acceptance Area Rejection Area
Acceptance Area Rejection Area
Type II Error a Very High Price to Pay for Theory building: Sometimes we may abandon a particular good theory because of a small p value. Practical applications of a particular treatment Which one to use? Control Type I error by using small p (. 0001) Control Type II error by increasing p (. 2 or. 3) Use conventional values: . 01 and. 05.
Relationship Between α and β Errors Decreasing the probability of a Type I error increases the probability of a Type II error. The compromise is to use standard significance levels of p <. 05 and p <. 01.
Type I ERROR Type II ERROR
One- and Two-Tailed Tests Researcher predicts direction of HA < or > ANACIN improves memory Experimental Group will score higher than Control group Population 1 = group received Anacin Population 2 = group did not receive it H 1= Pop. 1 Remember more words than Pop. 2 Ho=Pop. 2 not remember more words than Pop. 1
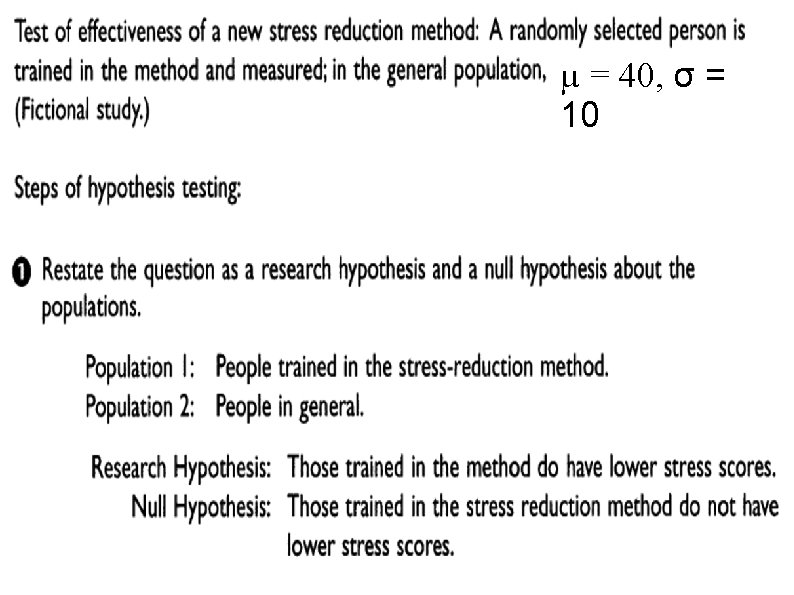
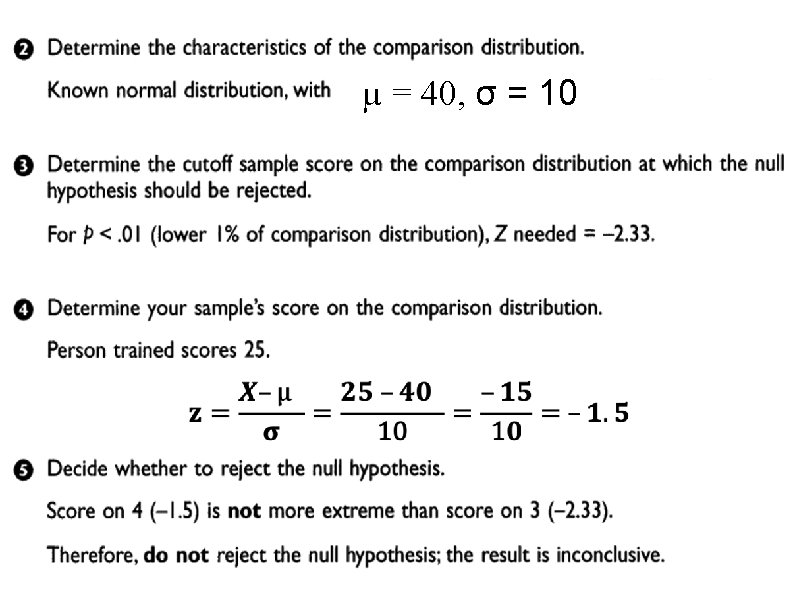
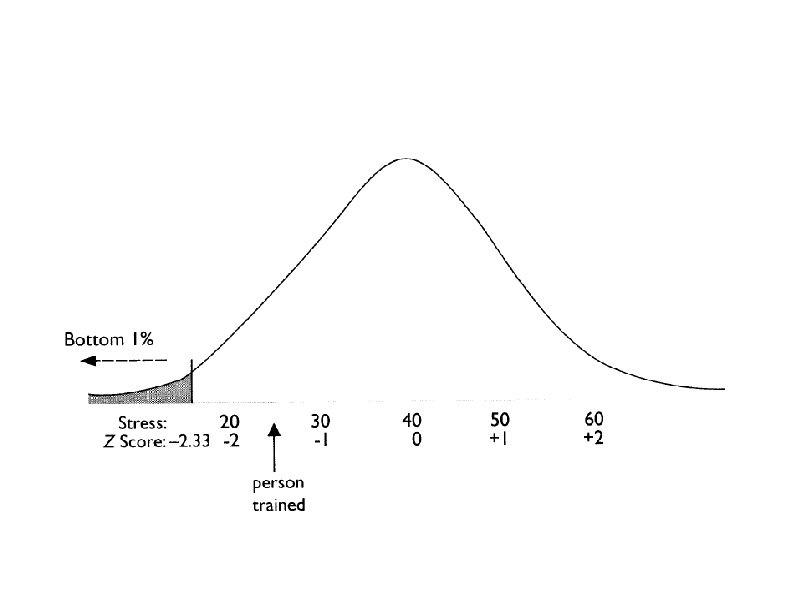
One- and Two-Tailed Tests One-Tailed Test: A directional hypothesis: it predicts a direction of result. Also called a one-tailed test: hypothesis test looks for an extreme result at just one end (high or low end) of the curve. Psychic (high end) Stres-reduction-method example (low end)
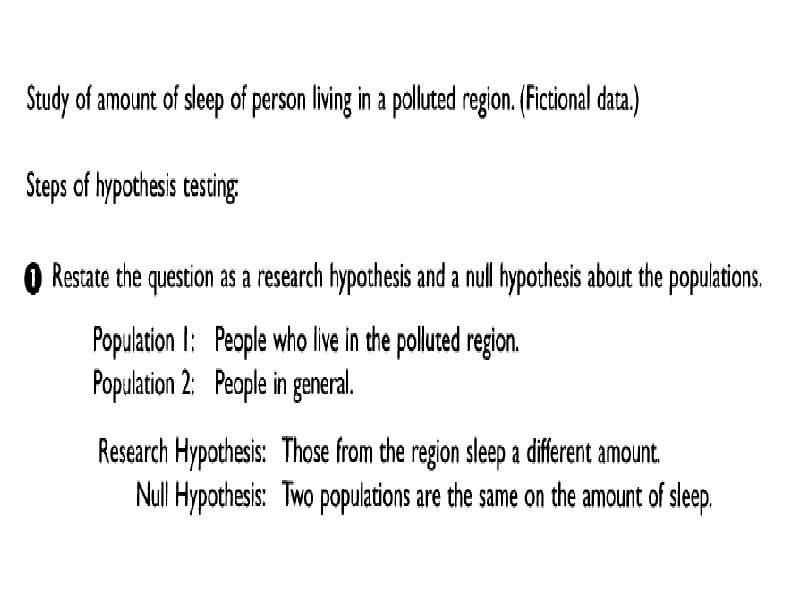
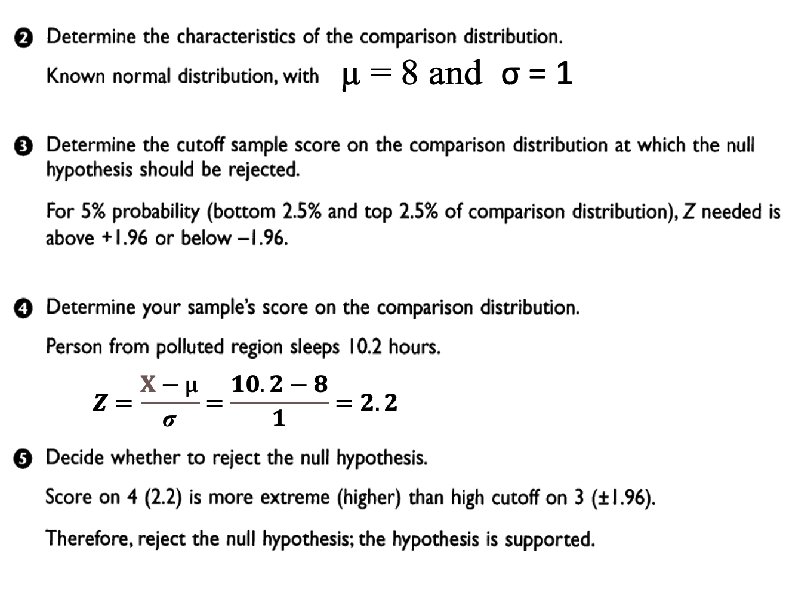
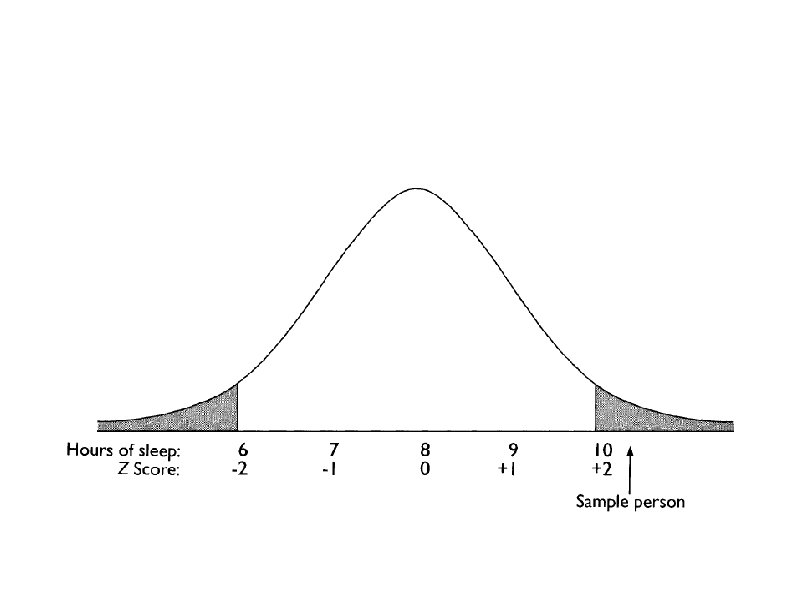
Two-Tailed Tests Experimental treatment will make a difference: Two-tailed test (non directional): Doesn't sayhow high or how low. Extreme results: Either extreme or tail (a lot or a little sleep) would make us reject the Ho Example: A polluting substance accidentally put in the water in a particular region may be suspected to affect the part of the brain that controls sleep, but it is not known whether it will increase or decrease amount of sleep.
Non-directional hypothesis: polluting substance to affect sleep BUT no direction of effect specified. In setting the cutoff for rejecting H 0 p <. 05) value divided between the two tails. 05/2 =. 025 or 2. 5% at each side. To be significant, score more extreme than if a onetailed test
One-Tailed or Two-Tailed Tests Use a one-tailed test when you have a clearly directional hypothesis (Theory Driven) Use a two-tailed test when you have a clearly non-directional hypothesis (Don't know which way). With a one-tailed test, if the sample score is extreme—but in the opposite direction—the null cannot be rejected. Often researchers will use two-tailed tests even if the hypothesis is directional (As protection!)
When to Use One-Tailed or Two. Tailed Tests Use a one-tailed test when you have a clearly directional hypothesis. Use a two-tailed test when you have a clearly nondirectional hypothesis. With a one-tailed test, if the sample score is extreme—but in the opposite direction—the null cannot be rejected. Often researchers will use two-tailed tests even if the hypothesis is directional.
Hypothesis Tests as Reported in Research Articles In research articles, for each result of interest, the researcher usually says whether the result was statistically significant. The researcher gives the symbol for the specific method used in figuring out the probabilities. There will be an indication of significance level (e. g. , p <. 05 or p <. 01). Usually a two-tailed test is used; if this is not the case, the researcher will generally specify that a one-tailed test was used.
Key Points Hypothesis testing considers the probability that the results of a study could have come about even if the experimental procedure had no effect. If this probability is low, the scenario of no effect is rejected and the hypothesis behind the experimental procedure is supported. The expectation of an effect is the research hypothesis; the hypothetical situation of no effect is the null hypothesis. When a result is so extreme that it would be very unlikely if the null hypothesis were true, the null hypothesis is rejected and the research hypothesis is supported. If the result is not that extreme, the researcher does not reject the null hypothesis and the study is inconclusive. Behavioral and social scientists usually consider a result extreme enough if it is less likely than 5% that you would get that result if the null hypothesis was true. A significance level of 1% is also commonly used in research. The cutoff percentage is the probability of the result being extreme in a predicted direction in a directional or onetailed test. The cutoff percentages are the probability of the result being extreme in either direction in a nondirectional or two-tailed test. Steps for hypothesis testing are: Restate the question as a research hypothesis and a null hypothesis about the population. Determine the characteristics of the comparison distribution. Determine the cutoff sample score on the comparison distribution at which the null hypothesis should be rejected. Determine your sample’s score on the comparison distribution. Decide whether to reject the null hypothesis. A Type I error is when a researcher rejects the null hypothesis but the null hypothesis is actually true. A Type II error is when a researcher does not reject the null hypothesis, but the null hypothesis is actually false. Research articles report the results of hypothesis testing by saying whether the results were significant, giving the cutoff sample score on the comparison distribution, and giving the probability level of the cutoff sample score.