Hypothesis test flow chart Test H 0 r0
 Table G 1 number")

 Testing the null hypothesis that a single correlation is equal to zero. The")
 Testing the null hypothesis that two independently sampled correlations are the same. The")

- Slides: 16
Hypothesis test flow chart Test H 0: r=0 (17. 2) Table G 1 number of correlations START HERE correlation (r) frequency data Measurement scale Means Test H 0: r 1= r 2 (17. 4) Tables H and A Yes 2 χ2 test for independence (19. 9) Table I 2 2 -way ANOVA Ch 21 Table E 1 2 z -test (13. 1) Table A number of variables Do you know s? 1 basic χ2 test (19. 5) Table I More than 2 number of means No 1 2 t -test (13. 14) Table D independent samples? s Ye Test H 0: m 1= m 2 (15. 6) Table D number of factors 1 -way ANOVA Ch 20 Table E No Test H 0: D=0 (16. 4) Table D
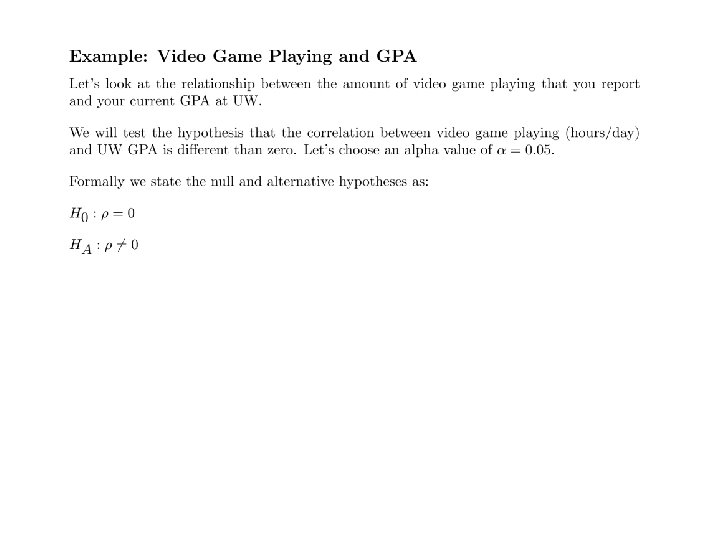
Chapter 16: Hypothesis Tests for Correlations We will make inferences about population correlations in two ways: 1) To test if a population has a correlation different from zero. 2) To test if two correlations are different from each other. We use the letter ‘r’ for sample correlations. We use the Greek symbol r (rho) for population correlations.
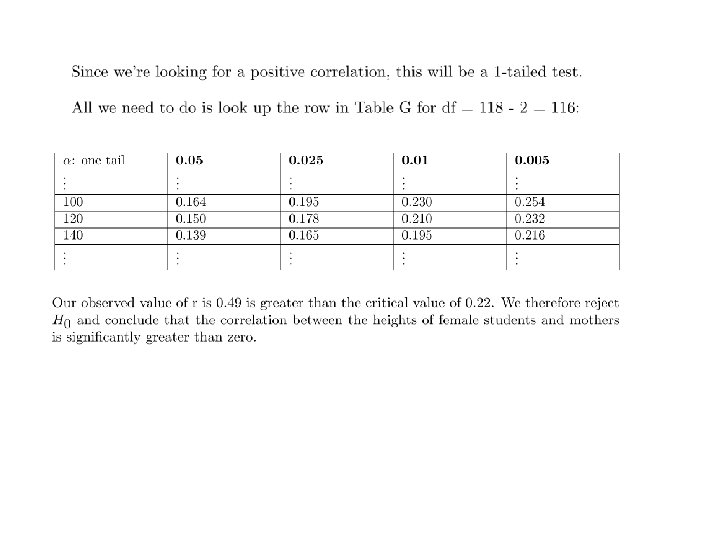
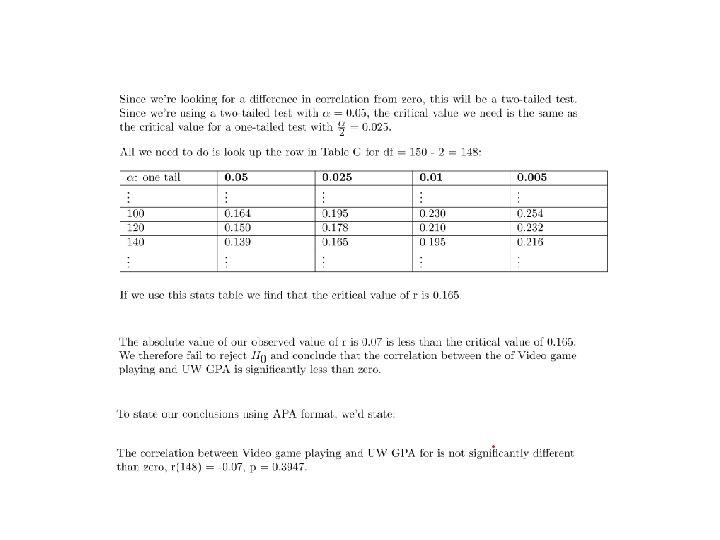
1) Testing the null hypothesis that a single correlation is equal to zero. The sampling distribution for r is very complicated and can be strongly skewed. However, for testing whether a sample is being drawn from a population with zero correlation, Ronald Fisher figured out an easy way to convert a sample correlation from r to t, so we can run a standard t-test: Using df = n-2, where n is the number of pairs in the correlation. I make it even easier by giving you Table G that provides critical values of r for values of a and df. We don’t have to convert from r to t, just look up the critical value for r in table G.
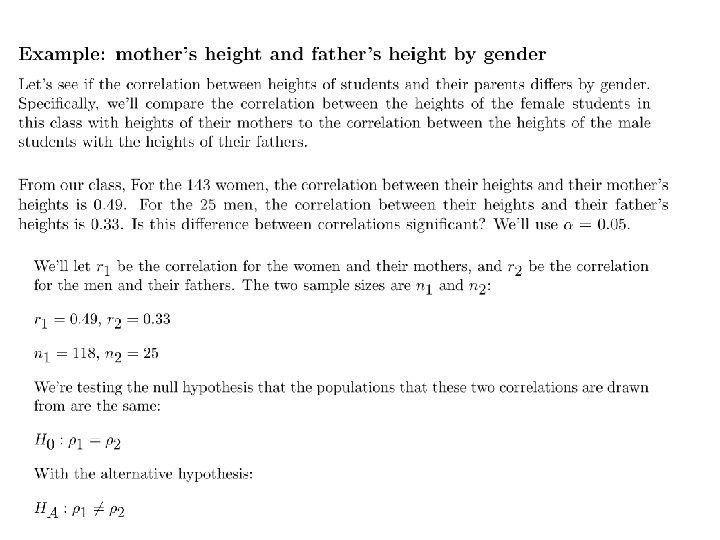
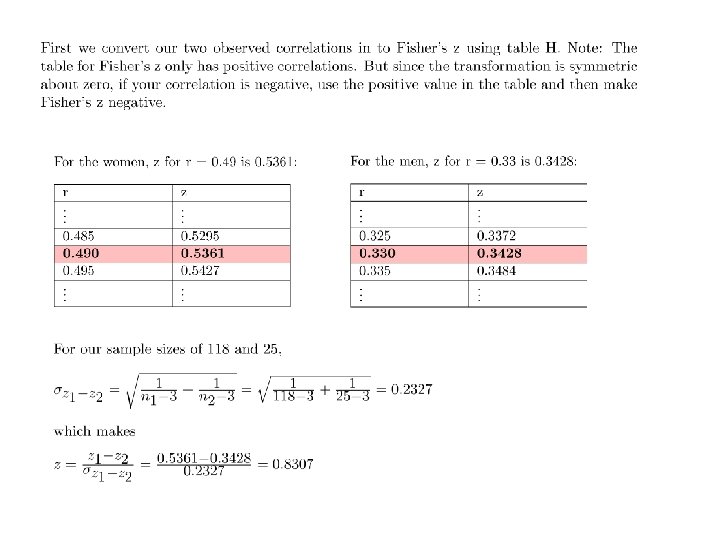
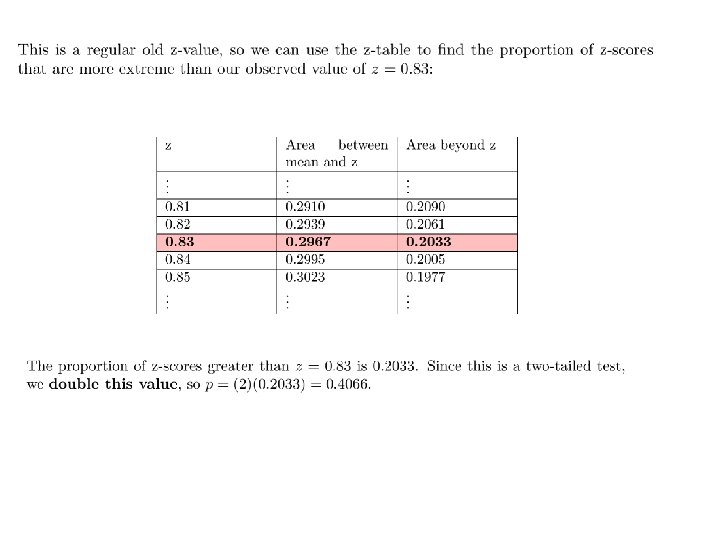
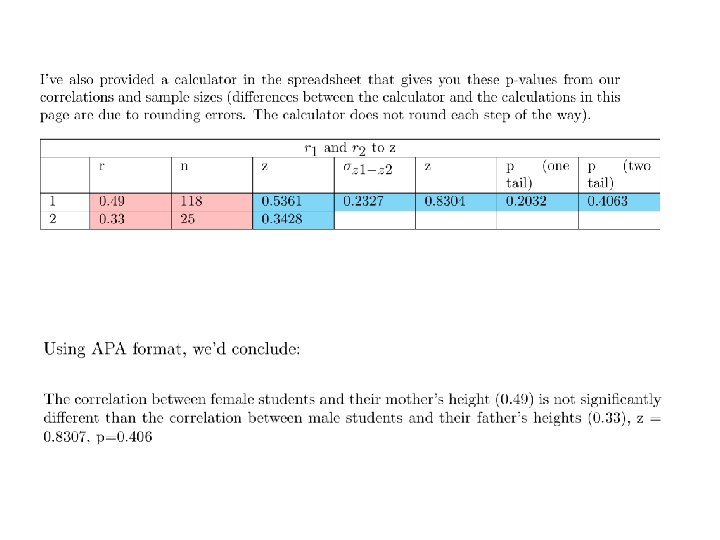
2) Testing the null hypothesis that two independently sampled correlations are the same. The sampling distribution of correlations becomes more and more skewed when the correlation of the population gets closer to 1 or -1. So comparing whether two correlations are different requires a more complicated conversion. Comparing two correlation values is done by first converting from r to Fisher’s z and then conducting a z-test where The spreadsheet provides Table H for converting from sample correlations r to z’ so you don’t have to use the formula. I’ve provided a version of table H along with a calculator in excel which you can download.
What does the probability distribution of correlations look like?