
Hypoglycemia Hyperglycemia Dave Joffe BSPharm CDE FACA Objectives
Hypoglycemia & Hyperglycemia Dave Joffe, BSPharm, CDE, FACA
Objectives: Define & assess blood sugar values Causes of hypoglycemia & hyperglycemia including normal causes and medically induced causes. Recognition of hypoglycemia & hyperglycemia Treatment of both hypoglycemia & hyperglycemia depending on the severity of the presentation. The bodies response to changes in blood sugar
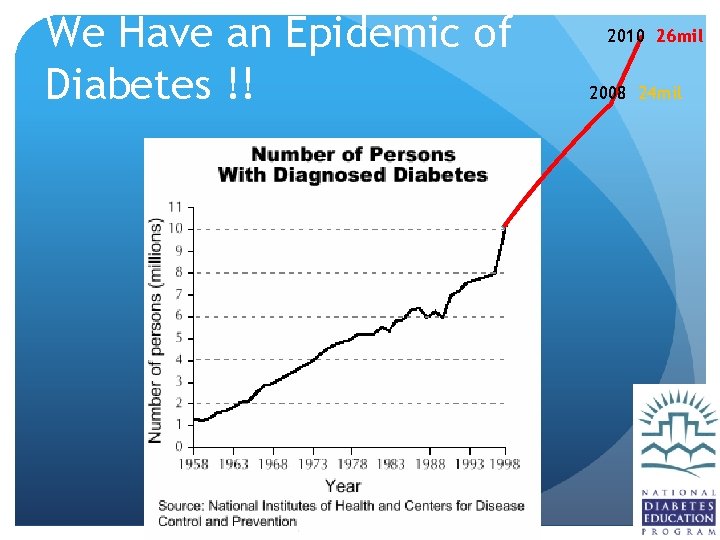
We Have an Epidemic of Diabetes !! 2010 26 mil 2008 24 mil
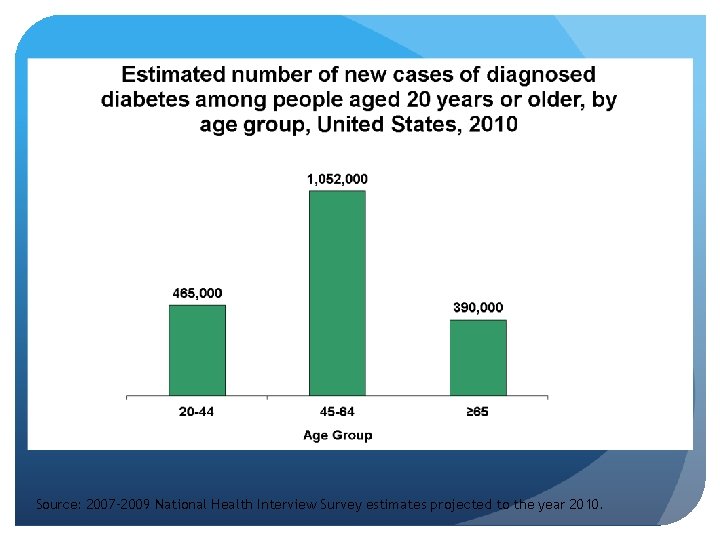
Source: 2007– 2009 National Health Interview Survey estimates projected to the year 2010.
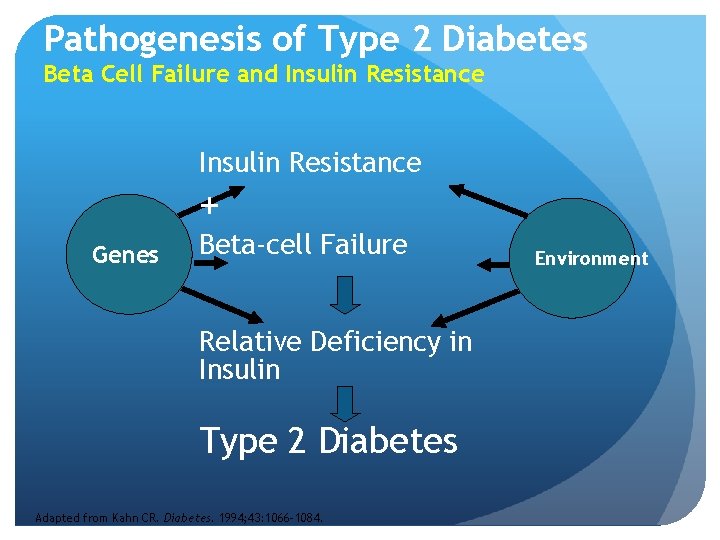
Pathogenesis of Type 2 Diabetes Beta Cell Failure and Insulin Resistance + Genes Beta-cell Failure Relative Deficiency in Insulin Type 2 Diabetes Adapted from Kahn CR. Diabetes. 1994; 43: 1066– 1084. Environment
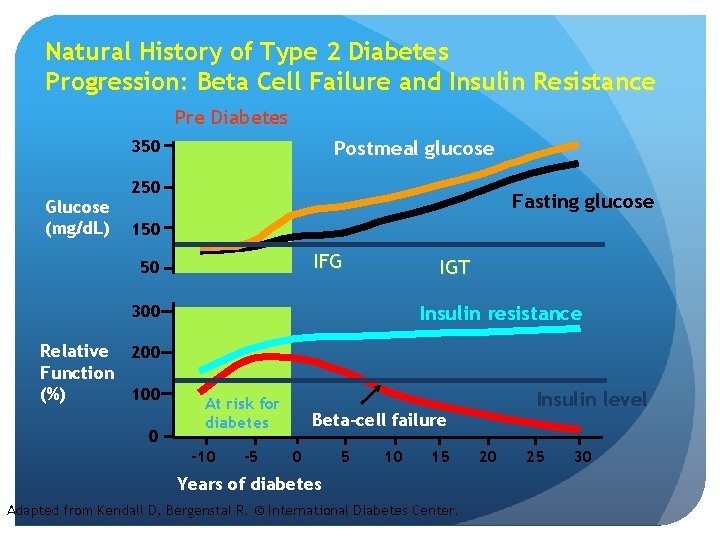
Natural History of Type 2 Diabetes Progression: Beta Cell Failure and Insulin Resistance Pre Diabetes 350 Glucose (mg/d. L) Postmeal glucose 250 Fasting glucose 150 IFG 50 IGT Insulin resistance 300 Relative 200 Function (%) 100 0 At risk for diabetes -10 -5 Insulin level Beta-cell failure 0 5 10 15 Years of diabetes Adapted from Kendall D, Bergenstal R. © International Diabetes Center. 20 25 30
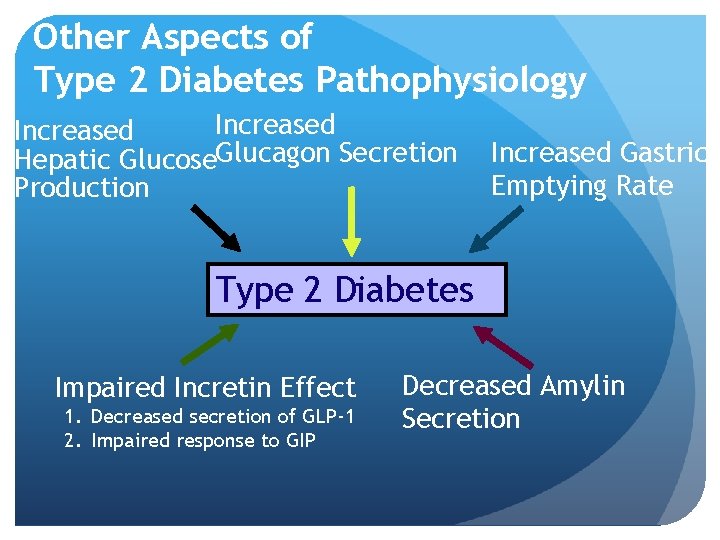
Other Aspects of Type 2 Diabetes Pathophysiology Increased Hepatic Glucose. Glucagon Secretion Production Increased Gastric Emptying Rate Type 2 Diabetes Impaired Incretin Effect 1. Decreased secretion of GLP-1 2. Impaired response to GIP Decreased Amylin Secretion
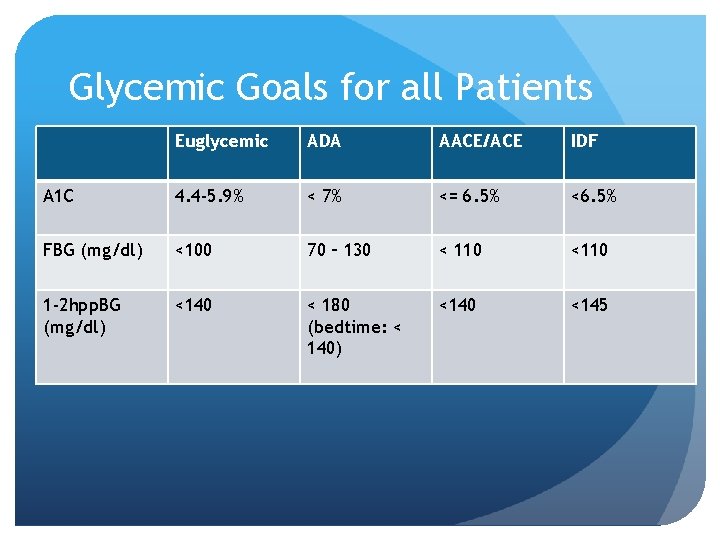
Glycemic Goals for all Patients Euglycemic ADA AACE/ACE IDF A 1 C 4. 4 -5. 9% < 7% <= 6. 5% <6. 5% FBG (mg/dl) <100 70 – 130 < 110 <110 1 -2 hpp. BG (mg/dl) <140 < 180 (bedtime: < 140) <140 <145
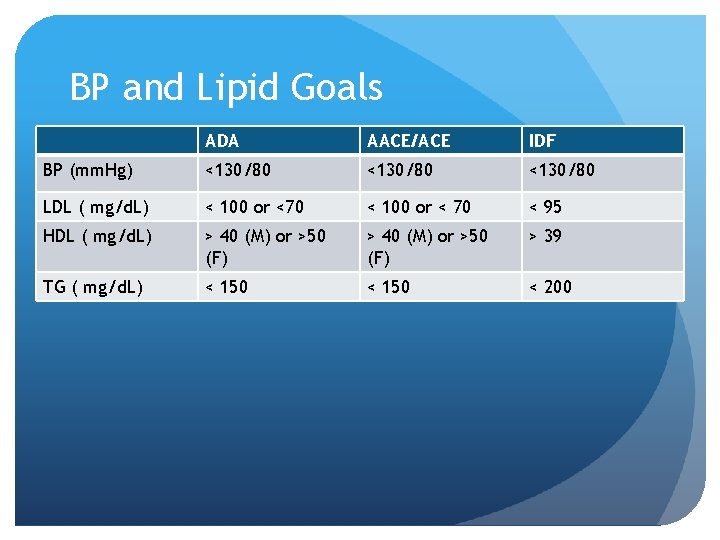
BP and Lipid Goals ADA AACE/ACE IDF BP (mm. Hg) <130/80 LDL ( mg/d. L) < 100 or <70 < 100 or < 70 < 95 HDL ( mg/d. L) > 40 (M) or >50 (F) > 39 TG ( mg/d. L) < 150 < 200
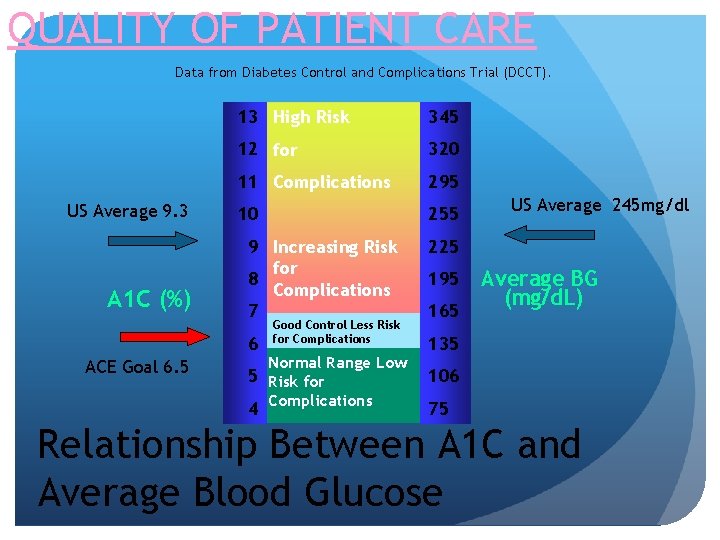
QUALITY OF PATIENT CARE Data from Diabetes Control and Complications Trial (DCCT). US Average 9. 3 A 1 C (%) ACE Goal 6. 5 13 High Risk 345 12 for 320 11 Complications 295 10 255 9 Increasing Risk for 8 Complications 7 225 6 135 Good Control Less Risk for Complications Normal Range Low 5 Risk for Complications 4 195 165 US Average 245 mg/dl Average BG (mg/d. L) 106 75 Relationship Between A 1 C and Average Blood Glucose
- Slides: 10