Hyperview Browser Trace signals search troubleshoot view live
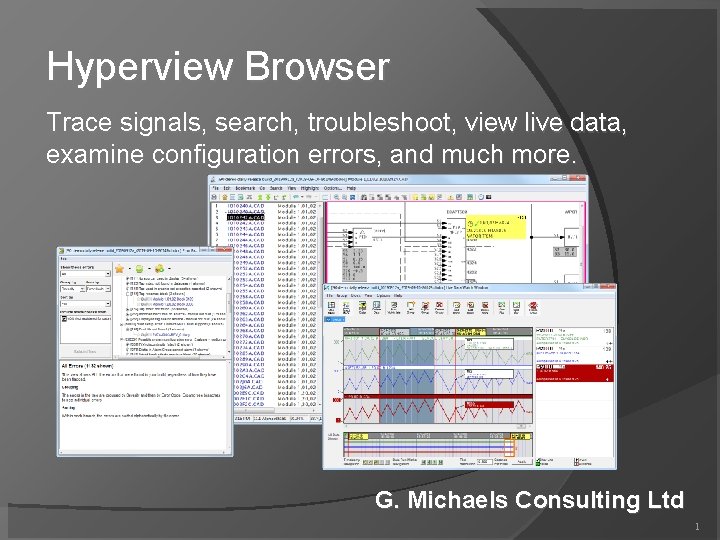
Hyperview Browser Trace signals, search, troubleshoot, view live data, examine configuration errors, and much more. G. Michaels Consulting Ltd 1
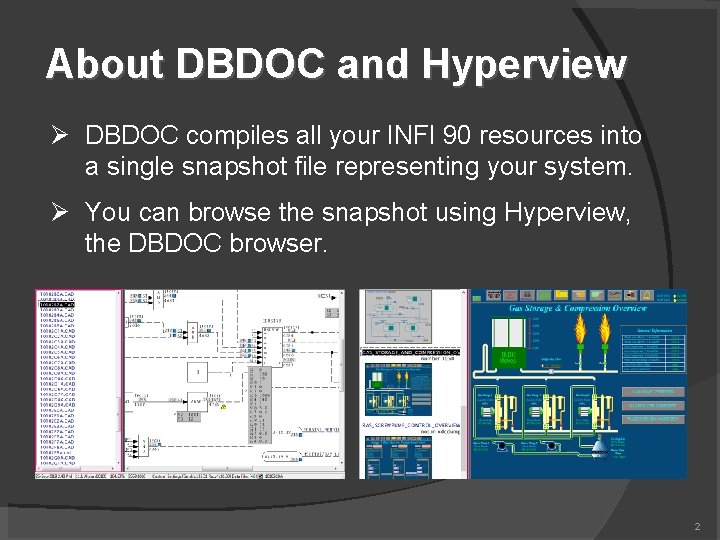
About DBDOC and Hyperview DBDOC compiles all your INFI 90 resources into a single snapshot file representing your system. You can browse the snapshot using Hyperview, the DBDOC browser. 2
2. 1. 1 How to run Hyperview From inside Build. Plus Open a project and click View project File button From a shortcut Most users have a shortcut to a shared Hyperview in a central location. From the Start menu, select Programs | GMCL DBDOC | Run Hyperview or Programs | GMCL DBDOC Hyperview | Run Hyperview Multiple Hyperview browser windows From inside Hyperview, start more browser windows with File | New Window. 3
2. 1. 1. 1 Running Hyperview from the command line (advanced) Hyperview can be launched from the command line. This allows fine-grained control of Hyperview options, and is necessary in order to define a shortcut. From the command line you can Specify the project file to be opened Specify the initial document to be displayed Disable continuous live data collection (See section 2. 5) Specify the default live data update interval See the documentation for more details. 4
2. 1. 2 How to load a project file Use the File menu to open a project file Use File | Recent Project Files to see recently viewed files Use * on the command line (in a shortcut) to automatically open the most recently built project file. Associate project files with Hyperview so they get opened automatically 5

2. 1 Associating project files with Hyperview in Windows To make Hyperview open when you double-click on an project file, do the following: 1. Go to the Start menu, click on Control Panel, locate the Folder Options icon and double-click on it. 2. In the Folder Options, click on the File Types tab. 3. Click the New button below the Registered File Types. In the File Extension box enter project as the File Type. 4. Once it is added click the Change button below the File Types box. 5. Select the program to open the file from a list selection. 6. Browse to C: Program FilesGMCLDBDOCPrograms and select hyperview. exe as the program to open the file. 6
2. 1. 3 Help and documentation Use the Help menu to automatically bring up application help Go to the GMCL website (gmcl. com) to access online help Help | Project File Build Revision tells which version of Hyperlink built the current project Help | About shows the Hyperview version 7
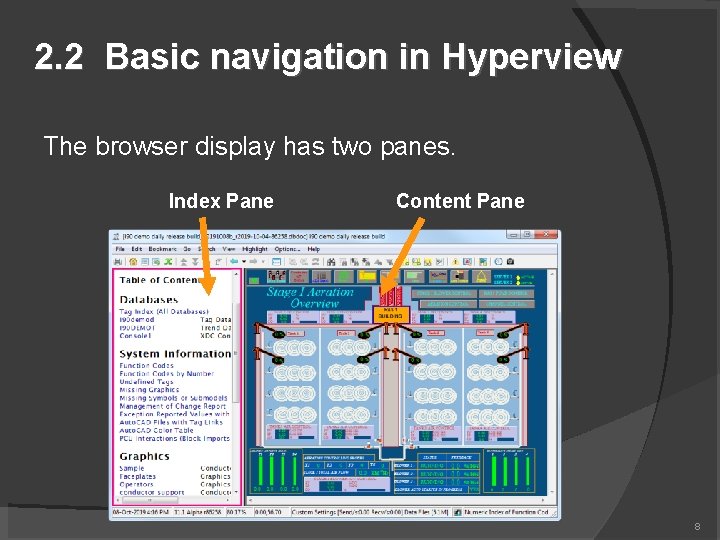
2. 2 Basic navigation in Hyperview The browser display has two panes. Index Pane Content Pane 8
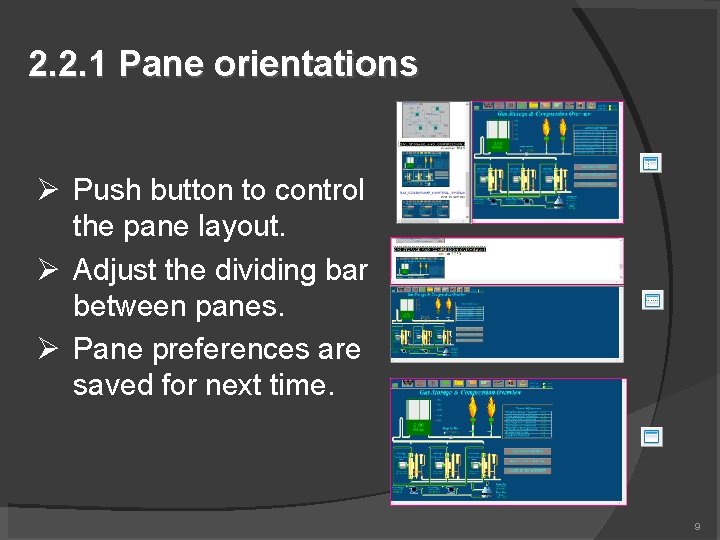
2. 2. 1 Pane orientations Push button to control the pane layout. Adjust the dividing bar between panes. Pane preferences are saved for next time. 9
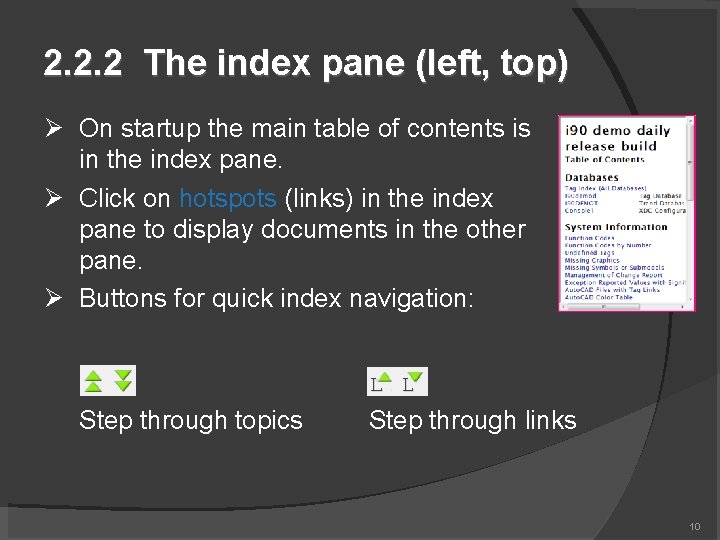
2. 2. 2 The index pane (left, top) On startup the main table of contents is in the index pane. Click on hotspots (links) in the index pane to display documents in the other pane. Buttons for quick index navigation: Step through topics Step through links 10
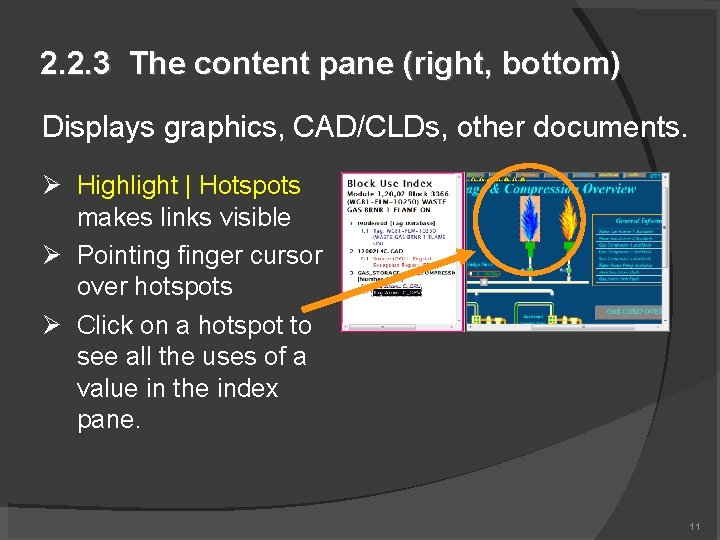
2. 2. 3 The content pane (right, bottom) Displays graphics, CAD/CLDs, other documents. Highlight | Hotspots makes links visible Pointing finger cursor over hotspots Click on a hotspot to see all the uses of a value in the index pane. 11
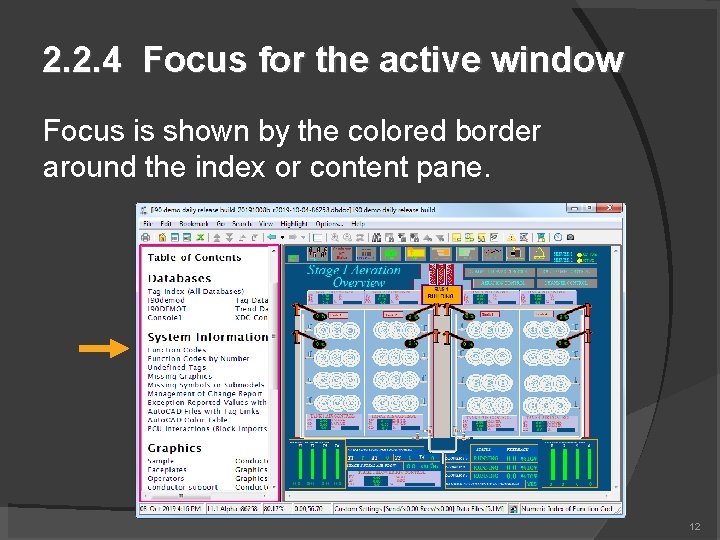
2. 2. 4 Focus for the active window Focus is shown by the colored border around the index or content pane. 12
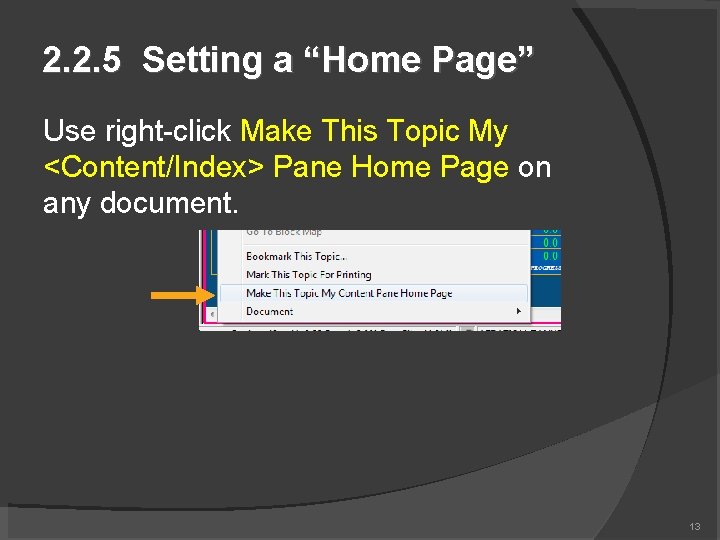
2. 2. 5 Setting a “Home Page” Use right-click Make This Topic My <Content/Index> Pane Home Page on any document. 13
2. 2. 6 Scrolling Use the mouse scroll wheel to scroll up and down in the index and content panes. Ctrl+scroll to zoom in index pane. Ctrl+scroll to move left and right in content pane 14
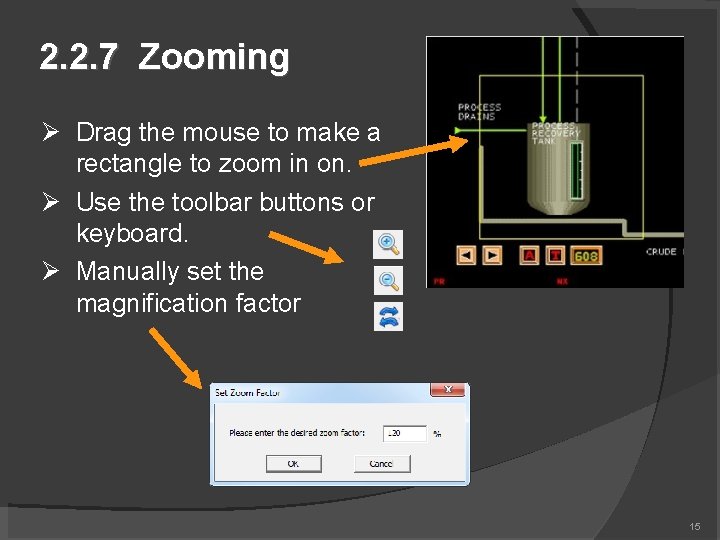
2. 2. 7 Zooming Drag the mouse to make a rectangle to zoom in on. Use the toolbar buttons or keyboard. Manually set the magnification factor 15
2. 2. 8 Using browser history Hyperview history support is similar to that of other browsers like Internet Explorer. Go Back Go Forward The black arrow shows you everything in the history. 16
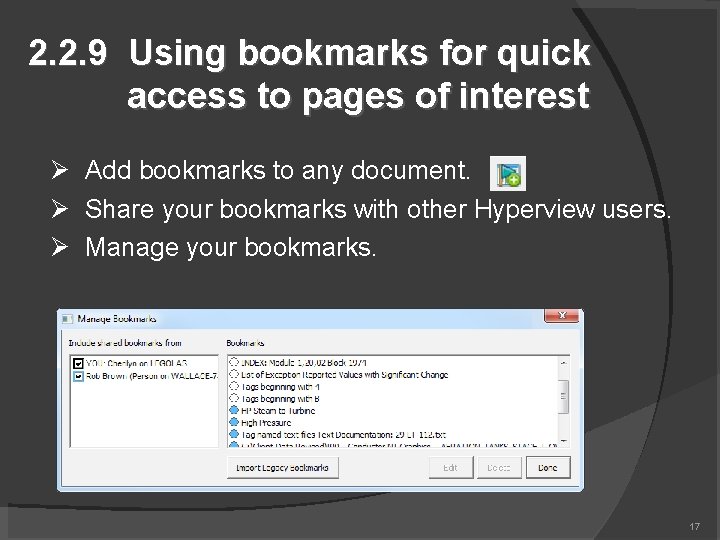
2. 2. 9 Using bookmarks for quick access to pages of interest Add bookmarks to any document. Share your bookmarks with other Hyperview users. Manage your bookmarks. 17
2. 3 Techniques for signal tracing Two methods for signal tracing 1. Click on a hotspot in the content pane to see its uses in the index pane. 2. Double click on a hotspot in the content pane to jump directly to its source or one of its uses. 18
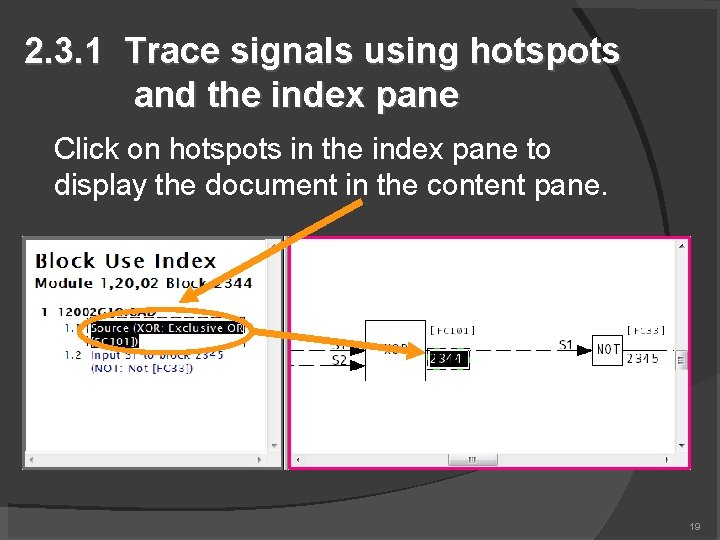
2. 3. 1 Trace signals using hotspots and the index pane Click on hotspots in the index pane to display the document in the content pane. 19
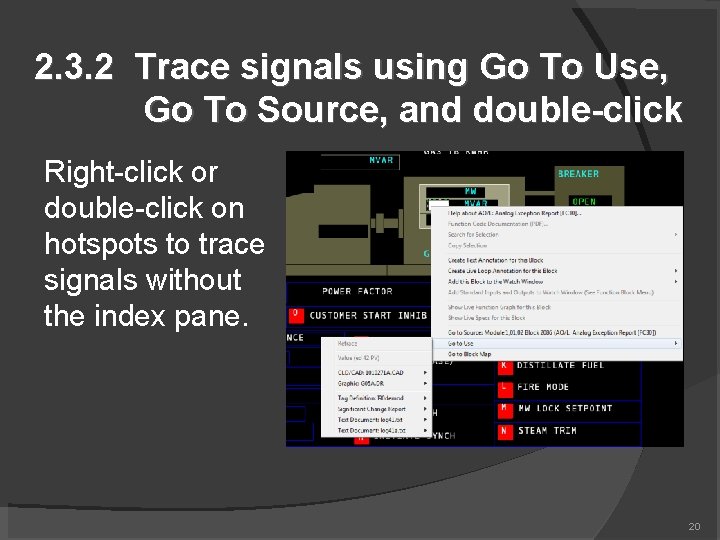
2. 3. 2 Trace signals using Go To Use, Go To Source, and double-click Right-click or double-click on hotspots to trace signals without the index pane. 20
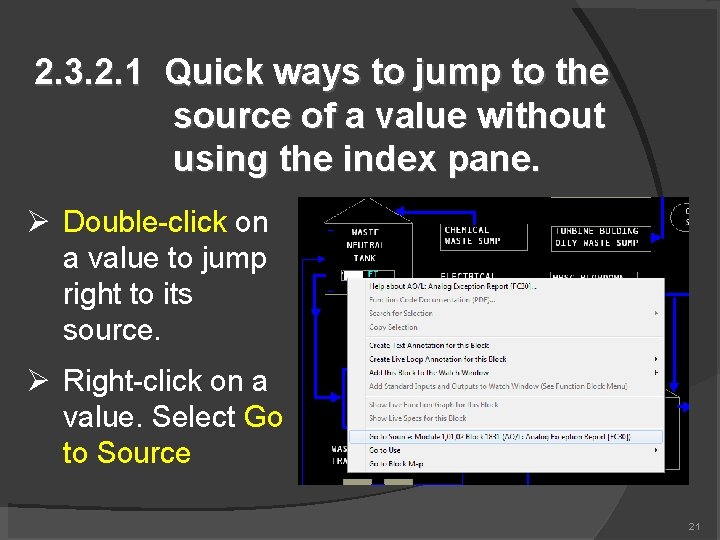
2. 3. 2. 1 Quick ways to jump to the source of a value without using the index pane. Double-click on a value to jump right to its source. Right-click on a value. Select Go to Source 21
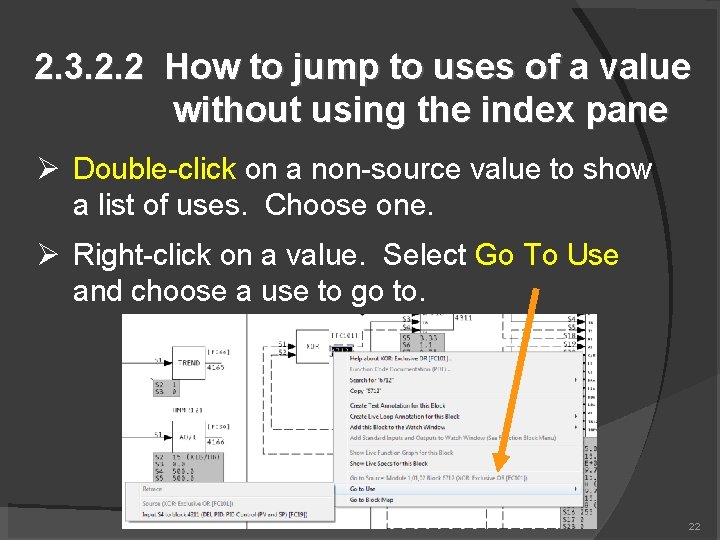
2. 3. 2. 2 How to jump to uses of a value without using the index pane Double-click on a non-source value to show a list of uses. Choose one. Right-click on a value. Select Go To Use and choose a use to go to. 22
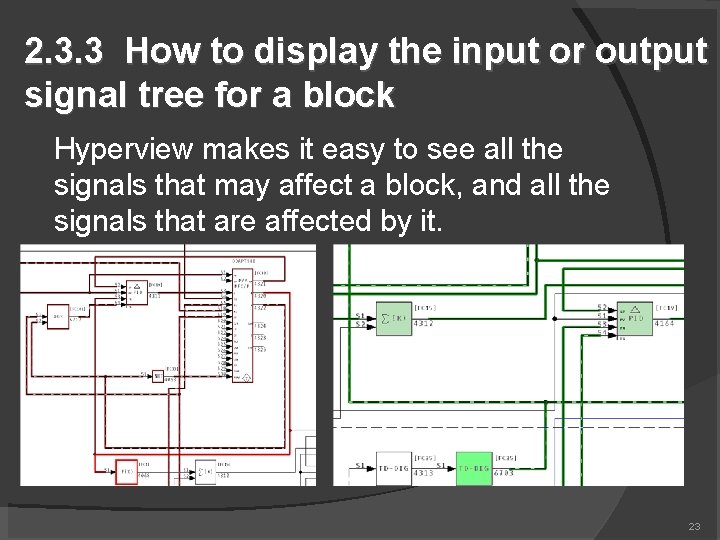
2. 3. 3 How to display the input or output signal tree for a block Hyperview makes it easy to see all the signals that may affect a block, and all the signals that are affected by it. 23
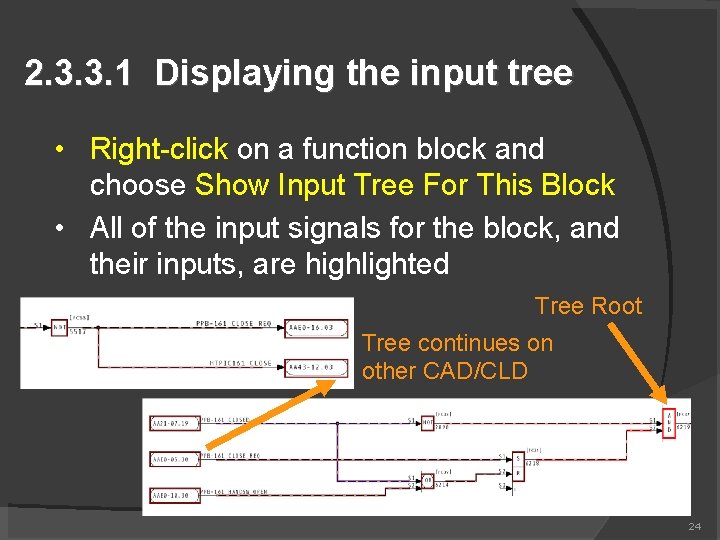
2. 3. 3. 1 Displaying the input tree • Right-click on a function block and choose Show Input Tree For This Block • All of the input signals for the block, and their inputs, are highlighted Tree Root Tree continues on other CAD/CLD 24
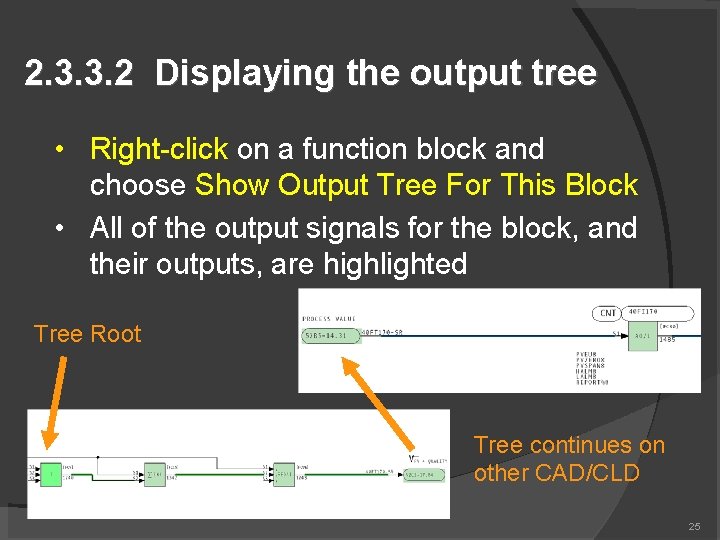
2. 3. 3. 2 Displaying the output tree • Right-click on a function block and choose Show Output Tree For This Block • All of the output signals for the block, and their outputs, are highlighted Tree Root Tree continues on other CAD/CLD 25
2. 4 Searching text, topic titles, databases, and finding coordinates Hyperview makes it easy to search. Full text search Database search Search all titles The icon will show your most recent search type. 26
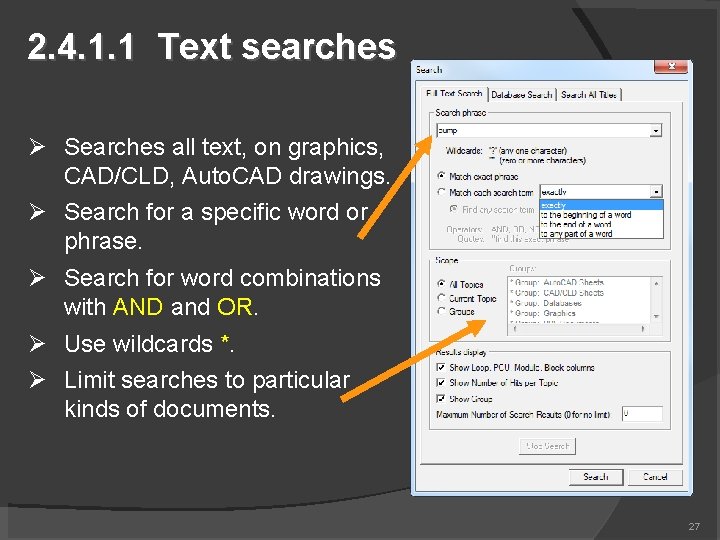
2. 4. 1. 1 Text searches Searches all text, on graphics, CAD/CLD, Auto. CAD drawings. Search for a specific word or phrase. Search for word combinations with AND and OR. Use wildcards *. Limit searches to particular kinds of documents. 27
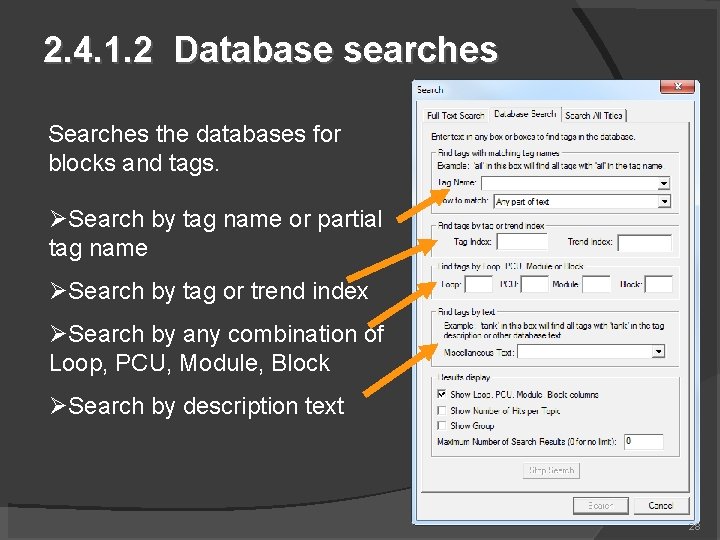
2. 4. 1. 2 Database searches Searches the databases for blocks and tags. Search by tag name or partial tag name Search by tag or trend index Search by any combination of Loop, PCU, Module, Block Search by description text 28
2. 4. 1. 3 Search result options You can specify what information is displayed with your search results. Show search hit frequency Show topic groups hits are found in Show Loop, PCU, Module, Block of results Limit the number of search hits displayed 29
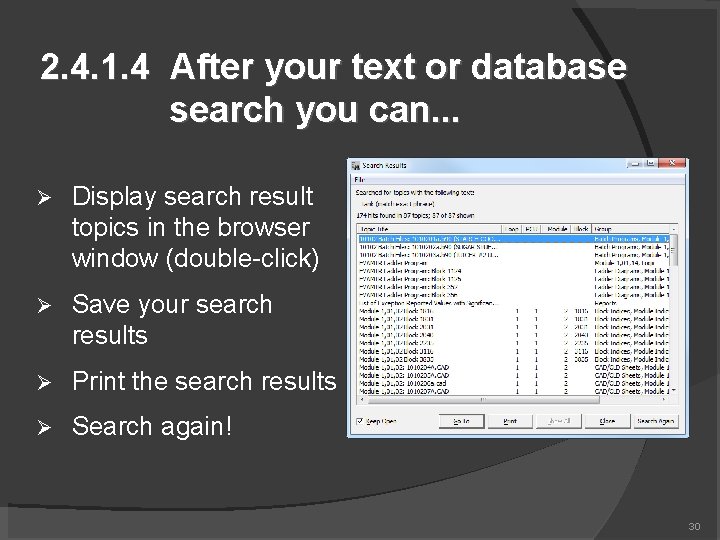
2. 4. 1. 4 After your text or database search you can. . . Display search result topics in the browser window (double-click) Save your search results Print the search results Search again! 30
2. 4. 1. 5 Displaying and stepping through search results You can step through search results without the search results dialog using toolbar buttons. Next search hit in topic Previous search hit in topic Next topic in search results Previous topic in search results 31
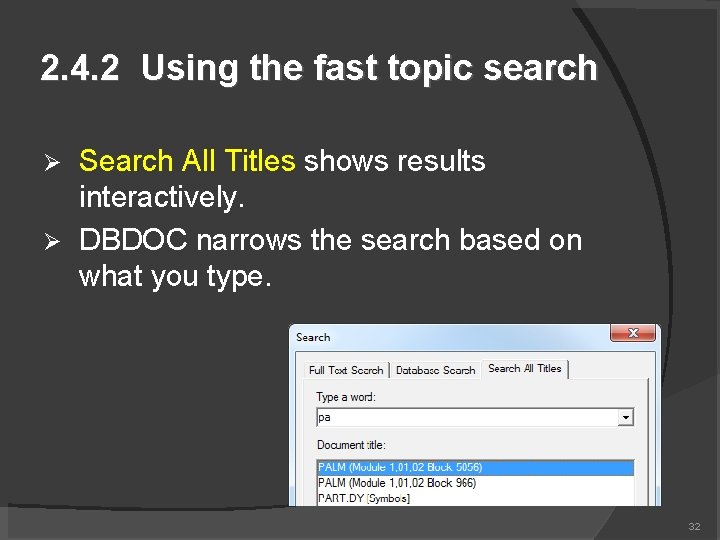
2. 4. 2 Using the fast topic search Search All Titles shows results interactively. DBDOC narrows the search based on what you type. 32
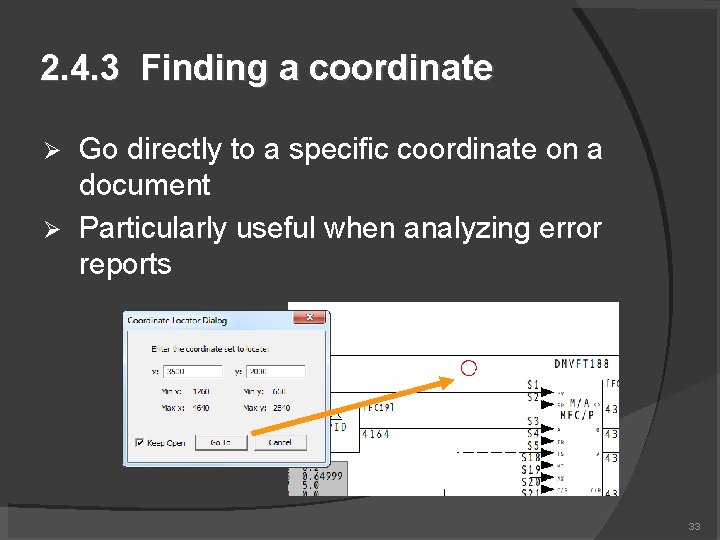
2. 4. 3 Finding a coordinate Go directly to a specific coordinate on a document Particularly useful when analyzing error reports 33
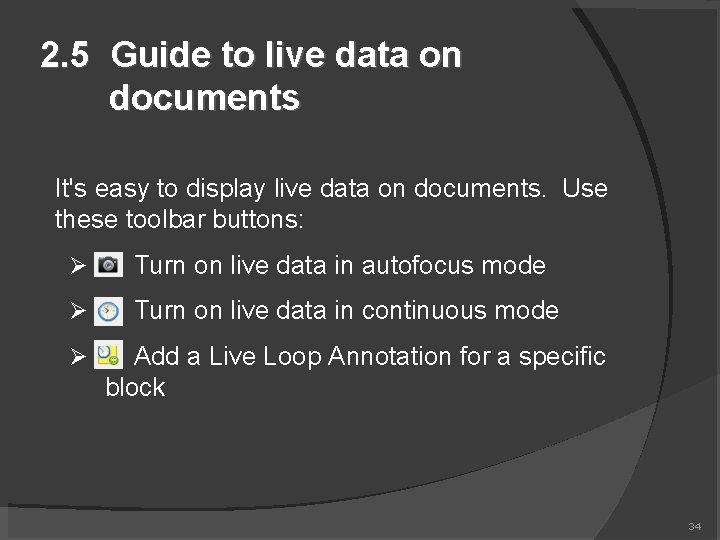
2. 5 Guide to live data on documents It's easy to display live data on documents. Use these toolbar buttons: Turn on live data in autofocus mode Turn on live data in continuous mode Add a Live Loop Annotation for a specific block 34
2. 5. 1. 1 Live data in Autofocus mode Press to turn on live data in Autofocus mode. In this mode, live data is refreshed when you change documents move around or zoom in a document or click on the camera button Autofocus mode is the most efficient way to collect live data Values will turn gray when they are considered “stale” 35
2. 5. 1. 2 Getting live data in Continuous mode Press to turn on live data in Continuous mode updates live data at a set interval The update interval can be changed in the Options | View dialog Continuous mode is automatically turned off when you change documents 36
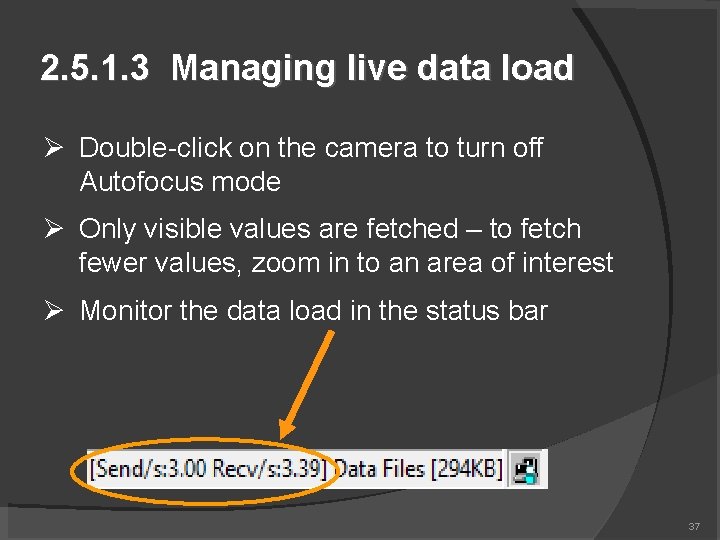
2. 5. 1. 3 Managing live data load Double-click on the camera to turn off Autofocus mode Only visible values are fetched – to fetch fewer values, zoom in to an area of interest Monitor the data load in the status bar 37
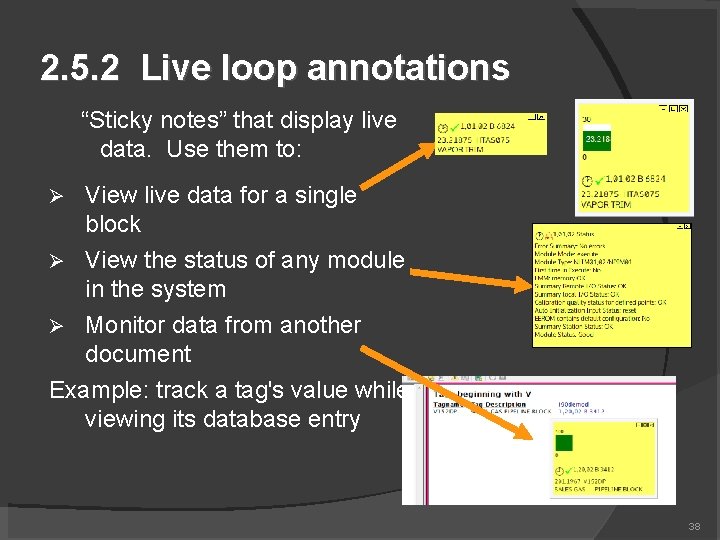
2. 5. 2 Live loop annotations “Sticky notes” that display live data. Use them to: View live data for a single block View the status of any module in the system Monitor data from another document Example: track a tag's value while viewing its database entry 38
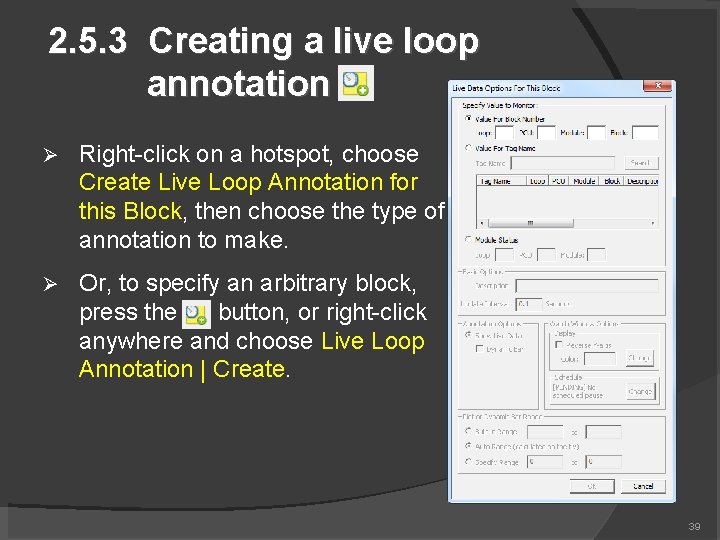
2. 5. 3 Creating a live loop annotation Right-click on a hotspot, choose Create Live Loop Annotation for this Block, then choose the type of annotation to make. Or, to specify an arbitrary block, press the button, or right-click anywhere and choose Live Loop Annotation | Create. 39
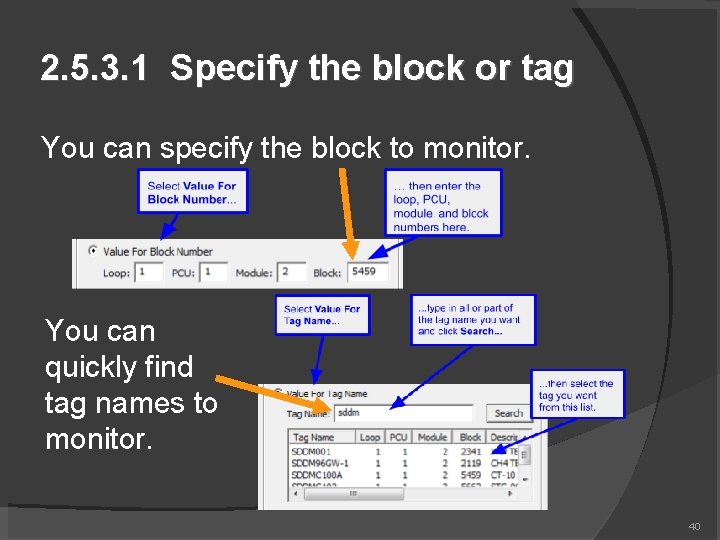
2. 5. 3. 1 Specify the block or tag You can specify the block to monitor. You can quickly find tag names to monitor. 40
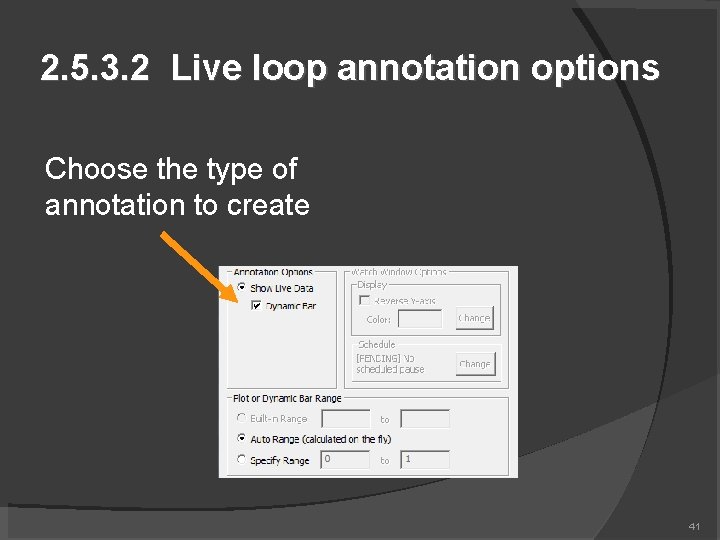
2. 5. 3. 2 Live loop annotation options Choose the type of annotation to create 41
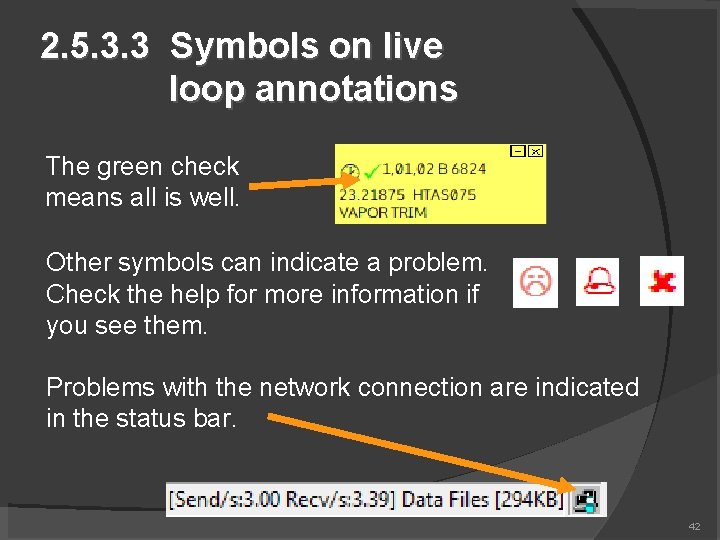
2. 5. 3. 3 Symbols on live loop annotations The green check means all is well. Other symbols can indicate a problem. Check the help for more information if you see them. Problems with the network connection are indicated in the status bar. 42
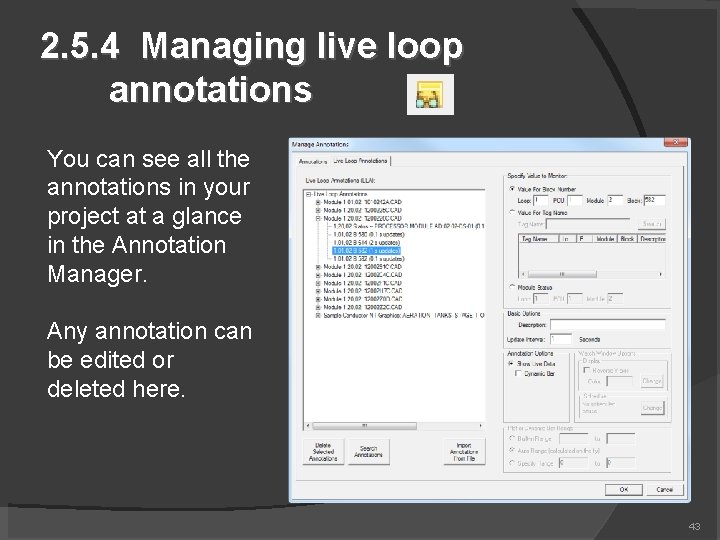
2. 5. 4 Managing live loop annotations You can see all the annotations in your project at a glance in the Annotation Manager. Any annotation can be edited or deleted here. 43
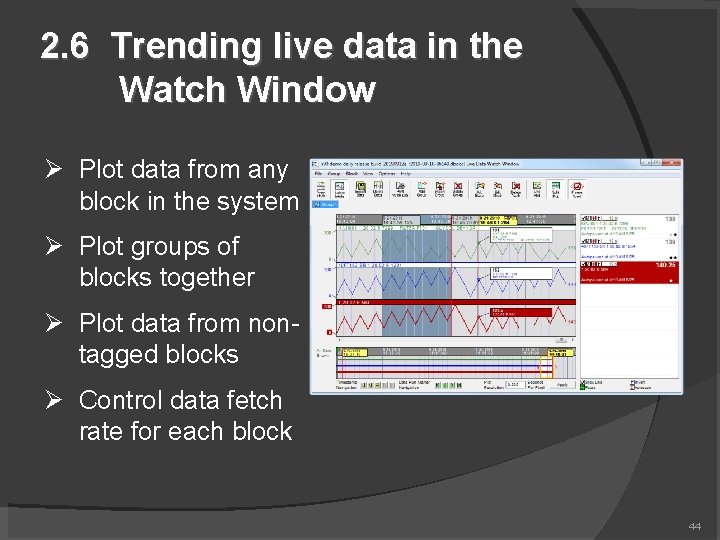
2. 6 Trending live data in the Watch Window Plot data from any block in the system Plot groups of blocks together Plot data from nontagged blocks Control data fetch rate for each block 44
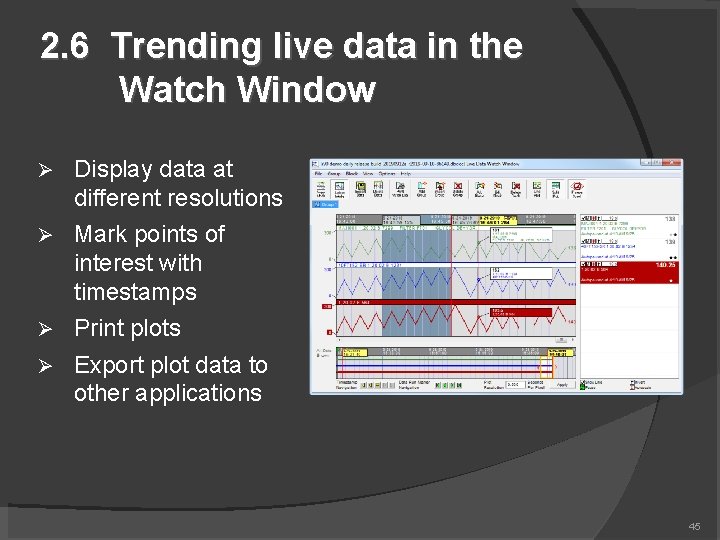
2. 6 Trending live data in the Watch Window Display data at different resolutions Mark points of interest with timestamps Print plots Export plot data to other applications 45
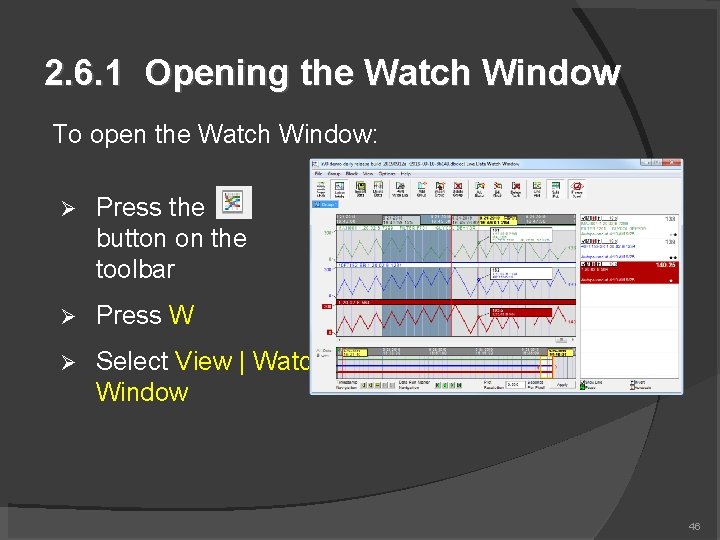
2. 6. 1 Opening the Watch Window To open the Watch Window: Press the button on the toolbar Press W Select View | Watch Window 46
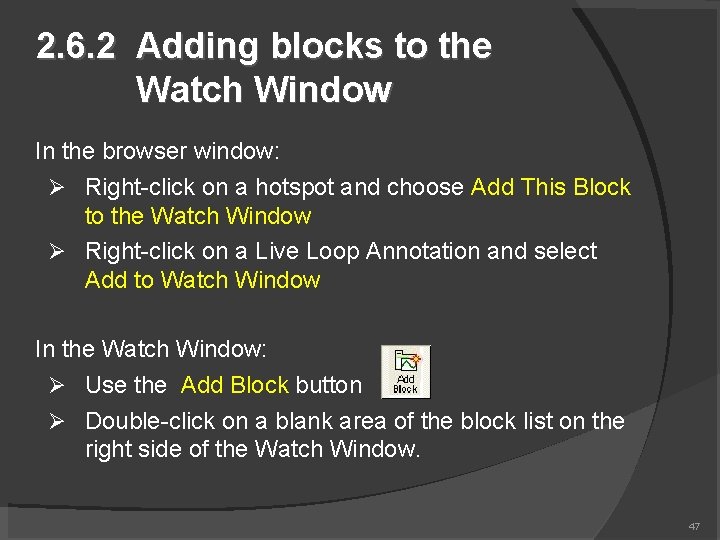
2. 6. 2 Adding blocks to the Watch Window In the browser window: Right-click on a hotspot and choose Add This Block to the Watch Window Right-click on a Live Loop Annotation and select Add to Watch Window In the Watch Window: Use the Add Block button Double-click on a blank area of the block list on the right side of the Watch Window. 47
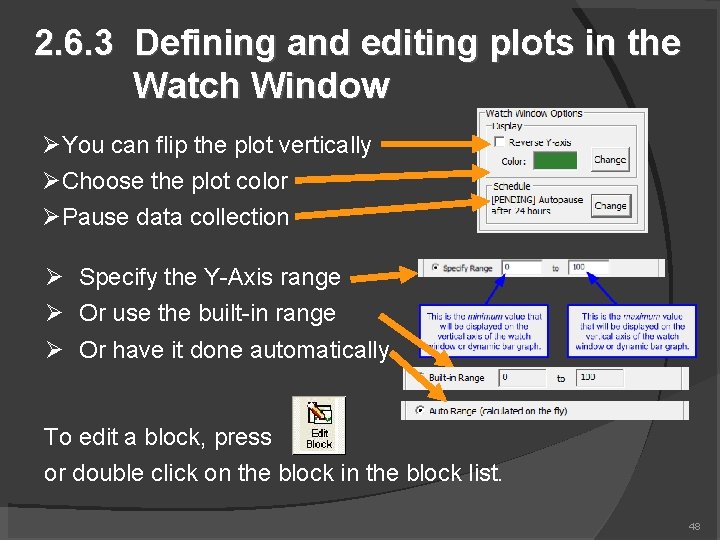
2. 6. 3 Defining and editing plots in the Watch Window You can flip the plot vertically Choose the plot color Pause data collection Specify the Y-Axis range Or use the built-in range Or have it done automatically To edit a block, press or double click on the block in the block list. 48
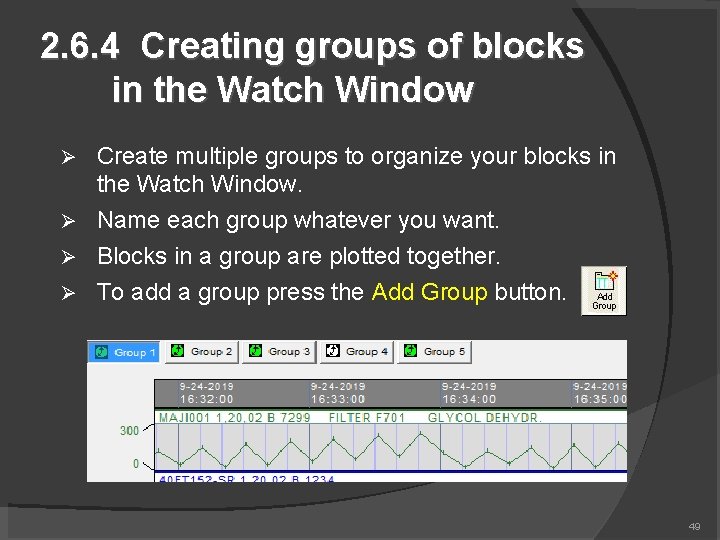
2. 6. 4 Creating groups of blocks in the Watch Window Create multiple groups to organize your blocks in the Watch Window. Name each group whatever you want. Blocks in a group are plotted together. To add a group press the Add Group button. 49
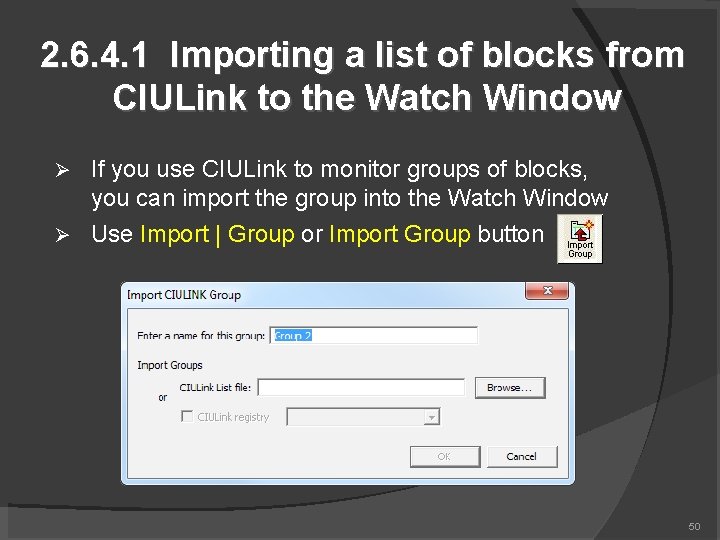
2. 6. 4. 1 Importing a list of blocks from CIULink to the Watch Window If you use CIULink to monitor groups of blocks, you can import the group into the Watch Window Use Import | Group or Import Group button 50
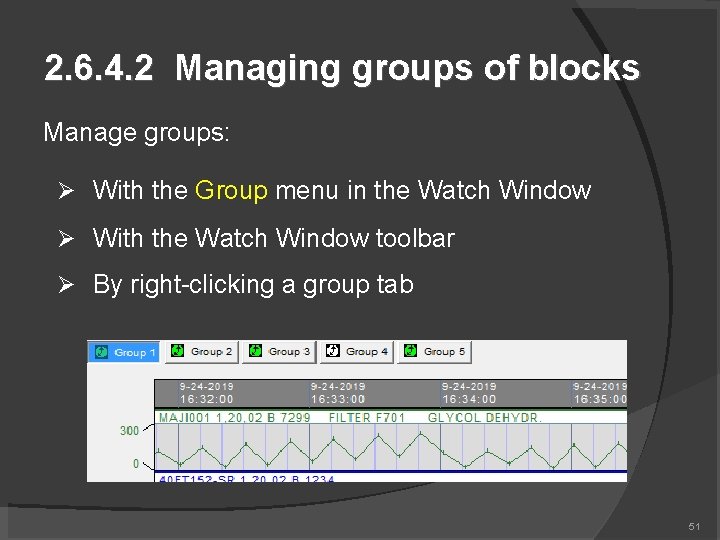
2. 6. 4. 2 Managing groups of blocks Manage groups: With the Group menu in the Watch Window With the Watch Window toolbar By right-clicking a group tab 51
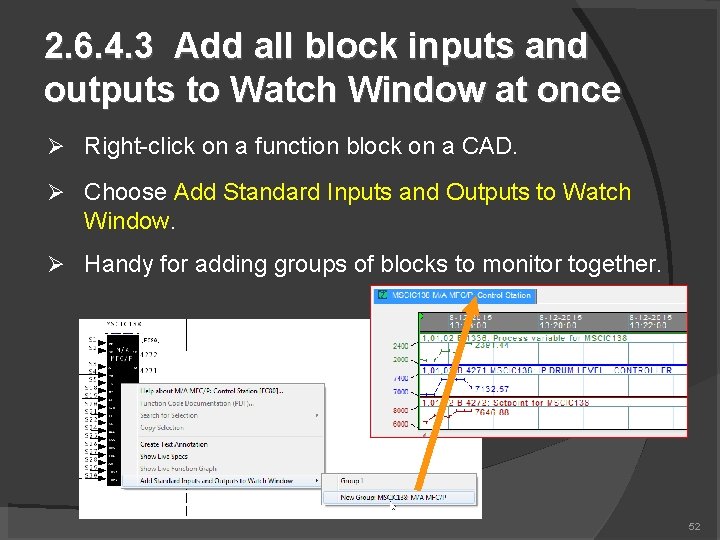
2. 6. 4. 3 Add all block inputs and outputs to Watch Window at once Right-click on a function block on a CAD. Choose Add Standard Inputs and Outputs to Watch Window. Handy for adding groups of blocks to monitor together. 52
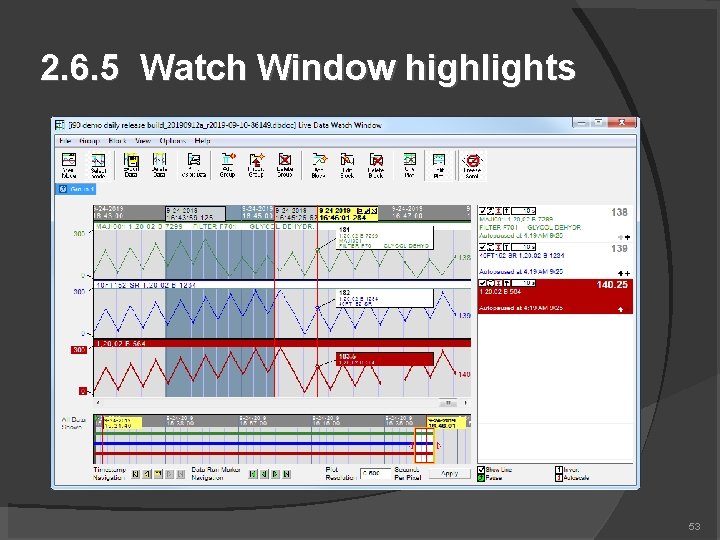
2. 6. 5 Watch Window highlights 53
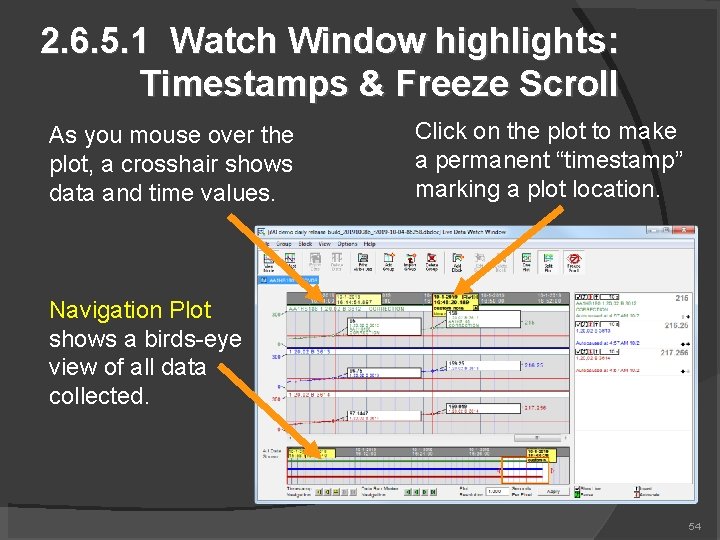
2. 6. 5. 1 Watch Window highlights: Timestamps & Freeze Scroll As you mouse over the plot, a crosshair shows data and time values. Click on the plot to make a permanent “timestamp” marking a plot location. Navigation Plot shows a birds-eye view of all data collected. 54
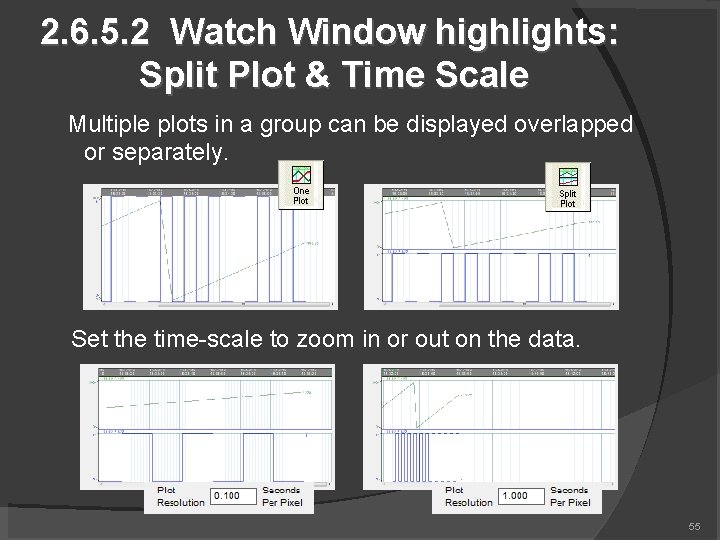
2. 6. 5. 2 Watch Window highlights: Split Plot & Time Scale Multiple plots in a group can be displayed overlapped or separately. Set the time-scale to zoom in or out on the data. 55
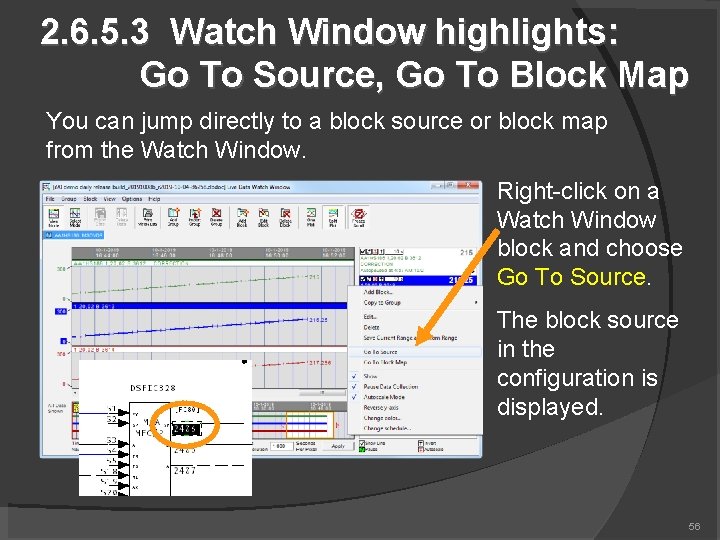
2. 6. 5. 3 Watch Window highlights: Go To Source, Go To Block Map You can jump directly to a block source or block map from the Watch Window. Right-click on a Watch Window block and choose Go To Source. The block source in the configuration is displayed. 56
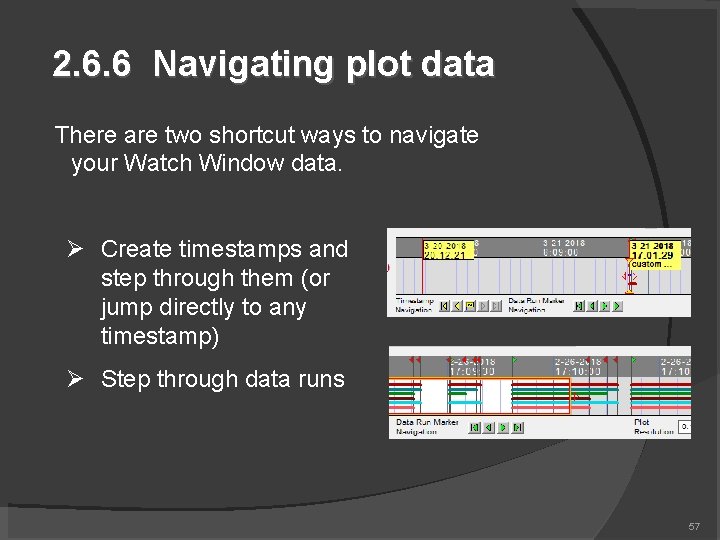
2. 6. 6 Navigating plot data There are two shortcut ways to navigate your Watch Window data. Create timestamps and step through them (or jump directly to any timestamp) Step through data runs 57
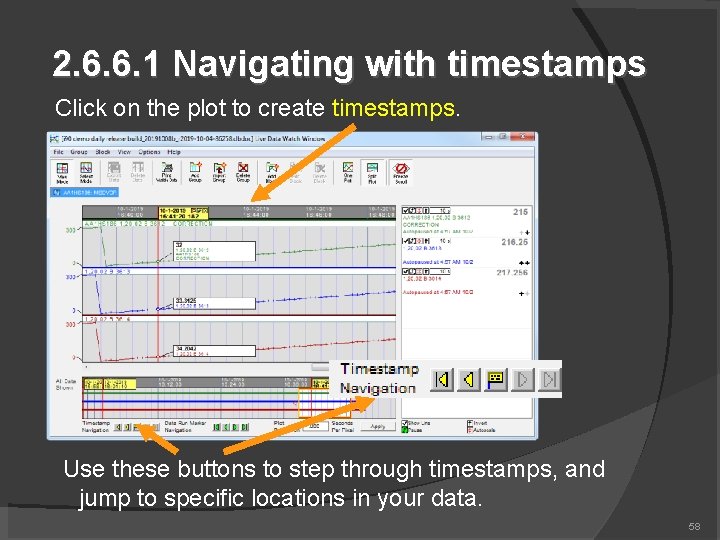
2. 6. 6. 1 Navigating with timestamps Click on the plot to create timestamps. Use these buttons to step through timestamps, and jump to specific locations in your data. 58
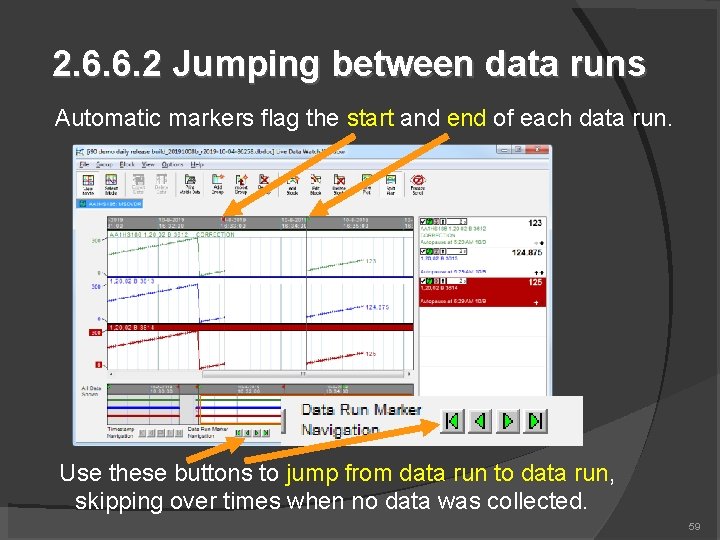
2. 6. 6. 2 Jumping between data runs Automatic markers flag the start and end of each data run. Use these buttons to jump from data run to data run, skipping over times when no data was collected. 59
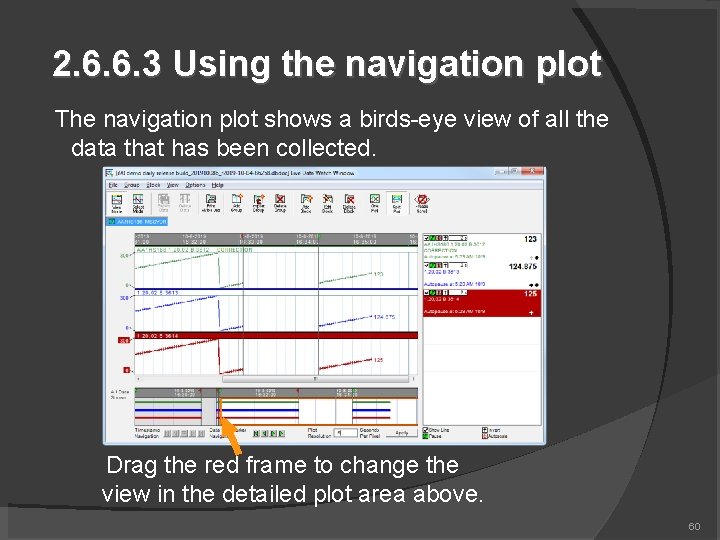
2. 6. 6. 3 Using the navigation plot The navigation plot shows a birds-eye view of all the data that has been collected. Drag the red frame to change the view in the detailed plot area above. 60
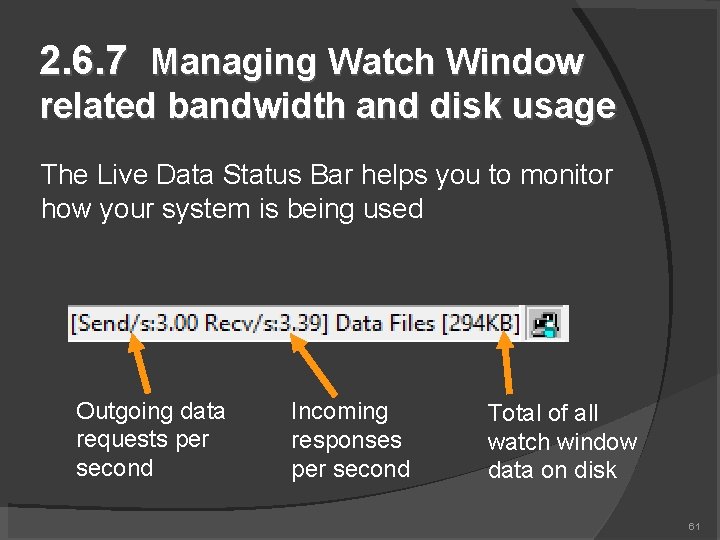
2. 6. 7 Managing Watch Window related bandwidth and disk usage The Live Data Status Bar helps you to monitor how your system is being used Outgoing data requests per second Incoming responses per second Total of all watch window data on disk 61
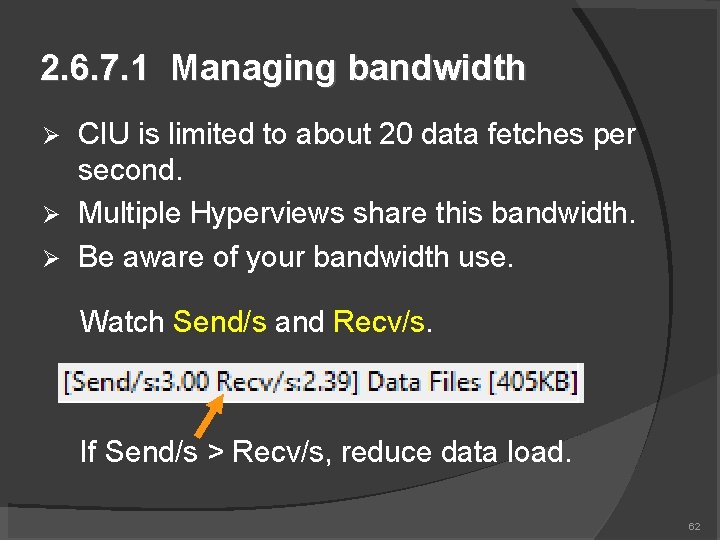
2. 6. 7. 1 Managing bandwidth CIU is limited to about 20 data fetches per second. Multiple Hyperviews share this bandwidth. Be aware of your bandwidth use. Watch Send/s and Recv/s. If Send/s > Recv/s, reduce data load. 62
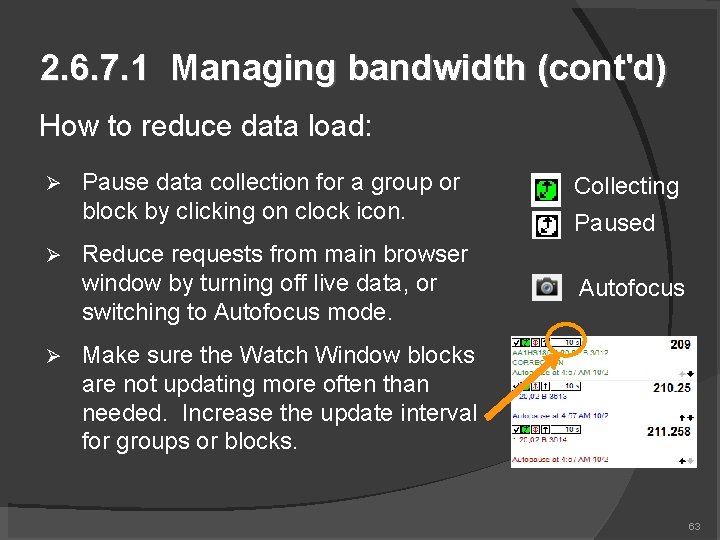
2. 6. 7. 1 Managing bandwidth (cont'd) How to reduce data load: Pause data collection for a group or block by clicking on clock icon. Collecting Reduce requests from main browser window by turning off live data, or switching to Autofocus mode. Autofocus Paused Make sure the Watch Window blocks are not updating more often than needed. Increase the update interval for groups or blocks. 63
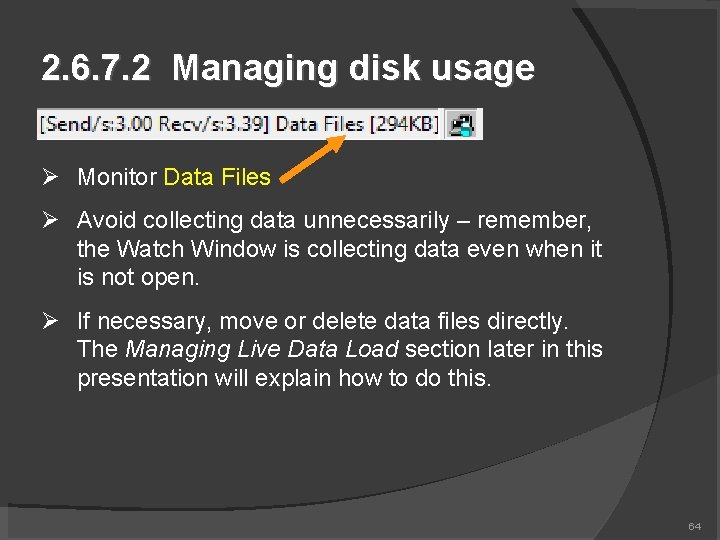
2. 6. 7. 2 Managing disk usage Monitor Data Files Avoid collecting data unnecessarily – remember, the Watch Window is collecting data even when it is not open. If necessary, move or delete data files directly. The Managing Live Data Load section later in this presentation will explain how to do this. 64
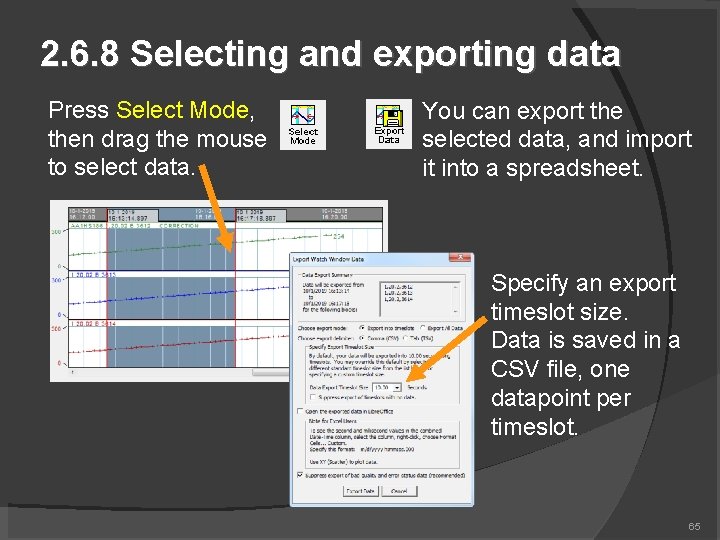
2. 6. 8 Selecting and exporting data Press Select Mode, then drag the mouse to select data. You can export the selected data, and import it into a spreadsheet. Specify an export timeslot size. Data is saved in a CSV file, one datapoint per timeslot. 65
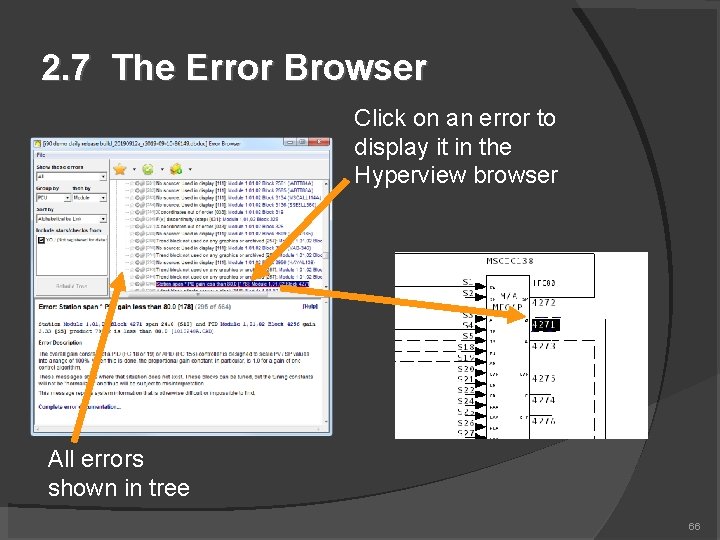
2. 7 The Error Browser Click on an error to display it in the Hyperview browser All errors shown in tree 66
2. 7. 1 Error Browser Overview Errors are built into the project Errors displayed in special browser in Hyperview Group, filter, sort errors in useful ways Mark errors for special attention (add star) Review errors (add check) and indicate they have been seen Share error stars and checks with other users Hide errors that don’t need attention 67
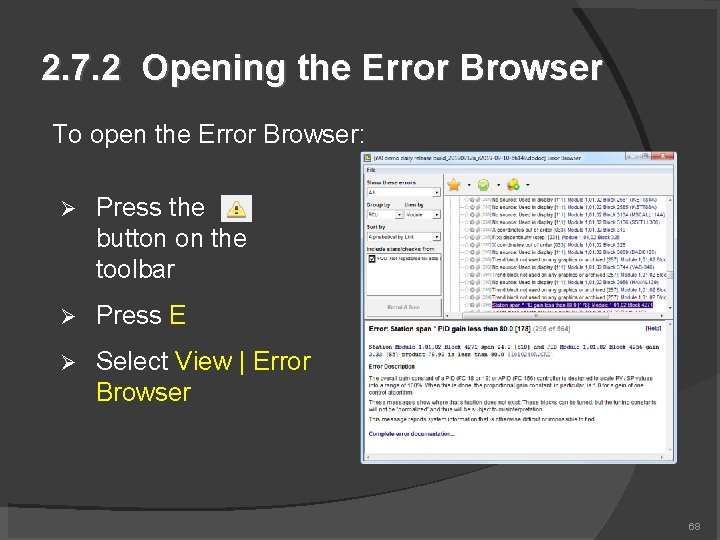
2. 7. 2 Opening the Error Browser To open the Error Browser: Press the button on the toolbar Press E Select View | Error Browser 68
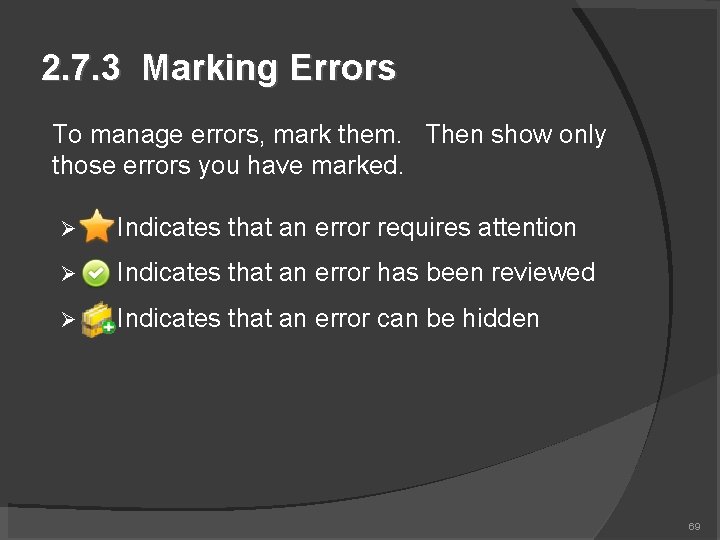
2. 7. 3 Marking Errors To manage errors, mark them. Then show only those errors you have marked. Indicates that an error requires attention Indicates that an error has been reviewed Indicates that an error can be hidden 69
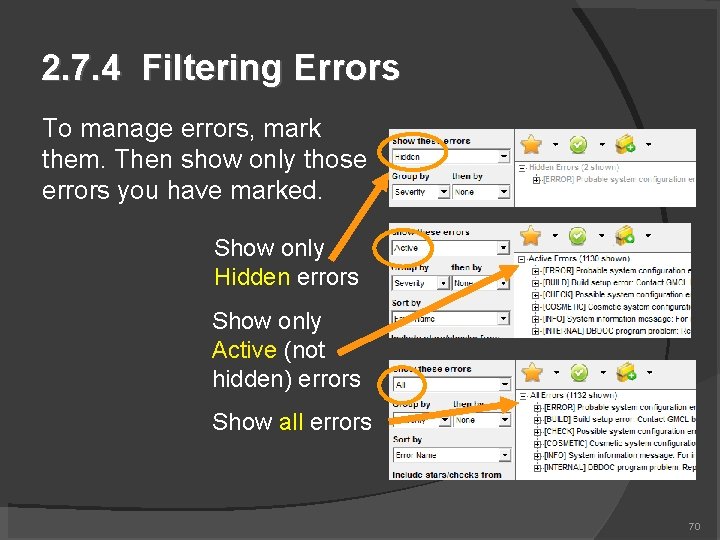
2. 7. 4 Filtering Errors To manage errors, mark them. Then show only those errors you have marked. Show only Hidden errors Show only Active (not hidden) errors Show all errors 70
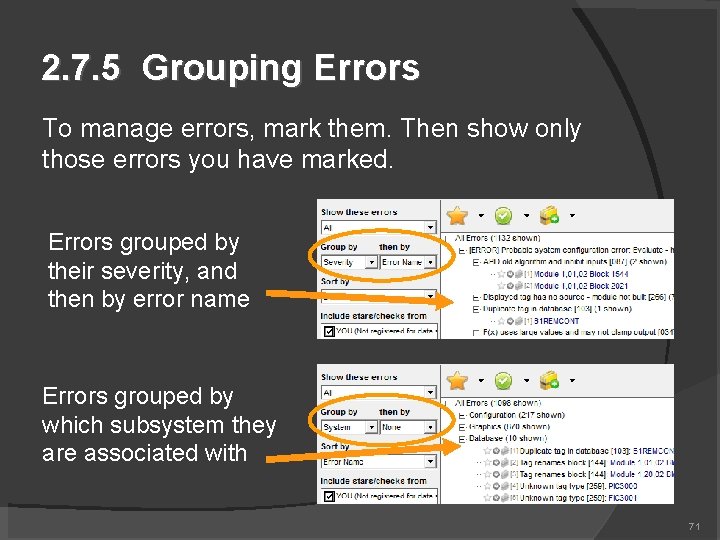
2. 7. 5 Grouping Errors To manage errors, mark them. Then show only those errors you have marked. Errors grouped by their severity, and then by error name Errors grouped by which subsystem they are associated with 71
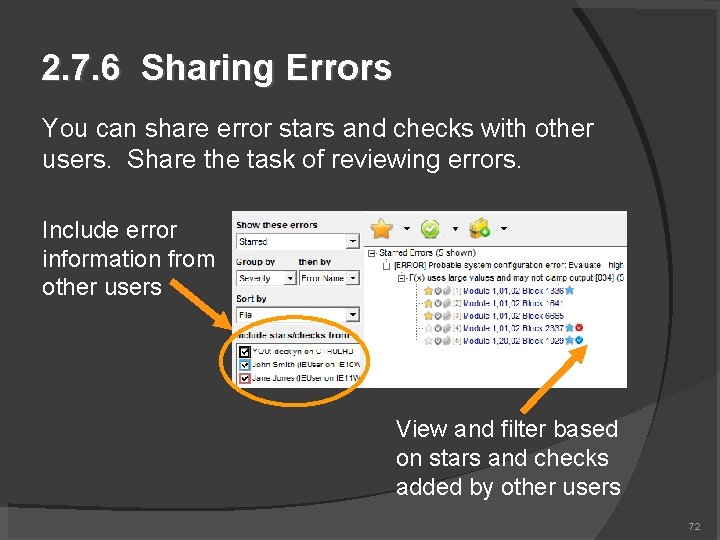
2. 7. 6 Sharing Errors You can share error stars and checks with other users. Share the task of reviewing errors. Include error information from other users View and filter based on stars and checks added by other users 72
2. 8 Customizing the display Many options for showing & hiding information View & hide specs, attributes, tag names Highlight search hits and hotspots Show thumbnails in graphical indexes
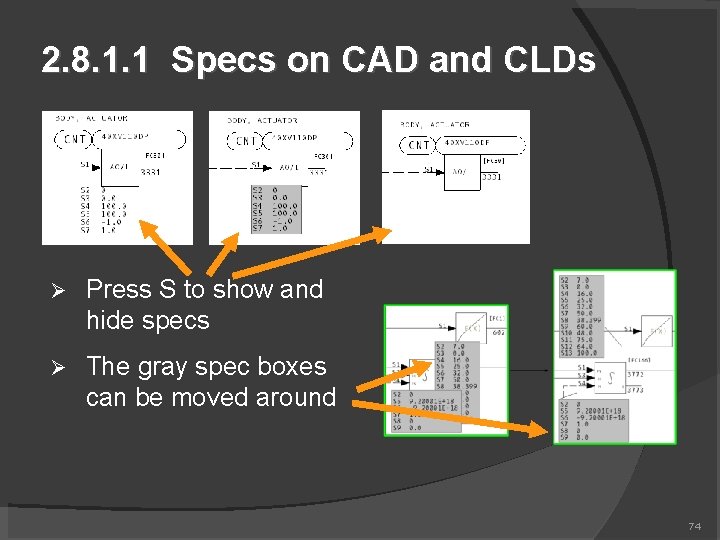
2. 8. 1. 1 Specs on CAD and CLDs Press S to show and hide specs The gray spec boxes can be moved around 74
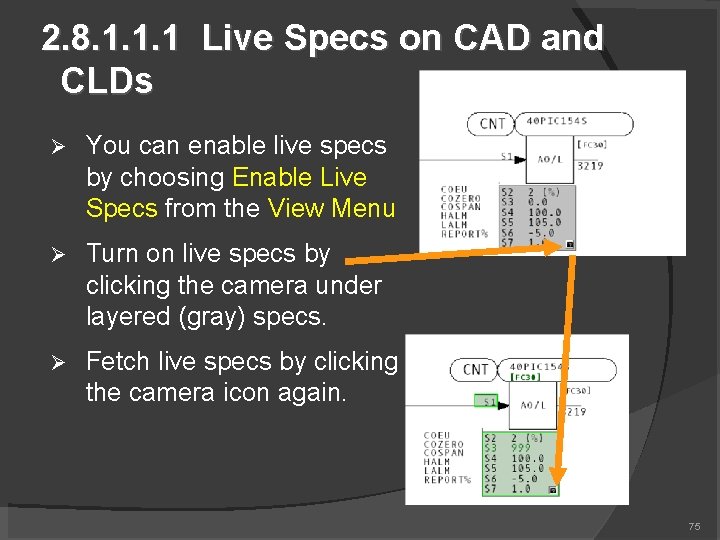
2. 8. 1. 1. 1 Live Specs on CAD and CLDs You can enable live specs by choosing Enable Live Specs from the View Menu Turn on live specs by clicking the camera under layered (gray) specs. Fetch live specs by clicking the camera icon again. 75
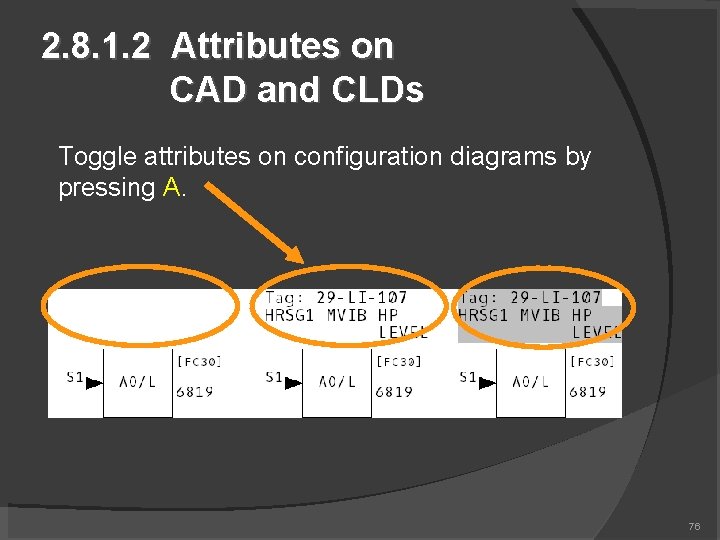
2. 8. 1. 2 Attributes on CAD and CLDs Toggle attributes on configuration diagrams by pressing A. 76
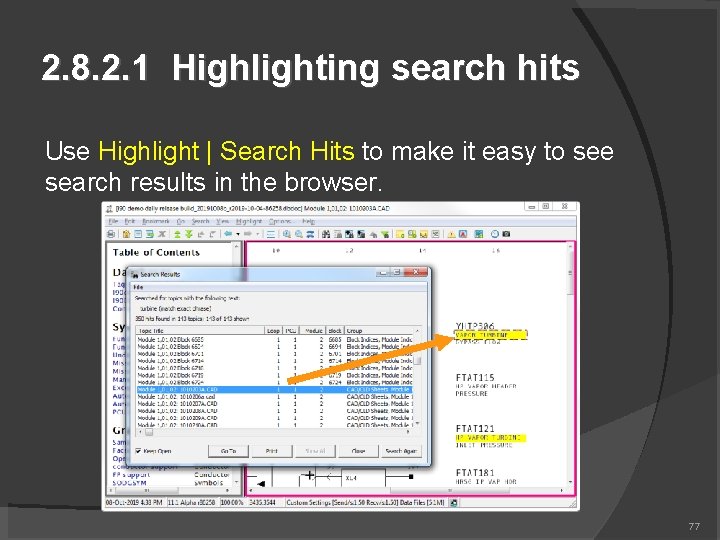
2. 8. 2. 1 Highlighting search hits Use Highlight | Search Hits to make it easy to see search results in the browser. 77
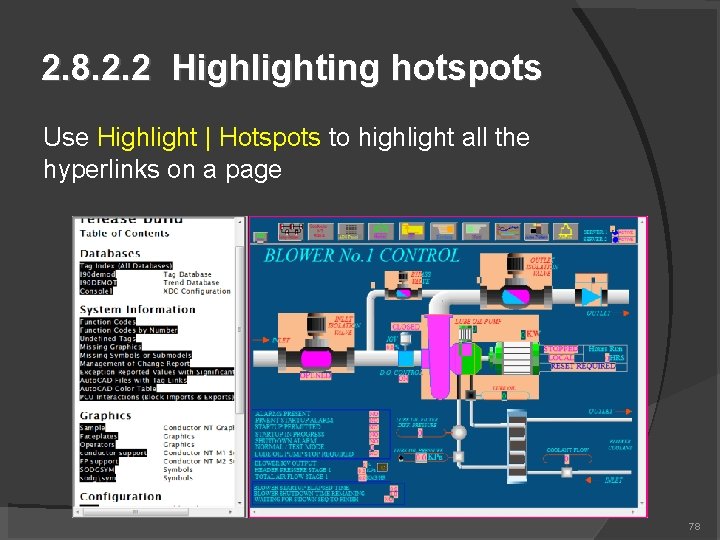
2. 8. 2. 2 Highlighting hotspots Use Highlight | Hotspots to highlight all the hyperlinks on a page 78
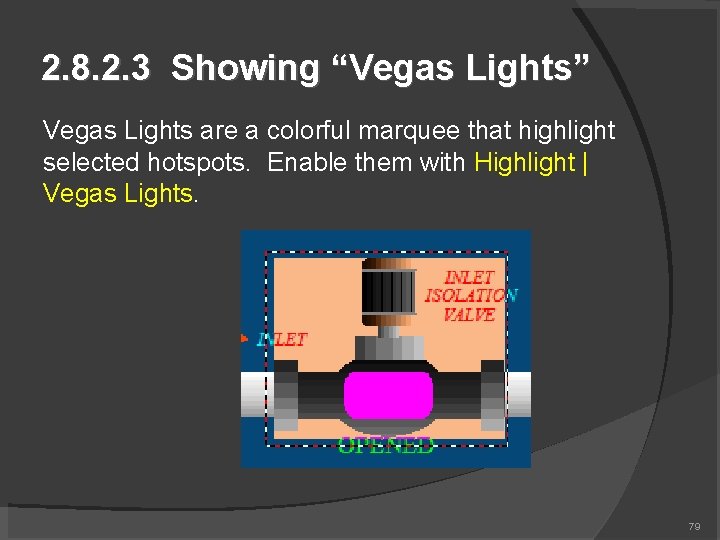
2. 8. 2. 3 Showing “Vegas Lights” Vegas Lights are a colorful marquee that highlight selected hotspots. Enable them with Highlight | Vegas Lights. 79
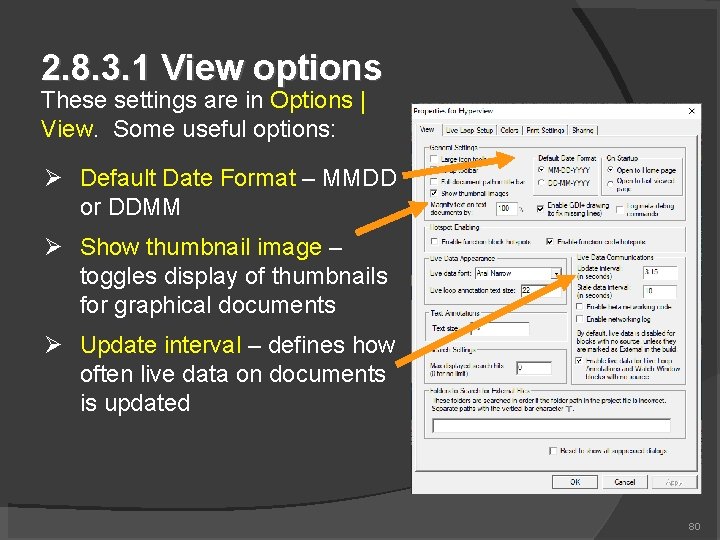
2. 8. 3. 1 View options These settings are in Options | View. Some useful options: Default Date Format – MMDD or DDMM Show thumbnail image – toggles display of thumbnails for graphical documents Update interval – defines how often live data on documents is updated 80
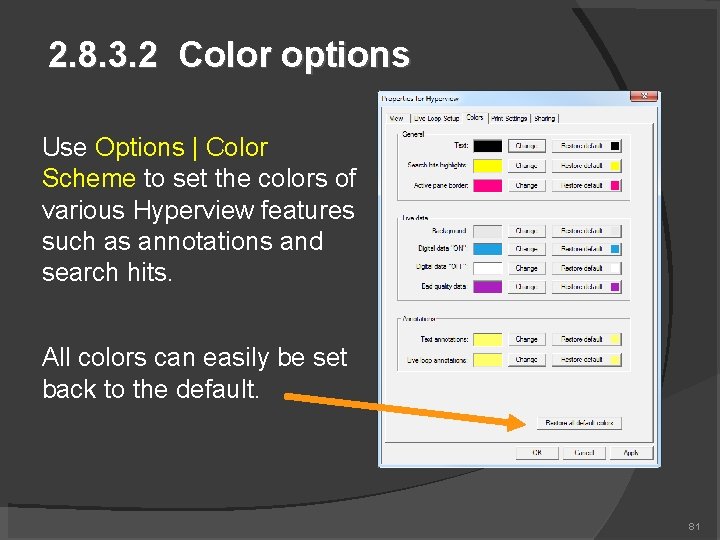
2. 8. 3. 2 Color options Use Options | Color Scheme to set the colors of various Hyperview features such as annotations and search hits. All colors can easily be set back to the default. 81
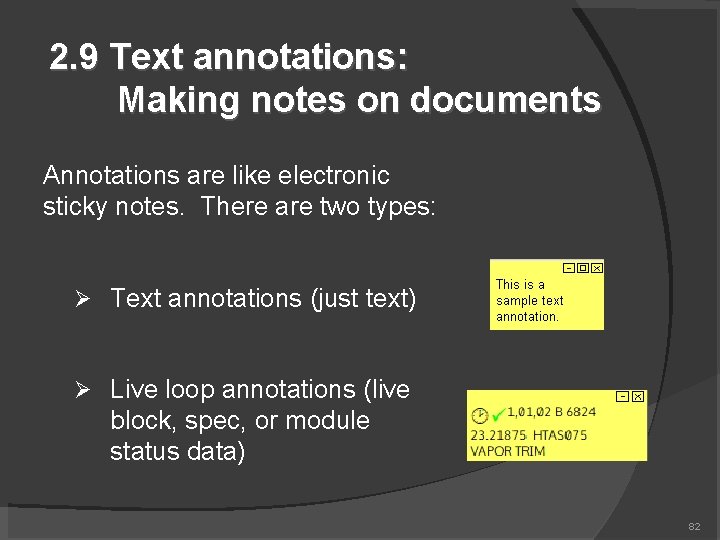
2. 9 Text annotations: Making notes on documents Annotations are like electronic sticky notes. There are two types: Text annotations (just text) Live loop annotations (live block, spec, or module status data) 82
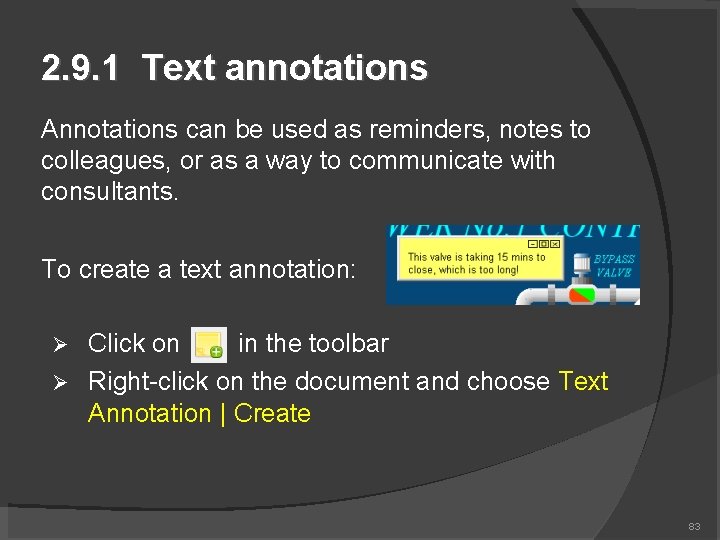
2. 9. 1 Text annotations Annotations can be used as reminders, notes to colleagues, or as a way to communicate with consultants. To create a text annotation: Click on in the toolbar Right-click on the document and choose Text Annotation | Create 83
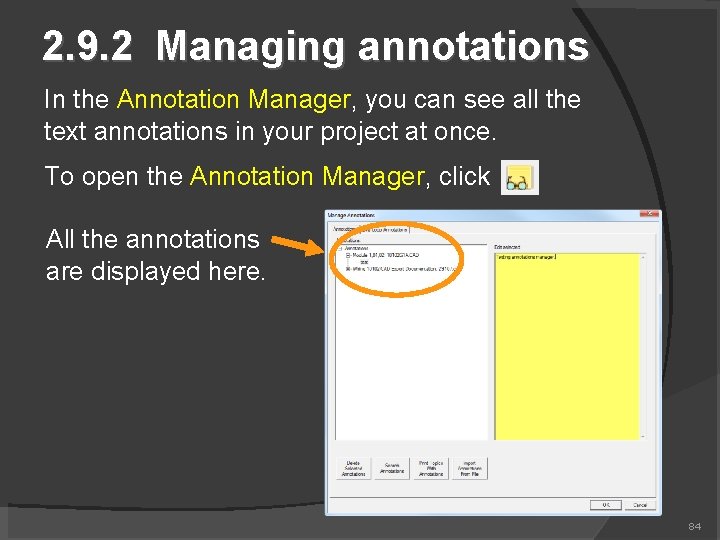
2. 9. 2 Managing annotations In the Annotation Manager, you can see all the text annotations in your project at once. To open the Annotation Manager, click All the annotations are displayed here. 84
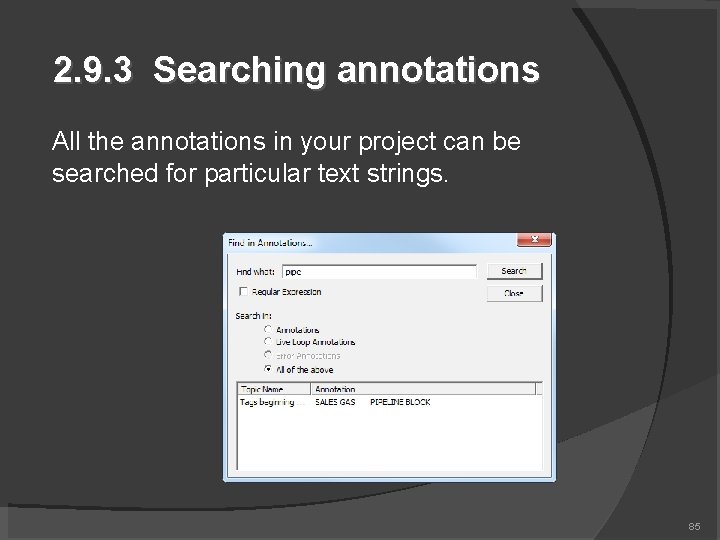
2. 9. 3 Searching annotations All the annotations in your project can be searched for particular text strings. 85
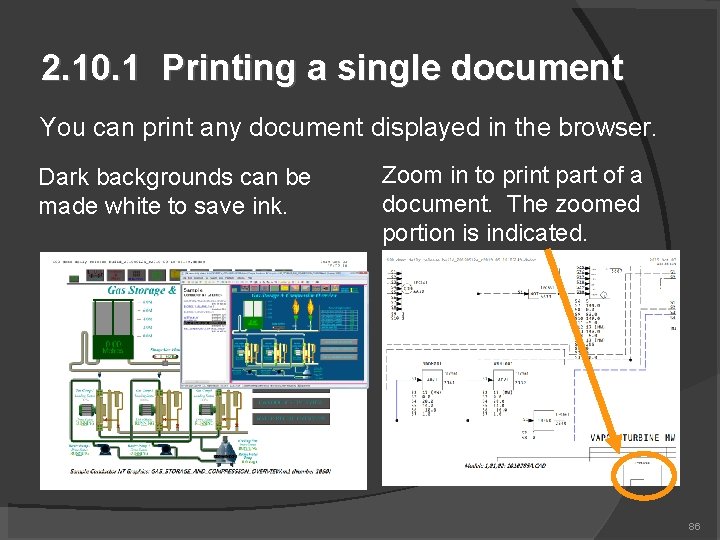
2. 10. 1 Printing a single document You can print any document displayed in the browser. Dark backgrounds can be made white to save ink. Zoom in to print part of a document. The zoomed portion is indicated. 86
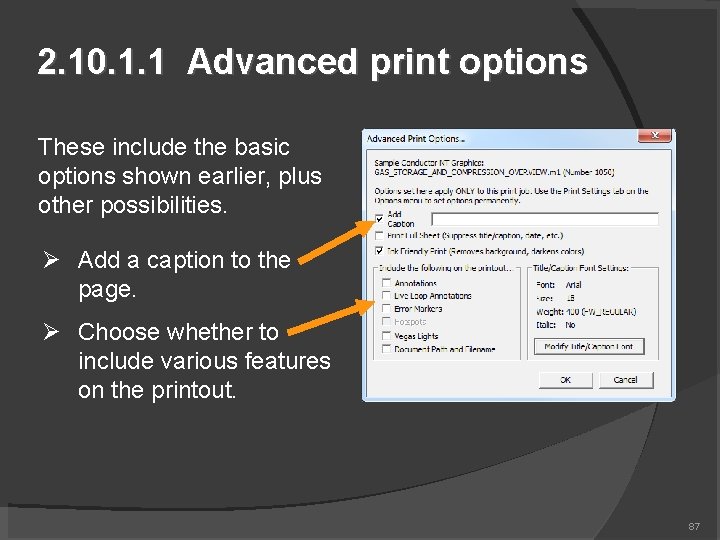
2. 10. 1. 1 Advanced print options These include the basic options shown earlier, plus other possibilities. Add a caption to the page. Choose whether to include various features on the printout. 87
2. 10. 1. 2 Fast Print If you print frequently, use Fast Print. Select File | Fast Print from the File menu Press P on the keyboard The Print dialog choices from the first print will be applied to subsequent prints 88
2. 10. 2 Marking the current topic for later printing Using the right-click menu, you can mark a topic for later printing. This is convenient for printing many topics at once. Mark the current topic for printing with Mark for Print | Mark <topic> for Printing Over a block hotspot, mark the block's index for printing with Mark for Print | Mark <block index> for Printing Over a link hotspot, mark the linked topic for printing with Mark for Print | Mark Linked Topic for Printing 89
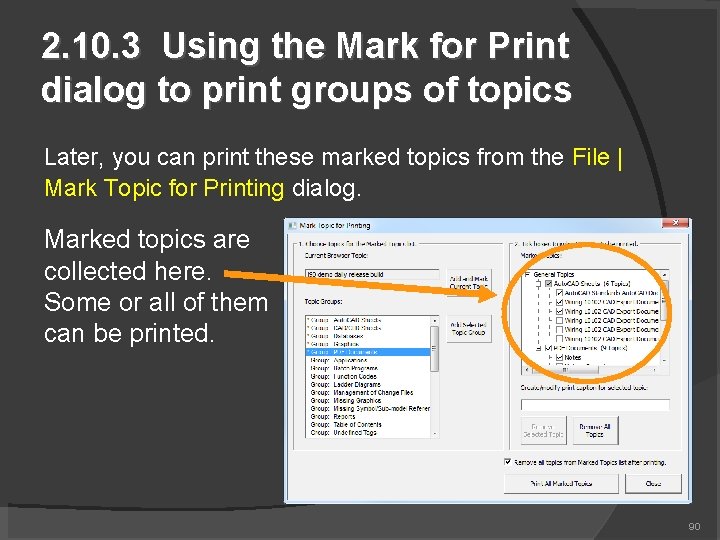
2. 10. 3 Using the Mark for Print dialog to print groups of topics Later, you can print these marked topics from the File | Mark Topic for Printing dialog. Marked topics are collected here. Some or all of them can be printed. 90
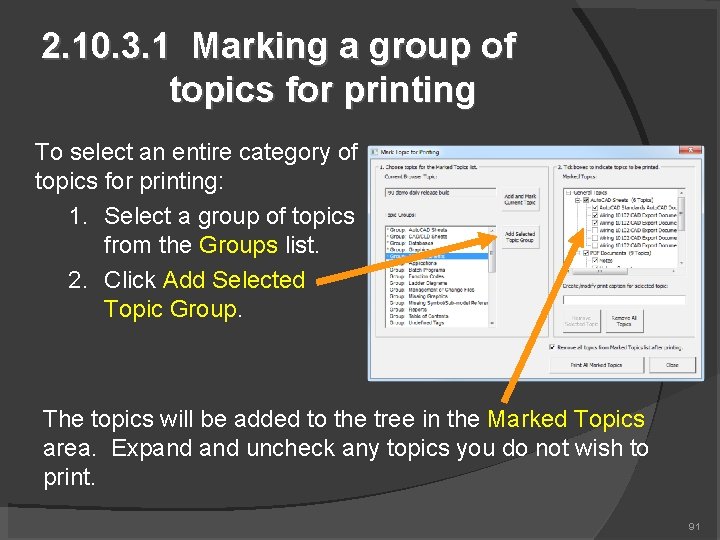
2. 10. 3. 1 Marking a group of topics for printing To select an entire category of topics for printing: 1. Select a group of topics from the Groups list. 2. Click Add Selected Topic Group. The topics will be added to the tree in the Marked Topics area. Expand uncheck any topics you do not wish to print. 91
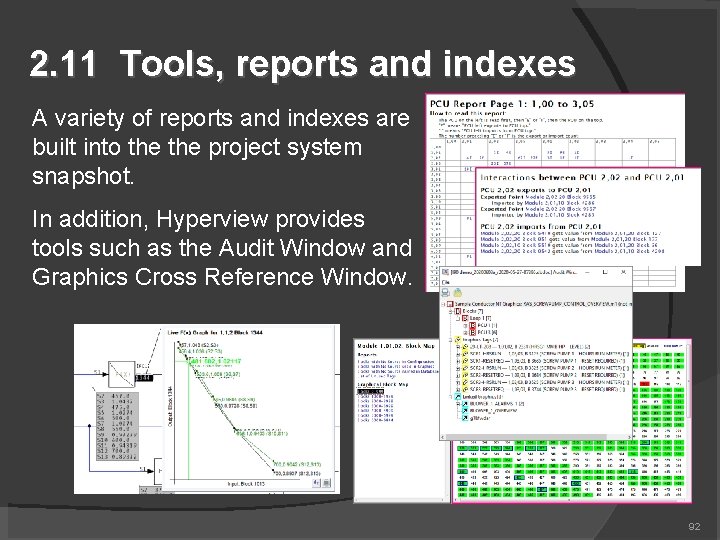
2. 11 Tools, reports and indexes A variety of reports and indexes are built into the project system snapshot. In addition, Hyperview provides tools such as the Audit Window and Graphics Cross Reference Window. 92
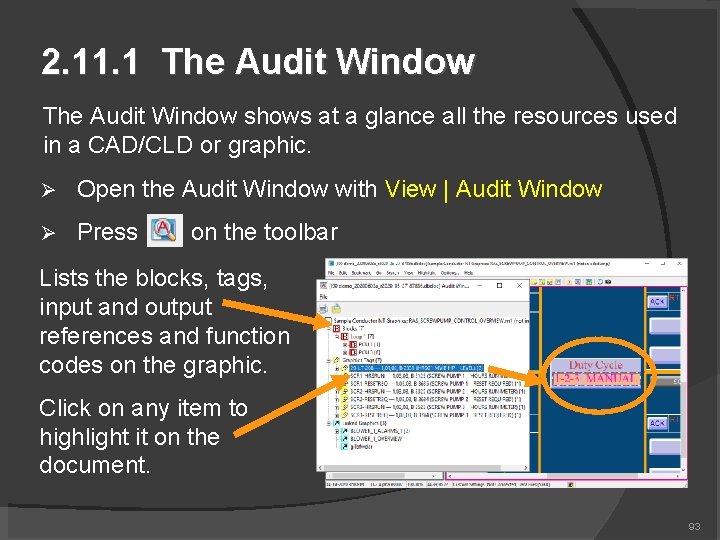
2. 11. 1 The Audit Window shows at a glance all the resources used in a CAD/CLD or graphic. Open the Audit Window with View | Audit Window Press on the toolbar Lists the blocks, tags, input and output references and function codes on the graphic. Click on any item to highlight it on the document. 93
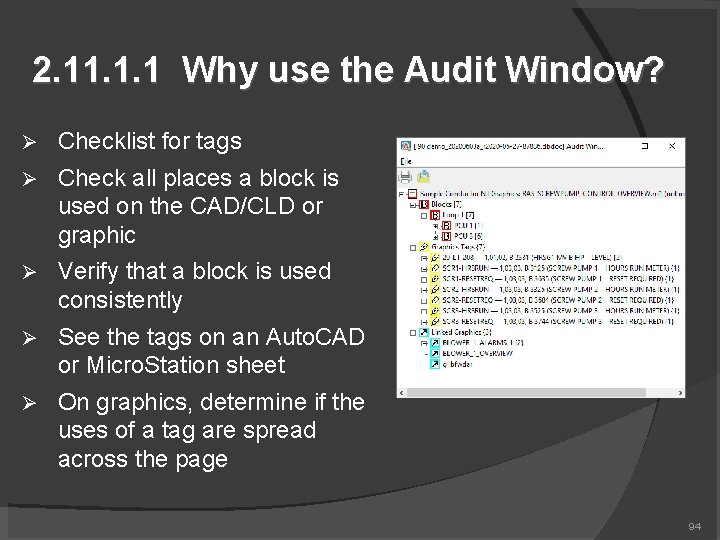
2. 11. 1. 1 Why use the Audit Window? Checklist for tags Check all places a block is used on the CAD/CLD or graphic Verify that a block is used consistently See the tags on an Auto. CAD or Micro. Station sheet On graphics, determine if the uses of a tag are spread across the page 94
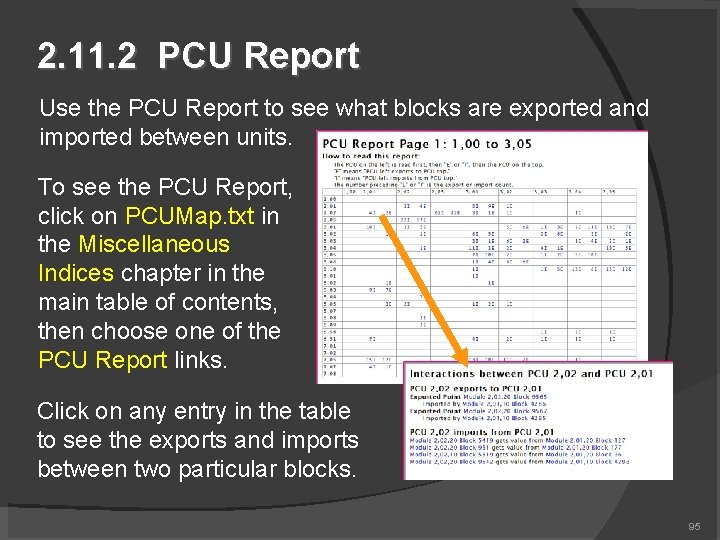
2. 11. 2 PCU Report Use the PCU Report to see what blocks are exported and imported between units. To see the PCU Report, click on PCUMap. txt in the Miscellaneous Indices chapter in the main table of contents, then choose one of the PCU Report links. Click on any entry in the table to see the exports and imports between two particular blocks. 95
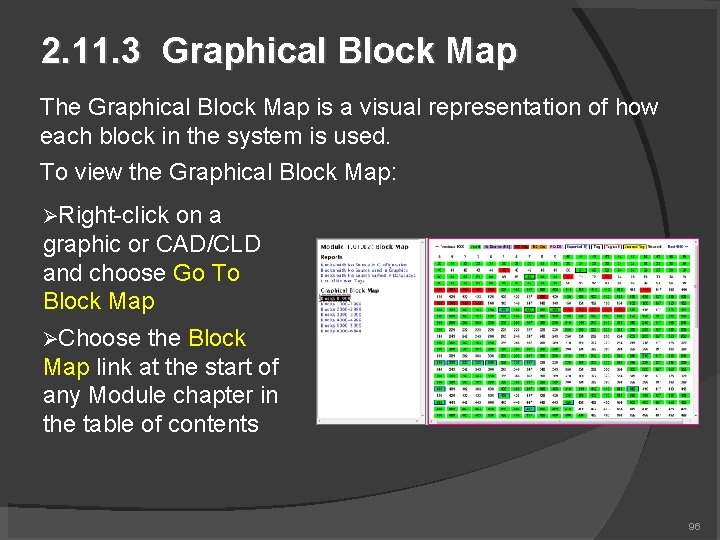
2. 11. 3 Graphical Block Map The Graphical Block Map is a visual representation of how each block in the system is used. To view the Graphical Block Map: Right-click on a graphic or CAD/CLD and choose Go To Block Map Choose the Block Map link at the start of any Module chapter in the table of contents 96
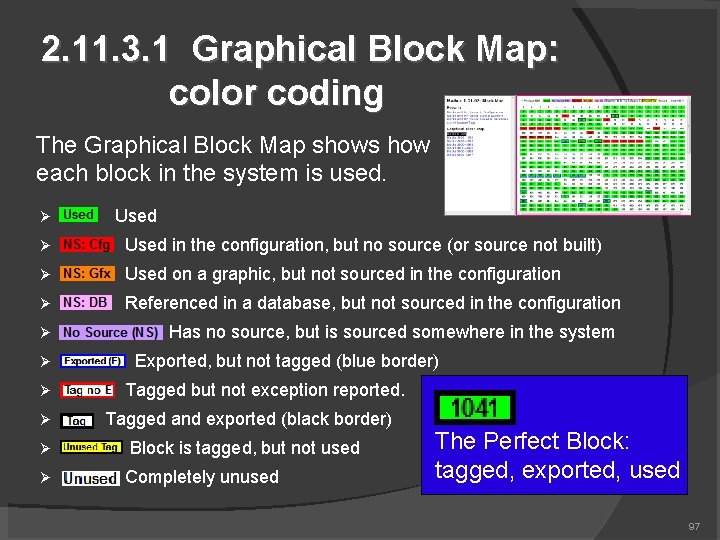
2. 11. 3. 1 Graphical Block Map: color coding The Graphical Block Map shows how each block in the system is used. Used in the configuration, but no source (or source not built) Used on a graphic, but not sourced in the configuration Referenced in a database, but not sourced in the configuration Has no source, but is sourced somewhere in the system Exported, but not tagged (blue border) Tagged but not exception reported. Tagged and exported (black border) Block is tagged, but not used Completely unused The Perfect Block: tagged, exported, used 97
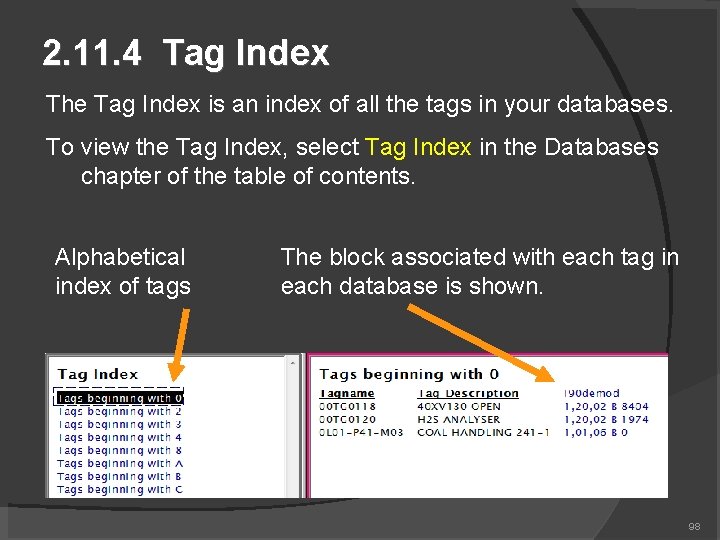
2. 11. 4 Tag Index The Tag Index is an index of all the tags in your databases. To view the Tag Index, select Tag Index in the Databases chapter of the table of contents. Alphabetical index of tags The block associated with each tag in each database is shown. 98
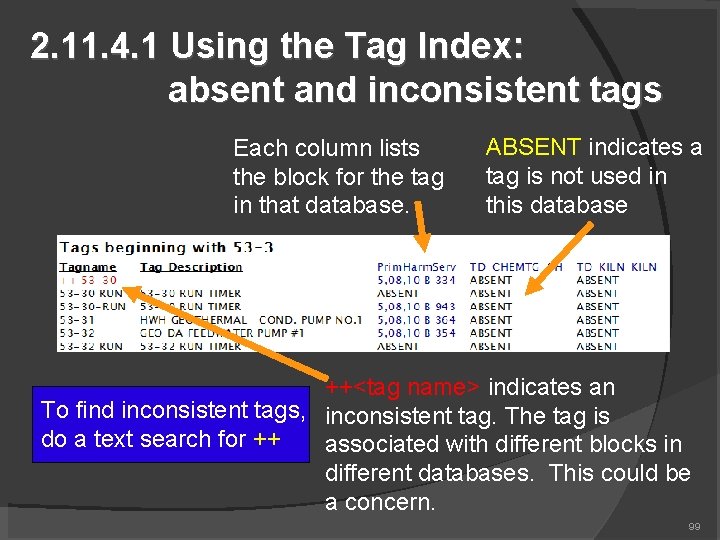
2. 11. 4. 1 Using the Tag Index: absent and inconsistent tags Each column lists the block for the tag in that database. ABSENT indicates a tag is not used in this database ++<tag name> indicates an To find inconsistent tags, inconsistent tag. The tag is do a text search for ++ associated with different blocks in different databases. This could be a concern. 99
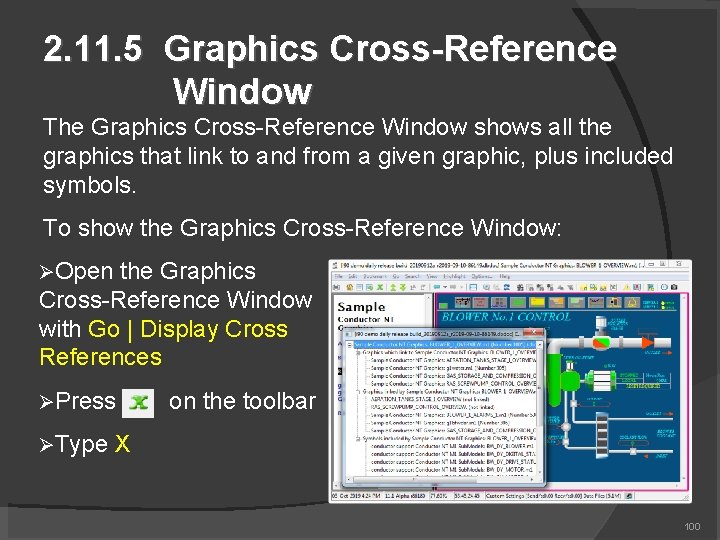
2. 11. 5 Graphics Cross-Reference Window The Graphics Cross-Reference Window shows all the graphics that link to and from a given graphic, plus included symbols. To show the Graphics Cross-Reference Window: Open the Graphics Cross-Reference Window with Go | Display Cross References Press Type on the toolbar X 100
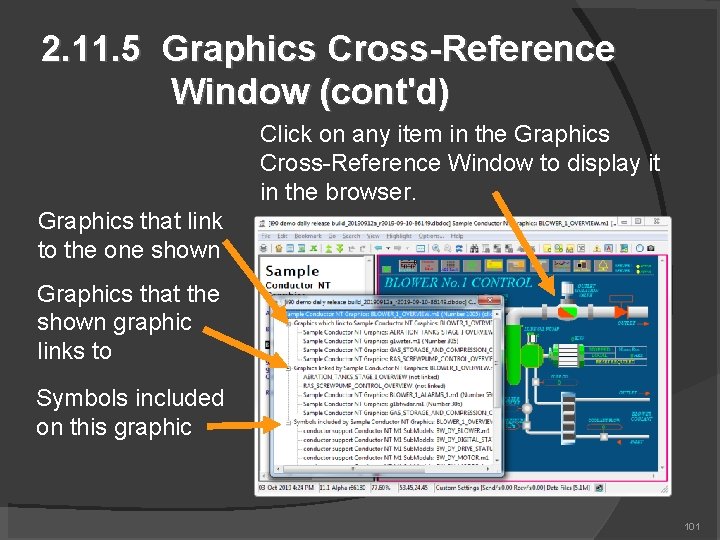
2. 11. 5 Graphics Cross-Reference Window (cont'd) Click on any item in the Graphics Cross-Reference Window to display it in the browser. Graphics that link to the one shown Graphics that the shown graphic links to Symbols included on this graphic 101
2. 11. 5. 1 Using cross-references to find symbols no longer used by your graphics Step through your symbol chapters Bring up the cross-references for each symbol Symbols that are never used will have a blank cross-reference page 102
2. 11. 5. 2 Using cross-references to locate graphics linked to but not built Step through your graphics chapters Bring up the cross-references for each graphic Entries followed by (not linked) in the Cross. Reference Index indicate that DBDOC was unable to build the graphics called for; either the build was incomplete or some of the graphics are trying to link to graphics that no longer exist 103
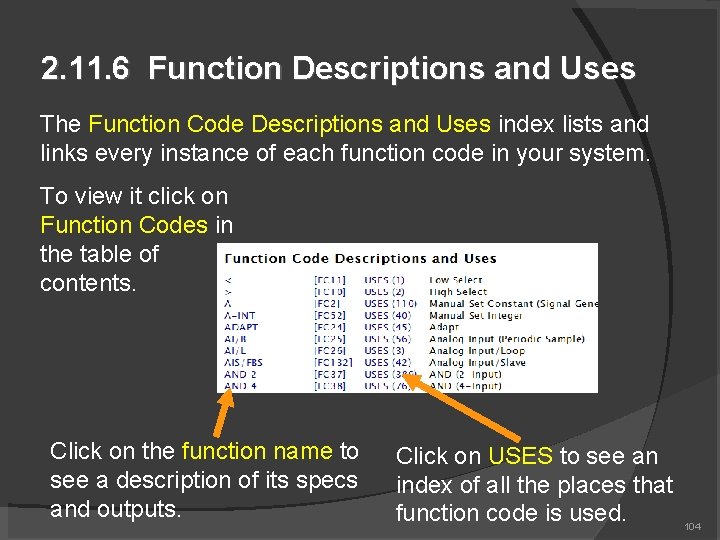
2. 11. 6 Function Descriptions and Uses The Function Code Descriptions and Uses index lists and links every instance of each function code in your system. To view it click on Function Codes in the table of contents. Click on the function name to see a description of its specs and outputs. Click on USES to see an index of all the places that function code is used. 104
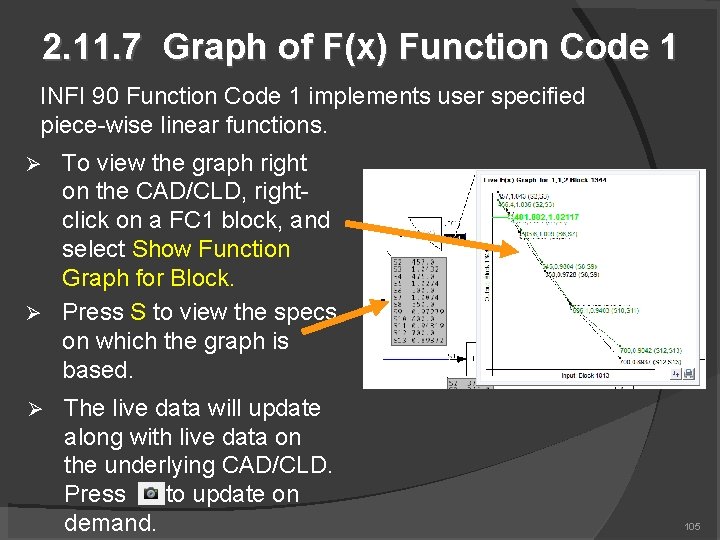
2. 11. 7 Graph of F(x) Function Code 1 INFI 90 Function Code 1 implements user specified piece-wise linear functions. To view the graph right on the CAD/CLD, rightclick on a FC 1 block, and select Show Function Graph for Block. Press S to view the specs on which the graph is based. The live data will update along with live data on the underlying CAD/CLD. Press to update on demand. 105
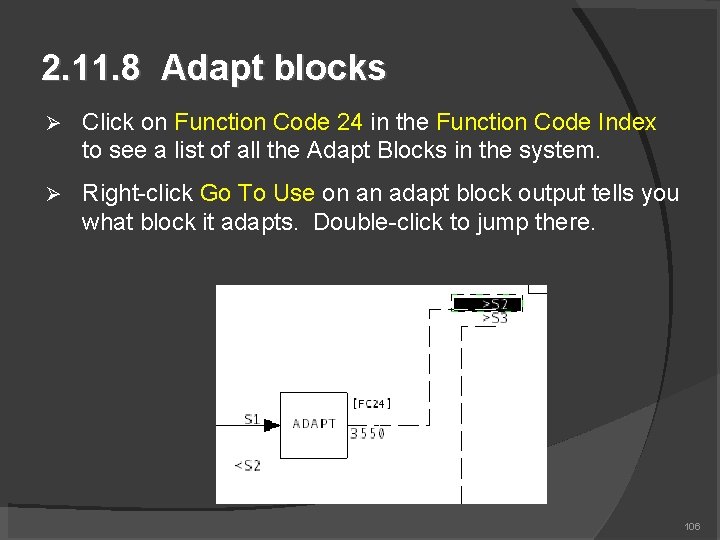
2. 11. 8 Adapt blocks Click on Function Code 24 in the Function Code Index to see a list of all the Adapt Blocks in the system. Right-click Go To Use on an adapt block output tells you what block it adapts. Double-click to jump there. 106
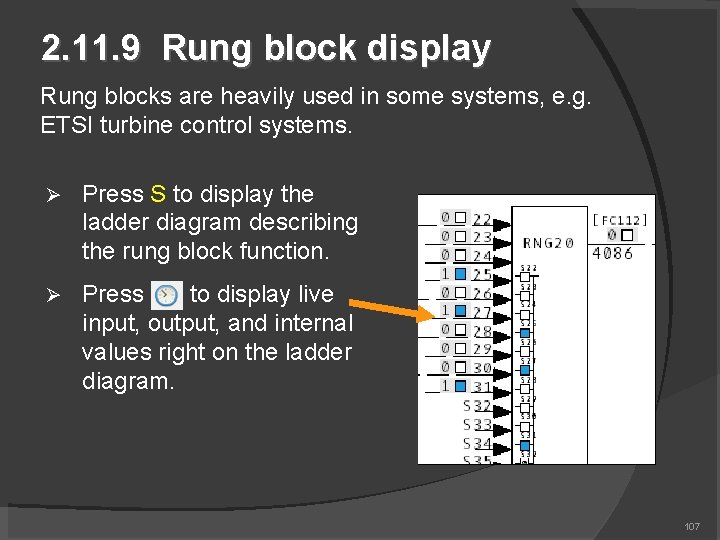
2. 11. 9 Rung block display Rung blocks are heavily used in some systems, e. g. ETSI turbine control systems. Press S to display the ladder diagram describing the rung block function. Press to display live input, output, and internal values right on the ladder diagram. 107
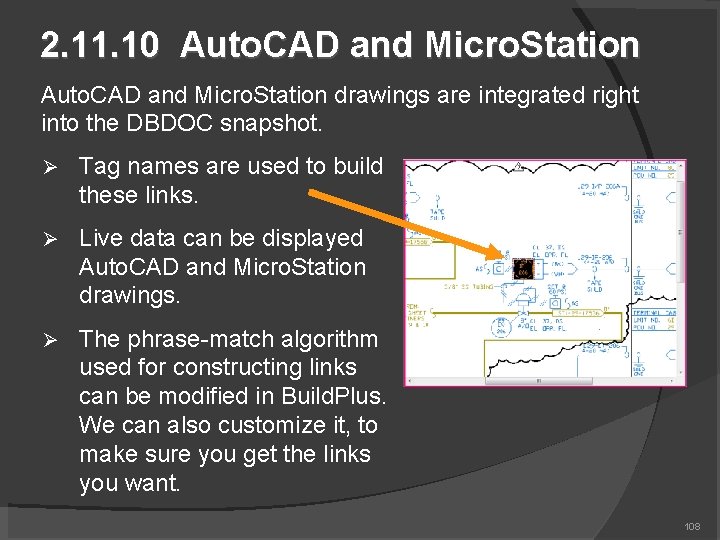
2. 11. 10 Auto. CAD and Micro. Station drawings are integrated right into the DBDOC snapshot. Tag names are used to build these links. Live data can be displayed Auto. CAD and Micro. Station drawings. The phrase-match algorithm used for constructing links can be modified in Build. Plus. We can also customize it, to make sure you get the links you want. 108
2. 12 Managing live loop data connections In order to fetch live data to display on documents, Hyperview needs to know the location of at least one CIUMon server (the DBDOC live data server). Live loop connections can be configured In Build. Plus, and built into the project snaphot (the usual and preferred approach) In Hyperview, using Options | Live Loop Settings 109
2. 1 About live data settings Live data can be displayed on documents in Hyperview. Data is fetched from the CIU via one or more DBDOC data servers (CIUMon). Some systems have one CIUMon server. Some have multiple CIUMon servers. Sometime certain CIUMons are available on one network (e. g. DCS LAN) and other on another network (e. g. business LAN). Usually the settings (i. e. list of data servers) are built into the project file. Possible to create “Custom” local settings in Hyperview. 110
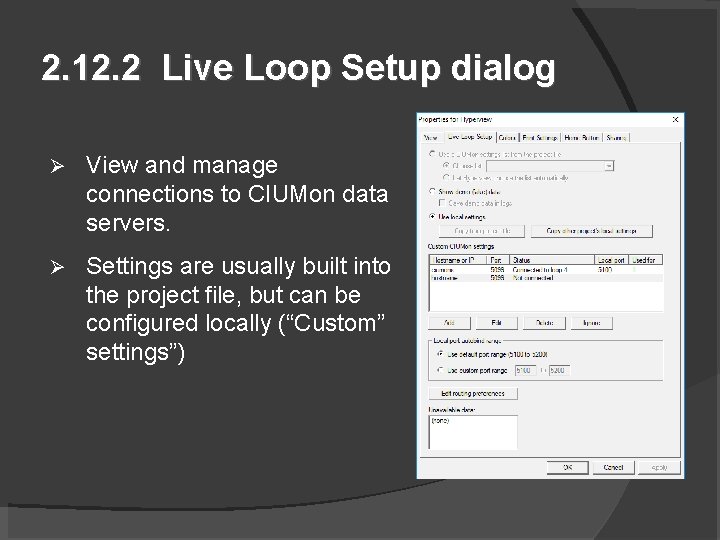
2. 12. 2 Live Loop Setup dialog View and manage connections to CIUMon data servers. Settings are usually built into the project file, but can be configured locally (“Custom” settings”)
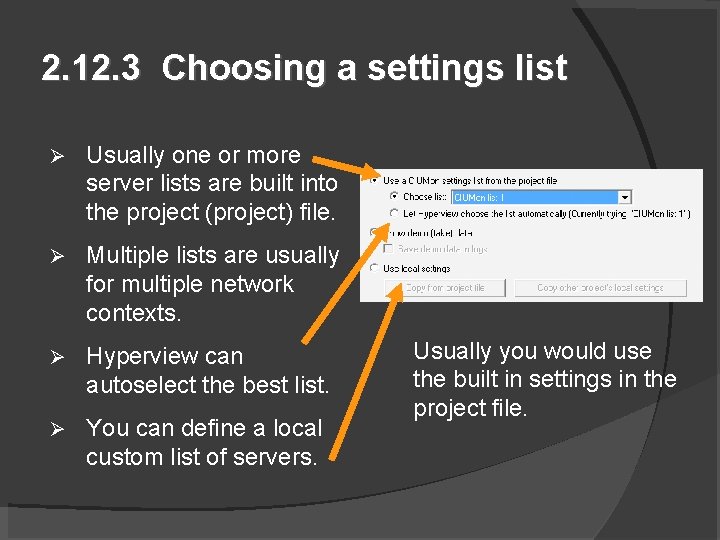
2. 12. 3 Choosing a settings list Usually one or more server lists are built into the project (project) file. Multiple lists are usually for multiple network contexts. Hyperview can autoselect the best list. You can define a local custom list of servers. Usually you would use the built in settings in the project file.
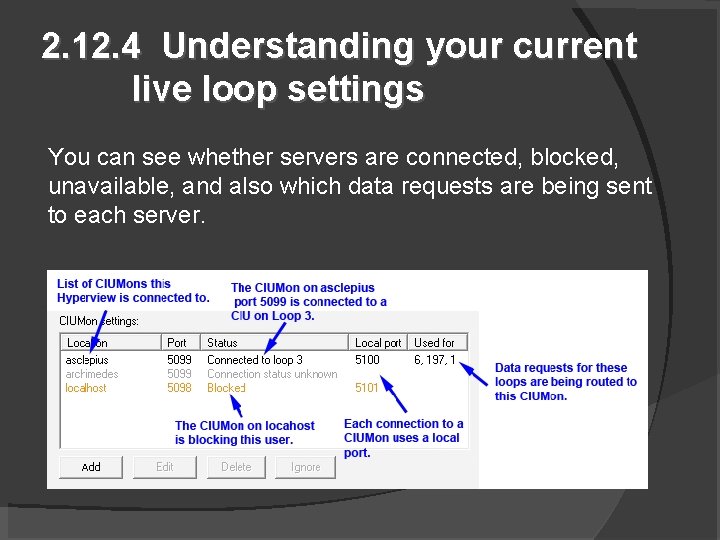
2. 12. 4 Understanding your current live loop settings You can see whether servers are connected, blocked, unavailable, and also which data requests are being sent to each server.
2. 12. 5 Adding or modifying live loop connections Usually settings should be configured in Build. Plus, and built into the shared project file. However, in some situations, you might need to change your personal live loop settings using Hyperview: No settings are built into the project file. You need to override the settings built into the project file. You want to use a specific CIUMon connected to a particular CIU or Serial Port Module. The built-in CIUMons settings are not accessible in your network context.
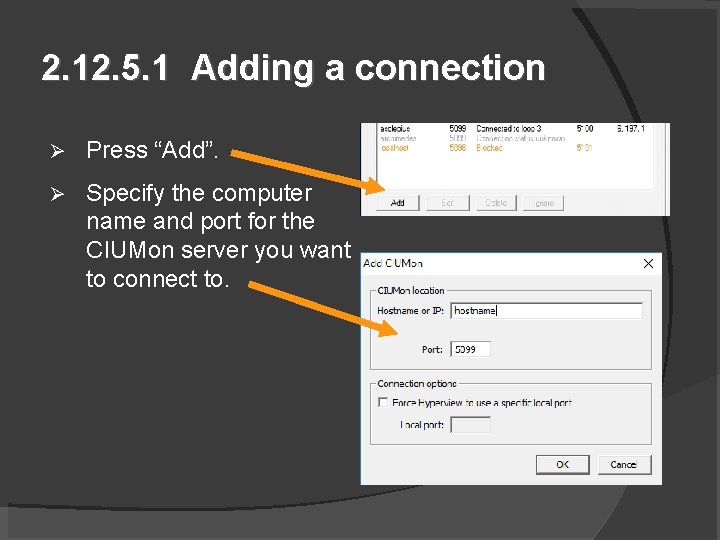
2. 12. 5. 1 Adding a connection Press “Add”. Specify the computer name and port for the CIUMon server you want to connect to.
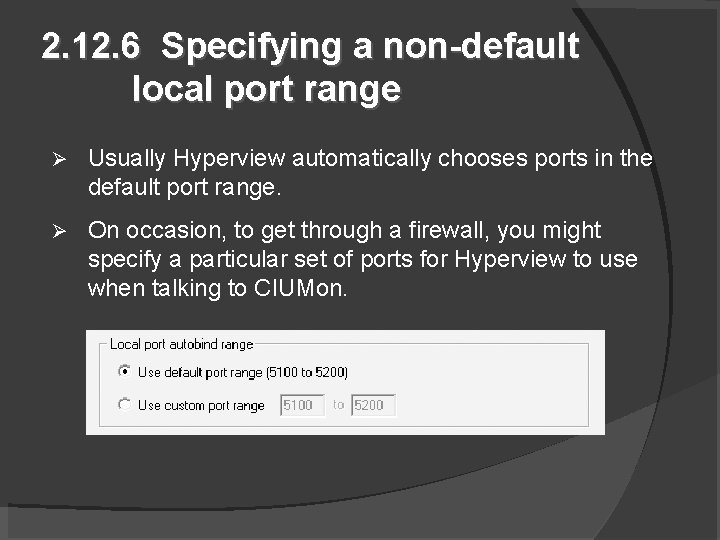
2. 12. 6 Specifying a non-default local port range Usually Hyperview automatically chooses ports in the default port range. On occasion, to get through a firewall, you might specify a particular set of ports for Hyperview to use when talking to CIUMon.
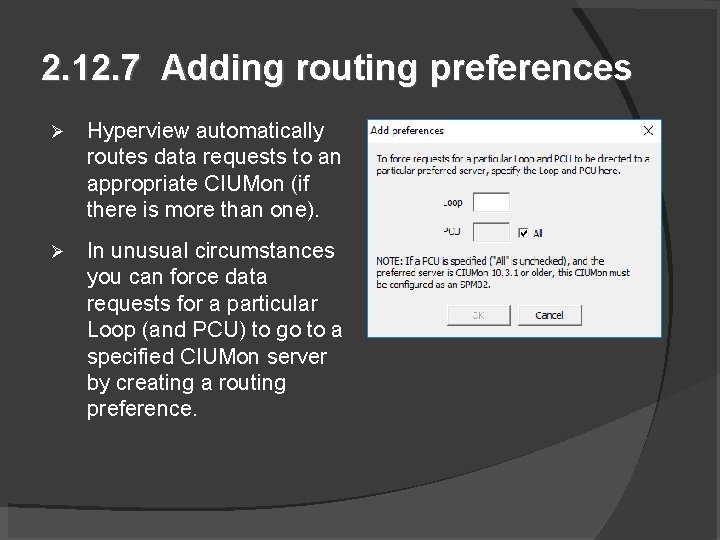
2. 12. 7 Adding routing preferences Hyperview automatically routes data requests to an appropriate CIUMon (if there is more than one). In unusual circumstances you can force data requests for a particular Loop (and PCU) to go to a specified CIUMon server by creating a routing preference.
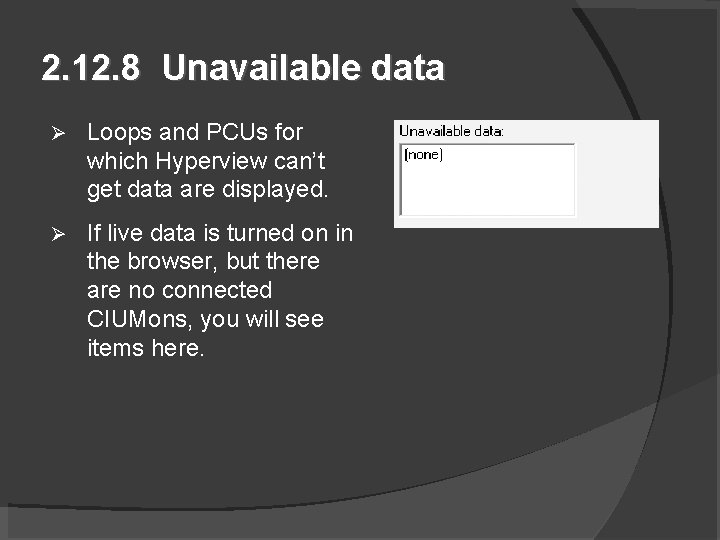
2. 12. 8 Unavailable data Loops and PCUs for which Hyperview can’t get data are displayed. If live data is turned on in the browser, but there are no connected CIUMons, you will see items here.
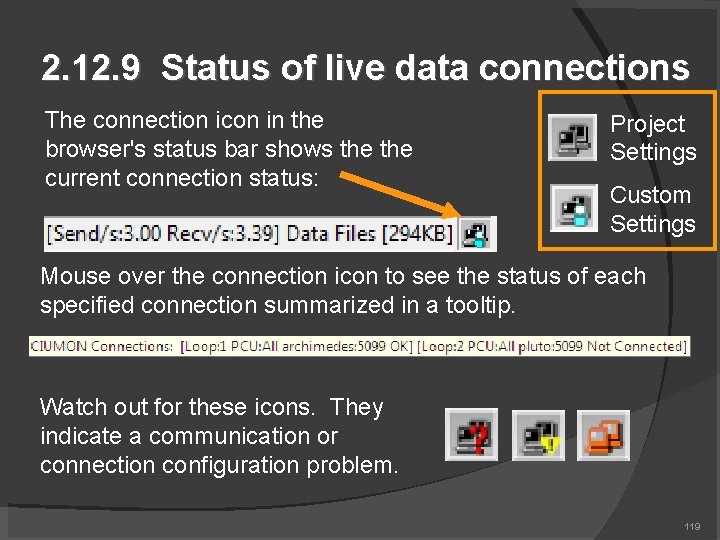
2. 12. 9 Status of live data connections The connection icon in the browser's status bar shows the current connection status: Project Settings Custom Settings Mouse over the connection icon to see the status of each specified connection summarized in a tooltip. Watch out for these icons. They indicate a communication or connection configuration problem. 119
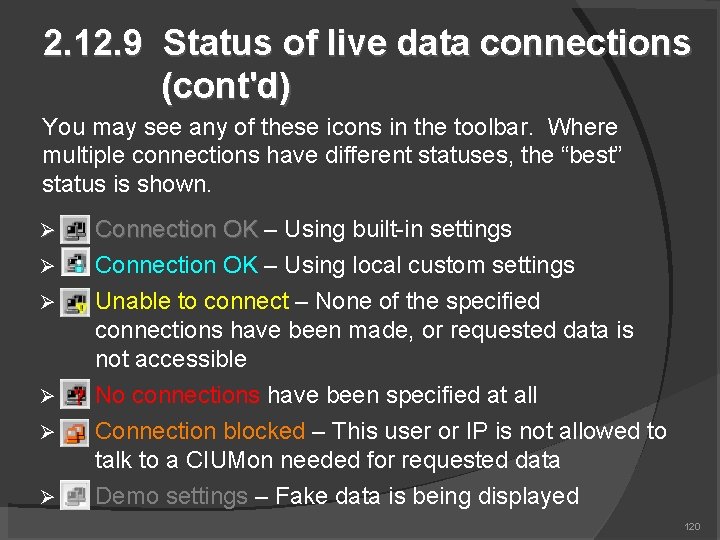
2. 12. 9 Status of live data connections (cont'd) You may see any of these icons in the toolbar. Where multiple connections have different statuses, the “best” status is shown. Connection OK – Using built-in settings Connection OK – Using local custom settings Unable to connect – None of the specified connections have been made, or requested data is not accessible No connections have been specified at all Connection blocked – This user or IP is not allowed to talk to a CIUMon needed for requested data Demo settings – Fake data is being displayed 120
2. 10 Compression of Hyperview data requests Both Hyperview and CIUMon try to compress multiple requests for the same data. If multiple requests are made for the same data in the same update interval, Hyperview combines them. If multiple Hyperviews request the same data from CIUMon in the same interval, CIUMon combines the requests before passing them on to the CIU. 121
2. 13 Managing live data load On most systems, live data fetch rate is very limited. 10 -20 values per second per CIU is typical. Multiple Hyperviews may share this bandwidth among themselves and with your other applications. General strategies to cope: Use Rovisys OPC 90 Server to get 50 -100 values per second! Contact GMCL for more information. Be aware of the live data load you are creating! Know how to minimize your own live data load. Use more CIUMon servers if you have multiple CIUs. Make use of any serial port modules you may have available. 122
2. 13. 1. 1 Constraints on live data fetch rate Fast facts: A single CIU can give up to 20 values/s Multiple CIUs can give up to 20 values/s each Serial port modules can give 80 values/s Rovisys OPC 90 Server gives 50 -100 values/s To increase bandwidth: Multiplex CIUMon servers to your EWS CIUs using OPC 90 Servers. Use multiple CIUMon servers Use serial port modules as much as possible 123
2. 13. 1. 1 Constraints on live data fetch rate (cont’d) Single CIU Will probably be on Ring 1 (unless not possible, or main system not Loop 1) Limited to 20 values / second Non Loop-1 data will be fetched via Loop 1 – be aware of increased Loop 1 load 124
2. 13. 1. 1 Constraints on live data fetch rate (cont’d) Multiple CIUs You have more than one EWS, connected to CIUs on different loops. CIUMon can share the CIU connection with the EWS Multiplex CIUMon and EWS using Rovi. Sys OPC 90 Server Lite Plus. DOUBLE or TRIPLE data rate with new 2010 OPC 90 Server. 10 -20% cost of CIU makes its spare bandwidth available for DBDOC Get up to 20 more values/s in Hyperview for each connected CIU 125
2. 13. 1. 1 Constraints on live data fetch rate (cont’d) Serial Port Modules SPMs very useful when used with DBDOC Each can give up to 80 values / second System directly gains throughput, since data fetched via an SPM does not load the CIU 126
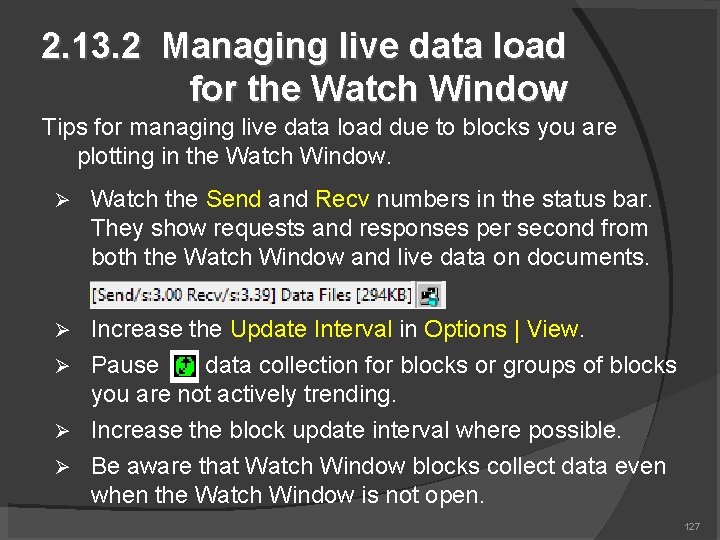
2. 13. 2 Managing live data load for the Watch Window Tips for managing live data load due to blocks you are plotting in the Watch Window. Watch the Send and Recv numbers in the status bar. They show requests and responses per second from both the Watch Window and live data on documents. Increase the Update Interval in Options | View. Pause data collection for blocks or groups of blocks you are not actively trending. Increase the block update interval where possible. Be aware that Watch Window blocks collect data even when the Watch Window is not open. 127
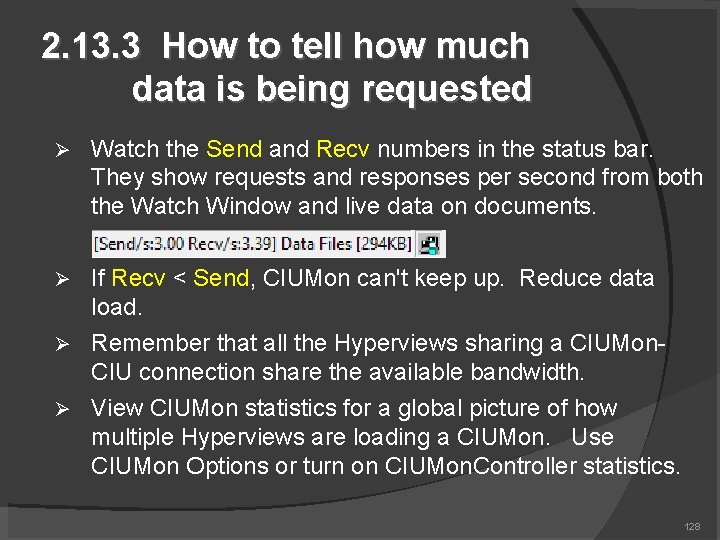
2. 13. 3 How to tell how much data is being requested Watch the Send and Recv numbers in the status bar. They show requests and responses per second from both the Watch Window and live data on documents. If Recv < Send, CIUMon can't keep up. Reduce data load. Remember that all the Hyperviews sharing a CIUMon. CIU connection share the available bandwidth. View CIUMon statistics for a global picture of how multiple Hyperviews are loading a CIUMon. Use CIUMon Options or turn on CIUMon. Controller statistics. 128

For more information on the Hyperview Browser See the online documentation at gmcl. com, or the built in application help. G. Michaels Consulting Ltd 129
- Slides: 129