
Hydrostatic Level Systems at Fermilab and DUSEL J
Hydrostatic Level Systems at Fermilab and DUSEL J Volk, V Shiltsev Fermilab USA A Chuprya, M Kondaurov, S Singatulin Budker Institute of Nuclear Physicis Russia L Stetler, J Van Beek South Dakota School of Mines and Technology USA J Volk Fermilab IWAA 11 Sept 2010
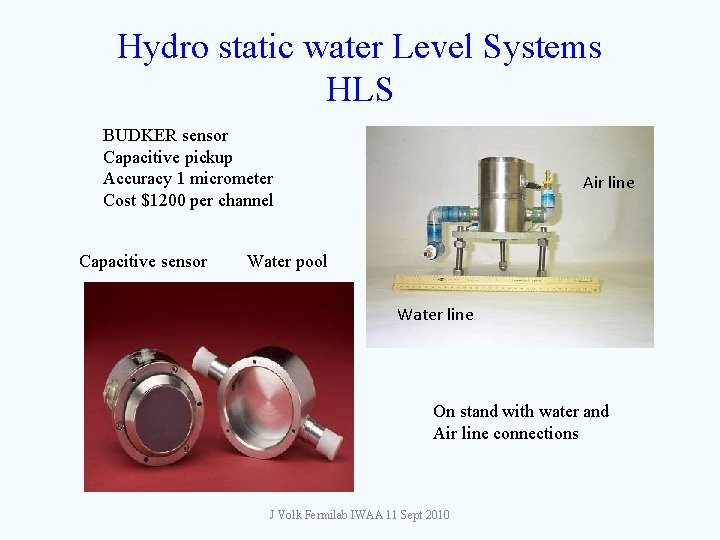
Hydro static water Level Systems HLS BUDKER sensor Capacitive pickup Accuracy 1 micrometer Cost $1200 per channel Capacitive sensor Air line Water pool Water line On stand with water and Air line connections J Volk Fermilab IWAA 11 Sept 2010
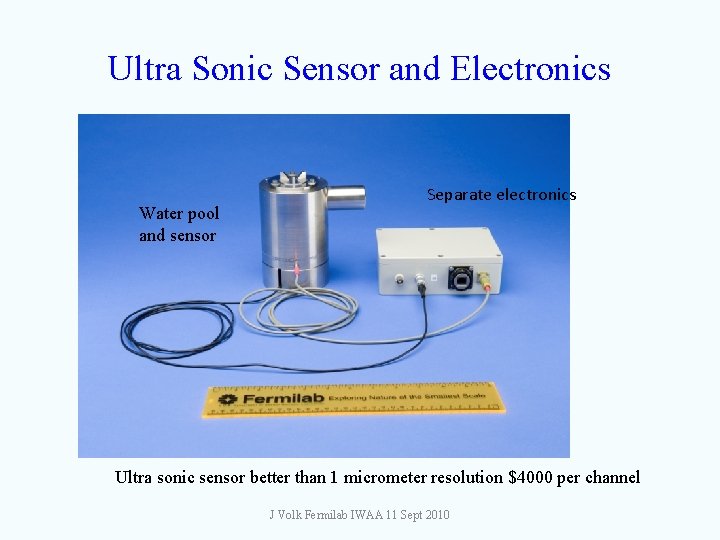
Ultra Sonic Sensor and Electronics Water pool and sensor Separate electronics Ultra sonic sensor better than 1 micrometer resolution $4000 per channel J Volk Fermilab IWAA 11 Sept 2010
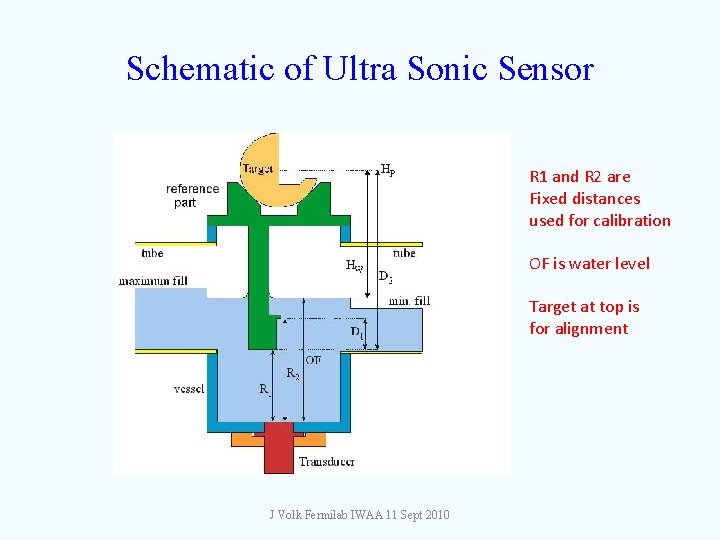
Schematic of Ultra Sonic Sensor R 1 and R 2 are Fixed distances used for calibration OF is water level Target at top is for alignment J Volk Fermilab IWAA 11 Sept 2010
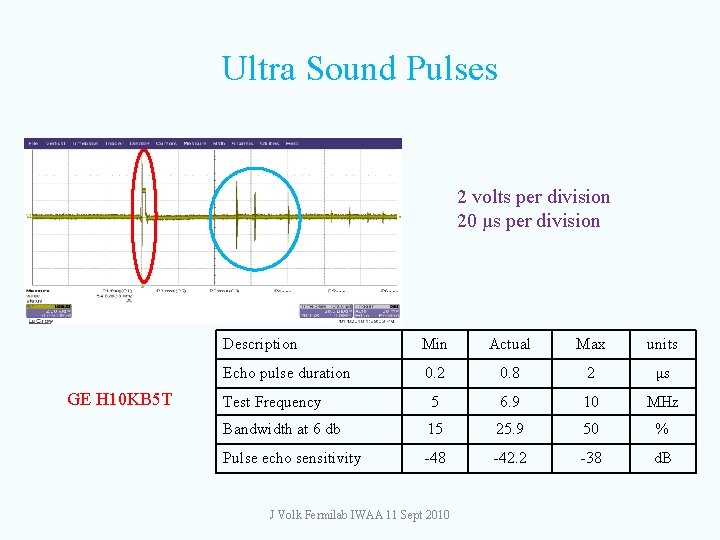
Ultra Sound Pulses 2 volts per division 20 μs per division GE H 10 KB 5 T Description Min Actual Max units Echo pulse duration 0. 2 0. 8 2 μs Test Frequency 5 6. 9 10 MHz Bandwidth at 6 db 15 25. 9 50 % Pulse echo sensitivity -48 -42. 2 -38 d. B J Volk Fermilab IWAA 11 Sept 2010

Fermilab design Tevatron style Balluff sensor and pool Power supply RS 232 port 8 channel readout card Ether net interface Paper in IWAA-08 J Volk Fermilab IWAA 11 Sept 2010
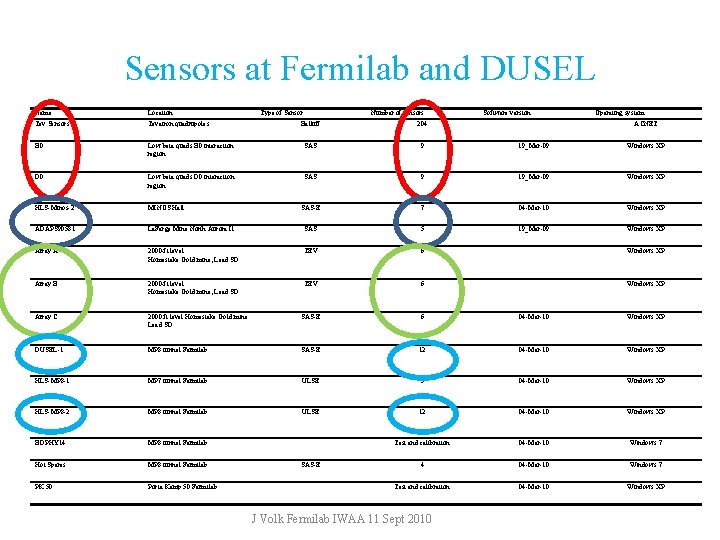
Sensors at Fermilab and DUSEL Name Location Tev Sensors Tevatron quadrupoles B 0 Type of Sensor Number of sensors Software version Operating system Balluff 204 Low beta quads B 0 interaction region SAS 9 19_Mar-09 Windows XP D 0 Low beta quads D 0 interaction region SAS 9 19_Mar-09 Windows XP HLS-Minos-2 MINOS Hall SAS-E 7 04 -Mar-10 Windows XP ADAPS 90581 La. Farge Mine North Aurora Il SAS 5 19_Mar-09 Windows XP Array A 2000 -ft level Homestake Gold mine, Lead SD TEV 6 Windows XP Array B 2000 -ft level Homestake Gold mine, Lead SD TEV 6 Windows XP Array C 2000 ft level Homestake Gold mine Lead SD SAS-E 6 04 -Mar-10 Windows XP DUSEL-1 MP 8 tunnel Fermilab SAS-E 12 04 -Mar-10 Windows XP HLS-MP 8 -1 MP 7 tunnel Fermilab ULSE 3 04 -Mar-10 Windows XP HLS-MP 8 -2 MP 8 tunnel Fermilab ULSE 12 04 -Mar-10 Windows XP BDPHY 14 MP 8 tunnel Fermilab Test and calibration 04 -Mar-10 Windows 7 Hot Spares MP 8 tunnel Fermilab 4 04 -Mar-10 Windows 7 PK 50 Porta Kamp 50 Fermilab Test and calibration 04 -Mar-10 Windows XP SAS-E J Volk Fermilab IWAA 11 Sept 2010 ACNET
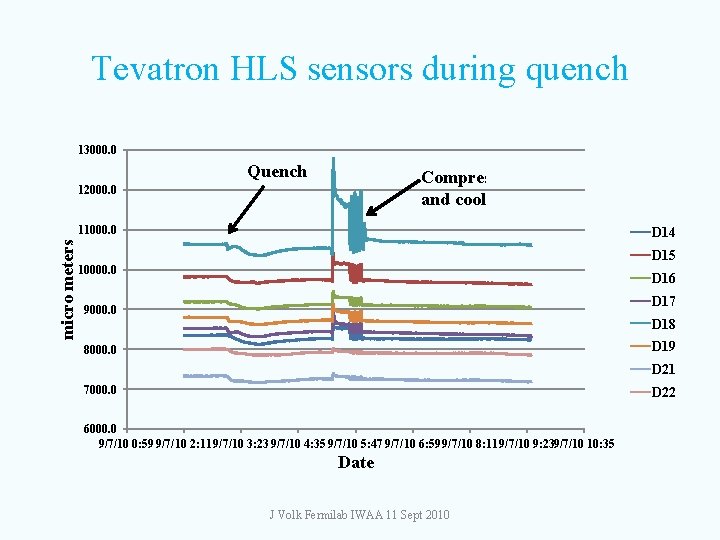
Tevatron HLS sensors during quench 13000. 0 Quench Compressors turning on and cool down 12000. 0 micro meters 11000. 0 D 14 D 15 10000. 0 D 16 D 17 9000. 0 D 18 D 19 8000. 0 D 21 7000. 0 D 22 6000. 0 9/7/10 0: 59 9/7/10 2: 11 9/7/10 3: 23 9/7/10 4: 35 9/7/10 5: 47 9/7/10 6: 59 9/7/10 8: 11 9/7/10 9: 239/7/10 10: 35 Date J Volk Fermilab IWAA 11 Sept 2010
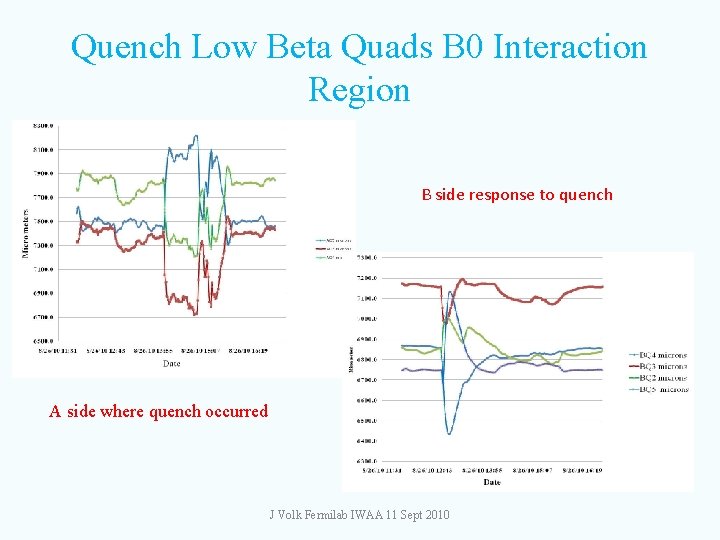
Quench Low Beta Quads B 0 Interaction Region B side response to quench A side where quench occurred J Volk Fermilab IWAA 11 Sept 2010
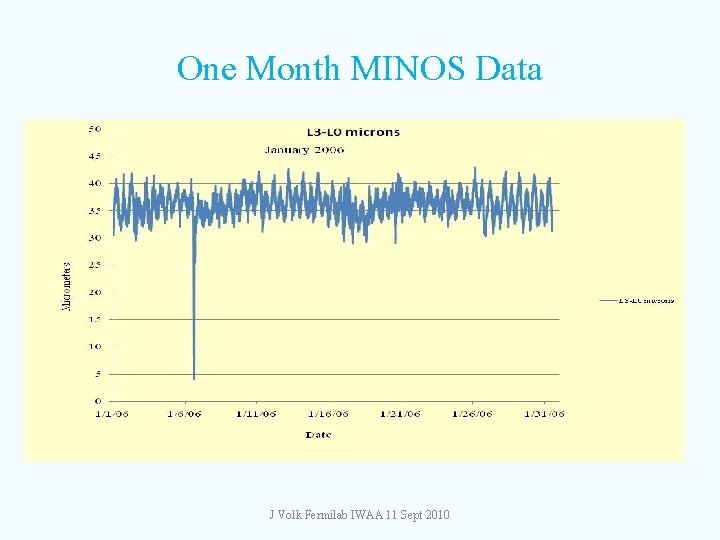
One Month MINOS Data J Volk Fermilab IWAA 11 Sept 2010
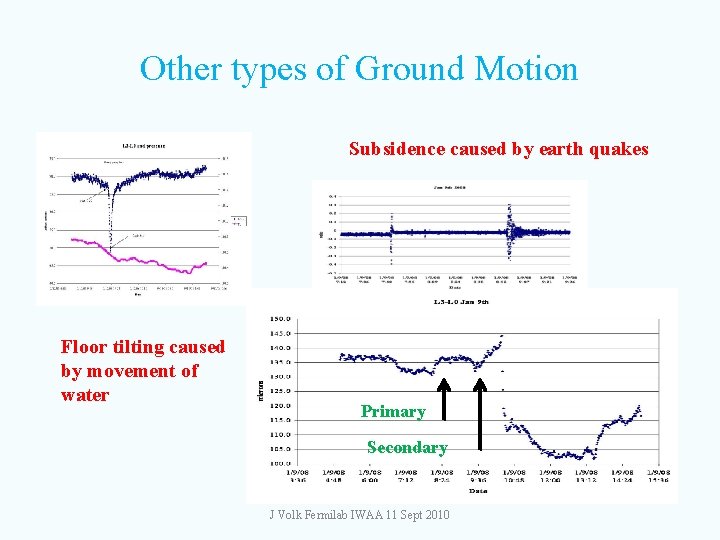
Other types of Ground Motion Subsidence caused by earth quakes Floor tilting caused by movement of water Primary Secondary J Volk Fermilab IWAA 11 Sept 2010
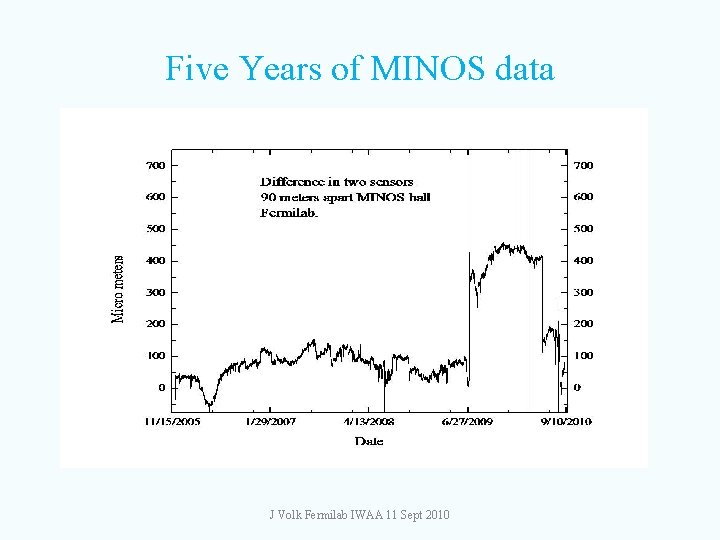
Five Years of MINOS data J Volk Fermilab IWAA 11 Sept 2010
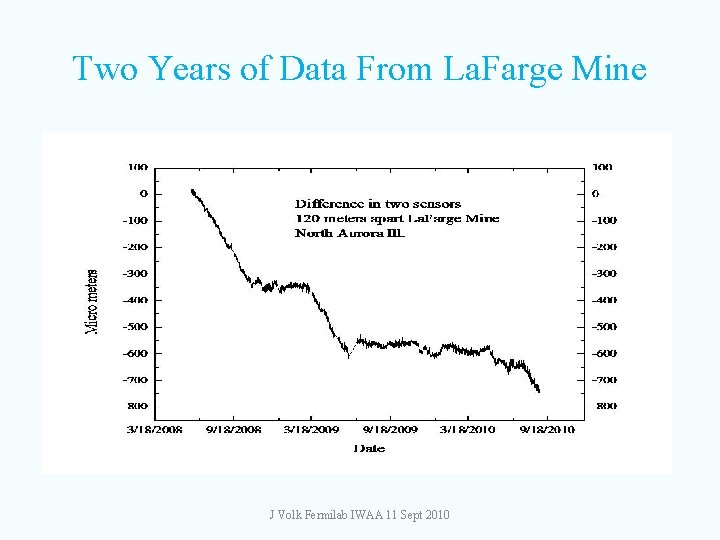
Two Years of Data From La. Farge Mine J Volk Fermilab IWAA 11 Sept 2010
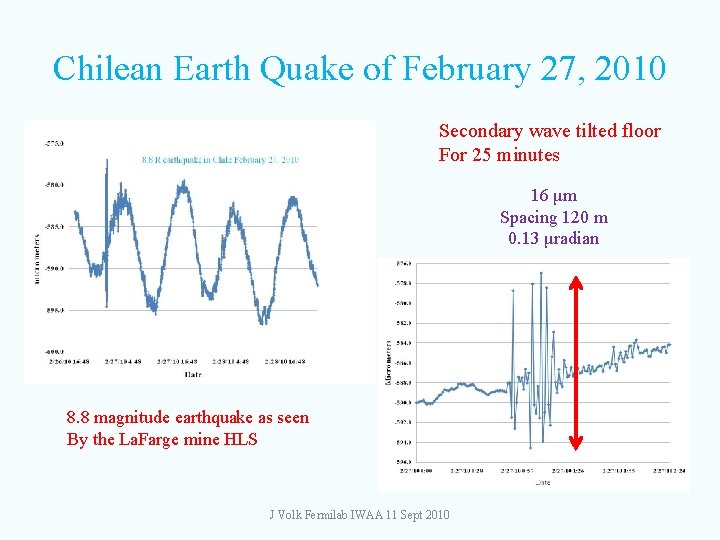
Chilean Earth Quake of February 27, 2010 Secondary wave tilted floor For 25 minutes 16 μm Spacing 120 m 0. 13 μradian 8. 8 magnitude earthquake as seen By the La. Farge mine HLS J Volk Fermilab IWAA 11 Sept 2010

DUSEL Lead South Dakota Cross section of Homestake gold mine Yates Shaft Ross shaft 1. 2 km Homestake gold mine J Volk Fermilab IWAA 11 Sept 2010
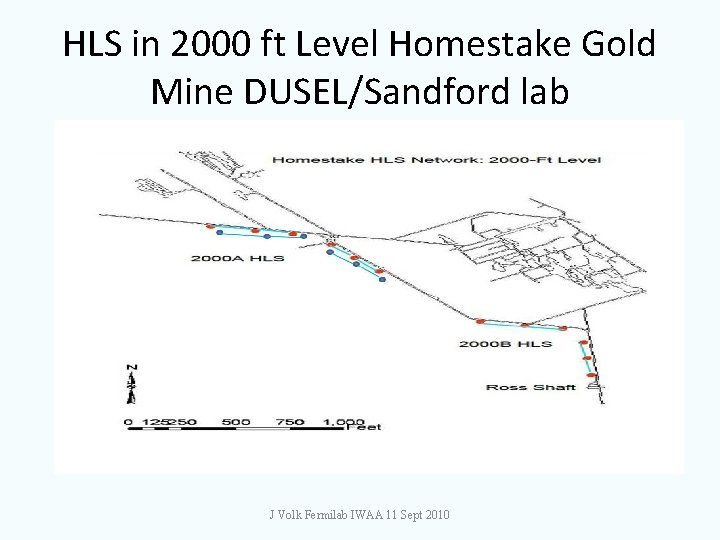
HLS in 2000 ft Level Homestake Gold Mine DUSEL/Sandford lab J Volk Fermilab IWAA 11 Sept 2010
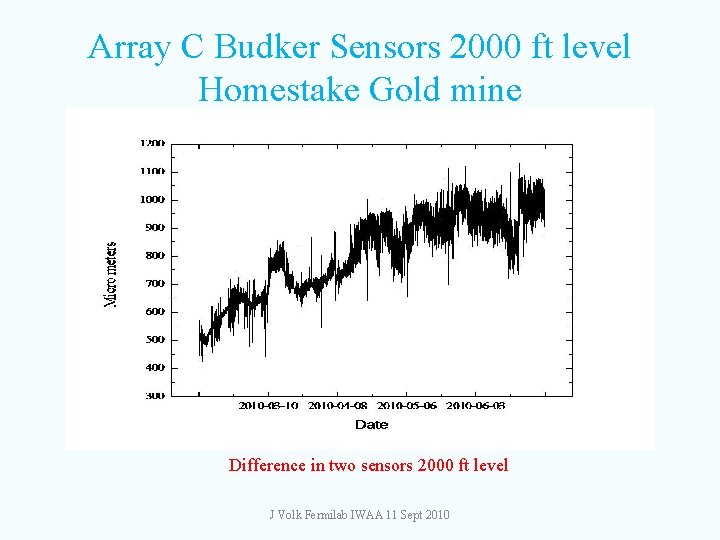
Array C Budker Sensors 2000 ft level Homestake Gold mine Difference in two sensors 2000 ft level J Volk Fermilab IWAA 11 Sept 2010
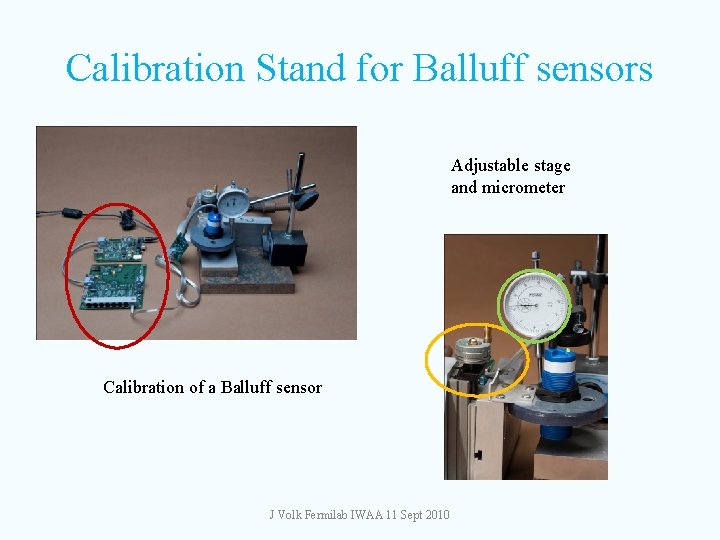
Calibration Stand for Balluff sensors Adjustable stage and micrometer Calibration of a Balluff sensor J Volk Fermilab IWAA 11 Sept 2010
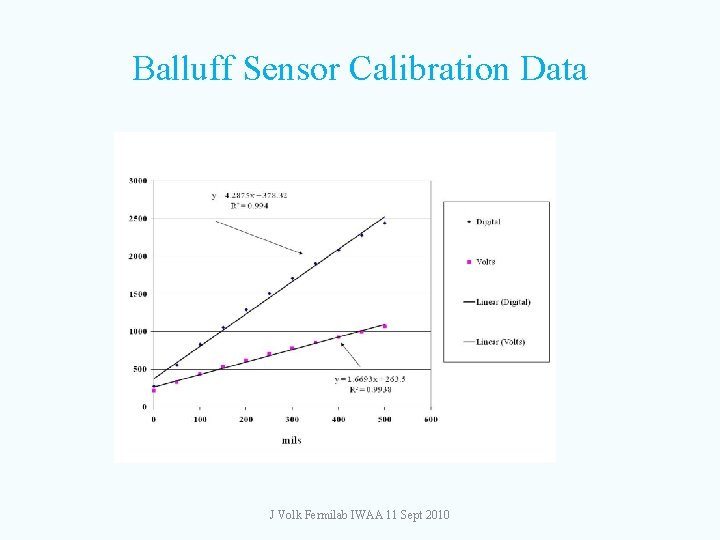
Balluff Sensor Calibration Data J Volk Fermilab IWAA 11 Sept 2010
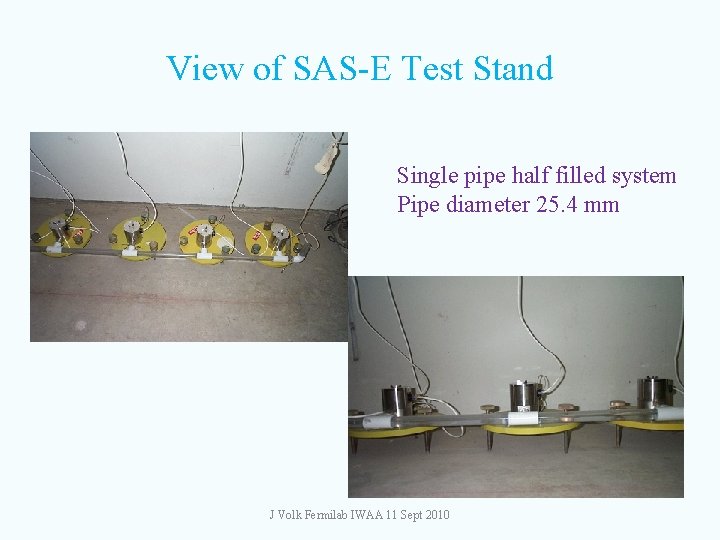
View of SAS-E Test Stand Single pipe half filled system Pipe diameter 25. 4 mm J Volk Fermilab IWAA 11 Sept 2010
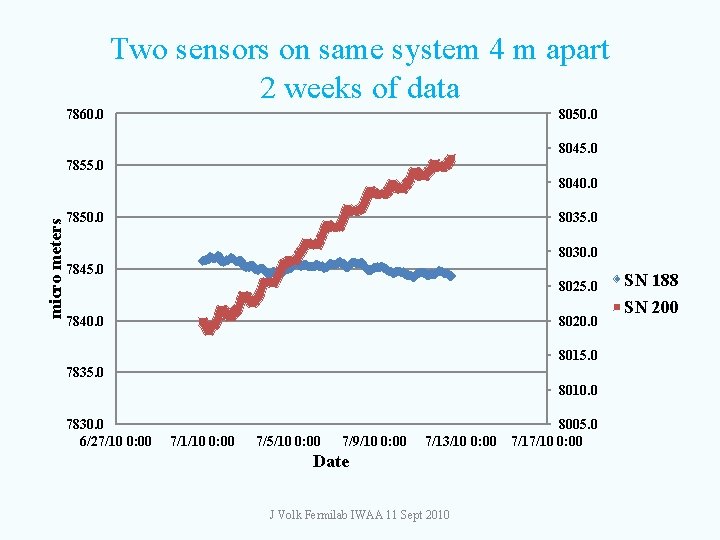
Two sensors on same system 4 m apart 2 weeks of data 7860. 0 8050. 0 8045. 0 7855. 0 micro meters 8040. 0 7850. 0 8035. 0 8030. 0 7845. 0 8025. 0 7840. 0 8020. 0 8015. 0 7835. 0 8010. 0 7830. 0 6/27/10 0: 00 7/1/10 0: 00 7/5/10 0: 00 7/9/10 0: 00 7/13/10 0: 00 Date J Volk Fermilab IWAA 11 Sept 2010 8005. 0 7/17/10 0: 00 SN 188 SN 200
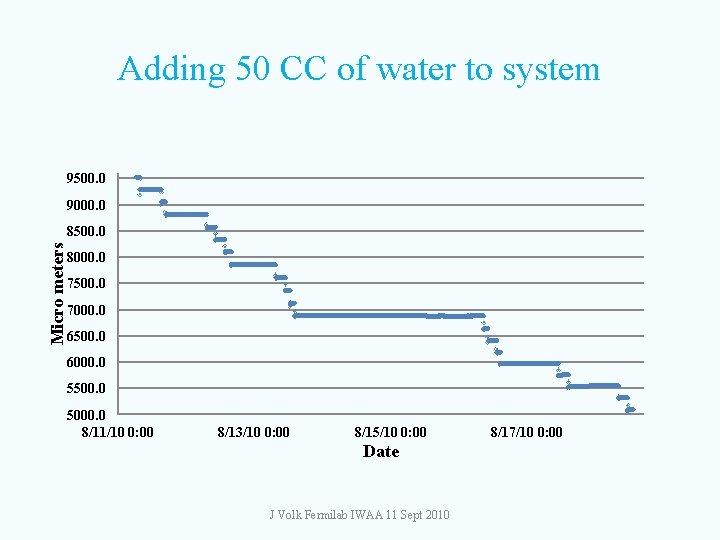
Adding 50 CC of water to system 9500. 0 9000. 0 Micro meters 8500. 0 8000. 0 7500. 0 7000. 0 6500. 0 6000. 0 5500. 0 5000. 0 8/11/10 0: 00 8/13/10 0: 00 8/15/10 0: 00 Date J Volk Fermilab IWAA 11 Sept 2010 8/17/10 0: 00
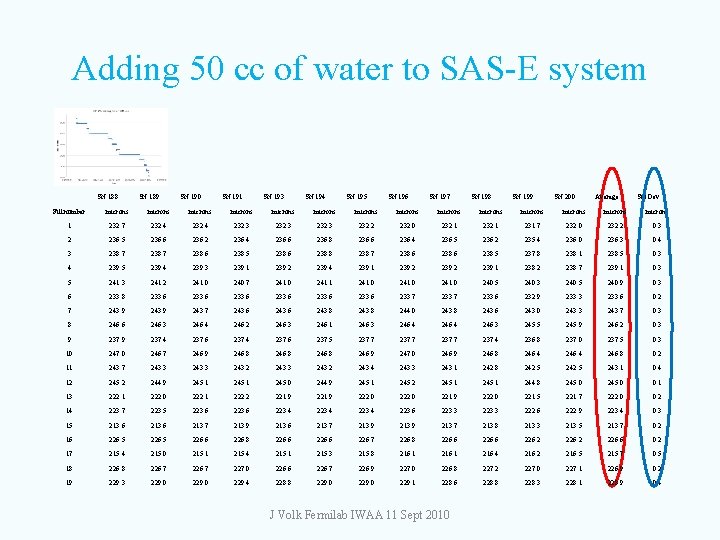
Adding 50 cc of water to SAS-E system SN 188 SN 189 SN 190 SN 191 SN 193 SN 194 SN 195 SN 196 SN 197 SN 198 SN 199 SN 200 Average Std Dev Fill number microns microns microns microns 1 232. 7 232. 4 232. 3 232. 2 232. 0 232. 1 231. 7 232. 0 232. 2 0. 3 2 236. 5 236. 6 236. 2 236. 4 236. 6 236. 8 236. 6 236. 4 236. 5 236. 2 235. 4 236. 0 236. 3 0. 4 3 238. 7 238. 6 238. 5 238. 6 238. 8 238. 7 238. 6 238. 5 237. 8 238. 1 238. 5 0. 3 4 239. 5 239. 4 239. 3 239. 1 239. 2 239. 4 239. 1 239. 2 239. 1 238. 2 238. 7 239. 1 0. 3 5 241. 3 241. 2 241. 0 240. 7 241. 0 241. 1 241. 0 240. 5 240. 3 240. 5 240. 9 0. 3 6 233. 8 233. 6 233. 7 233. 6 232. 9 233. 3 233. 6 0. 2 7 243. 9 243. 7 243. 6 243. 8 244. 0 243. 8 243. 6 243. 0 243. 3 243. 7 0. 3 8 246. 6 246. 3 246. 4 246. 2 246. 3 246. 1 246. 3 246. 4 246. 3 245. 5 245. 9 246. 2 0. 3 9 237. 4 237. 6 237. 5 237. 7 237. 4 236. 8 237. 0 237. 5 0. 3 10 247. 0 246. 7 246. 9 246. 8 246. 9 247. 0 246. 9 246. 8 246. 4 246. 8 0. 2 11 243. 7 243. 3 243. 2 243. 4 243. 3 243. 1 242. 8 242. 5 243. 1 0. 4 12 245. 2 244. 9 245. 1 245. 0 244. 9 245. 1 245. 2 245. 1 244. 8 245. 0 0. 1 13 222. 1 222. 0 222. 1 222. 2 221. 9 222. 0 221. 5 221. 7 222. 0 0. 2 14 223. 7 223. 5 223. 6 223. 4 223. 6 223. 3 222. 6 222. 9 223. 4 0. 3 15 213. 6 213. 7 213. 9 213. 7 213. 8 213. 3 213. 5 213. 7 0. 2 16 226. 5 226. 6 226. 8 226. 6 226. 7 226. 8 226. 6 226. 2 226. 6 0. 2 17 215. 4 215. 0 215. 1 215. 4 215. 1 215. 3 215. 8 216. 1 216. 4 216. 2 216. 5 215. 7 0. 5 18 226. 7 227. 0 226. 6 226. 7 226. 9 227. 0 226. 8 227. 2 227. 0 227. 1 226. 9 0. 2 19 229. 3 229. 0 229. 4 228. 8 229. 0 229. 1 228. 6 228. 8 228. 3 228. 1 228. 9 0. 4 J Volk Fermilab IWAA 11 Sept 2010
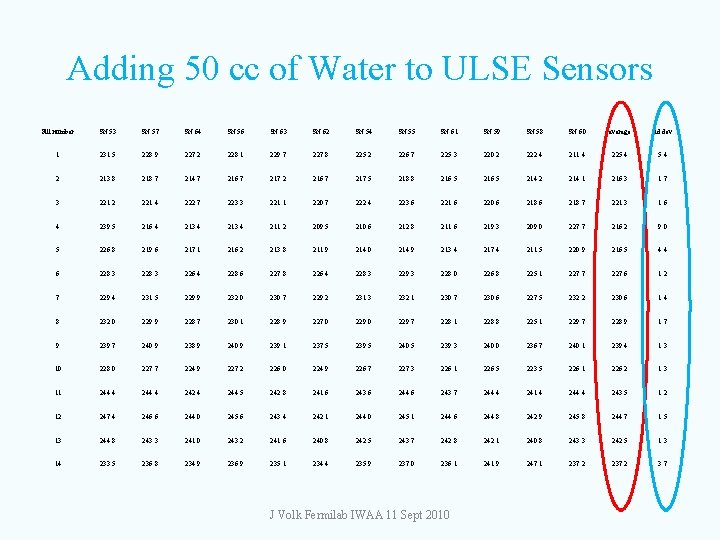
Adding 50 cc of Water to ULSE Sensors Fill number SN 53 SN 57 SN 64 SN 56 SN 63 SN 62 SN 54 SN 55 SN 61 SN 59 SN 58 SN 60 average std dev 1 231. 5 228. 9 227. 2 228. 1 229. 7 227. 8 225. 2 226. 7 225. 3 220. 2 222. 4 211. 4 225. 4 2 213. 8 218. 7 214. 7 216. 7 217. 2 216. 7 217. 5 218. 8 216. 5 214. 2 214. 1 216. 3 1. 7 3 221. 2 221. 4 222. 7 223. 3 221. 1 220. 7 222. 4 223. 6 221. 6 220. 6 218. 7 221. 3 1. 6 4 239. 5 216. 4 213. 4 211. 2 209. 5 210. 6 212. 8 211. 6 219. 3 209. 0 227. 7 216. 2 9. 0 5 226. 8 219. 6 217. 1 216. 2 213. 8 211. 9 214. 0 214. 9 213. 4 217. 4 211. 5 220. 9 216. 5 4. 4 6 228. 3 226. 4 228. 6 227. 8 226. 4 228. 3 229. 3 228. 0 226. 8 225. 1 227. 7 227. 6 1. 2 7 229. 4 231. 5 229. 9 232. 0 230. 7 229. 2 231. 3 232. 1 230. 7 230. 6 227. 5 232. 2 230. 6 1. 4 8 232. 0 229. 9 228. 7 230. 1 228. 9 227. 0 229. 7 228. 1 228. 8 225. 1 229. 7 228. 9 1. 7 9 239. 7 240. 9 238. 9 240. 9 239. 1 237. 5 239. 5 240. 5 239. 3 240. 0 236. 7 240. 1 239. 4 1. 3 10 228. 0 227. 7 224. 9 227. 2 226. 0 224. 9 226. 7 227. 3 226. 1 226. 5 223. 5 226. 1 226. 2 1. 3 11 244. 4 242. 4 244. 5 242. 8 241. 6 243. 6 244. 6 243. 7 244. 4 241. 4 244. 4 243. 5 1. 2 12 247. 4 246. 6 244. 0 245. 6 243. 4 242. 1 244. 0 245. 1 244. 6 244. 8 242. 9 245. 8 244. 7 1. 5 13 244. 8 243. 3 241. 0 243. 2 241. 6 240. 8 242. 5 243. 7 242. 8 242. 1 240. 8 243. 3 242. 5 1. 3 14 233. 5 236. 8 234. 9 236. 9 235. 1 234. 4 235. 9 237. 0 236. 1 241. 9 247. 1 237. 2 3. 7 J Volk Fermilab IWAA 11 Sept 2010
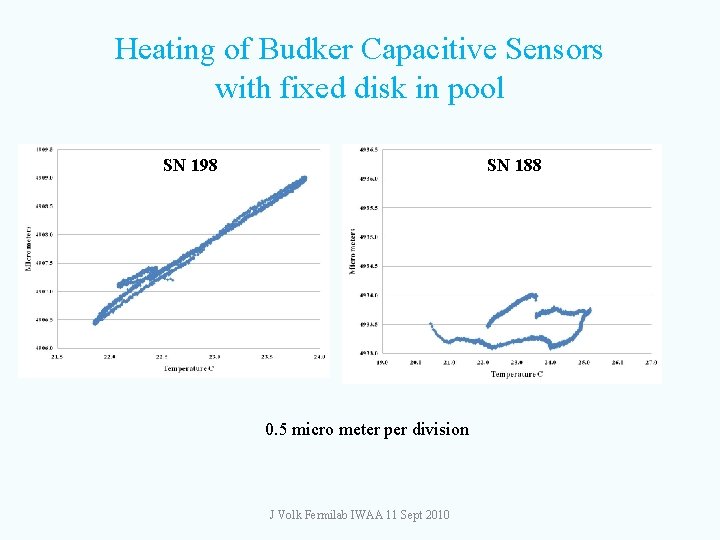
Heating of Budker Capacitive Sensors with fixed disk in pool SN 198 SN 188 0. 5 micro meter per division J Volk Fermilab IWAA 11 Sept 2010
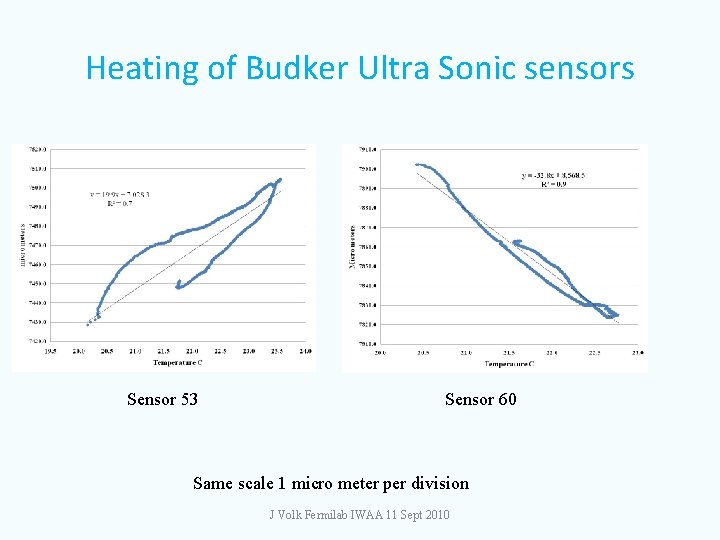
Heating of Budker Ultra Sonic sensors Sensor 53 Sensor 60 Same scale 1 micro meter per division J Volk Fermilab IWAA 11 Sept 2010
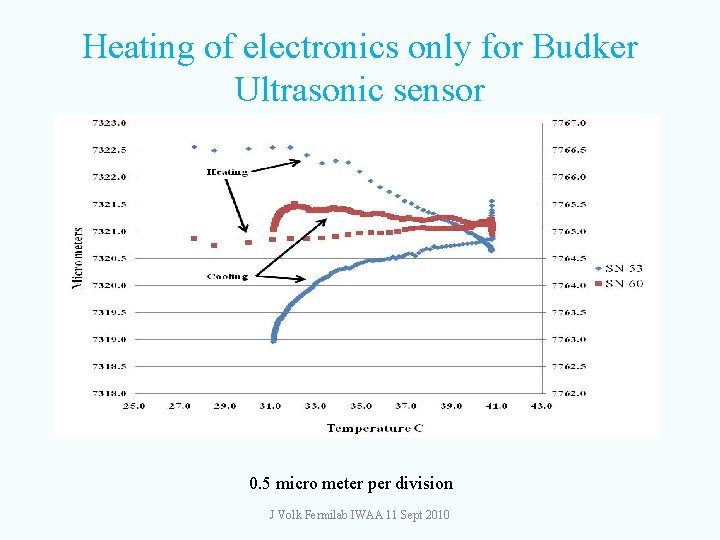
Heating of electronics only for Budker Ultrasonic sensor 0. 5 micro meter per division J Volk Fermilab IWAA 11 Sept 2010
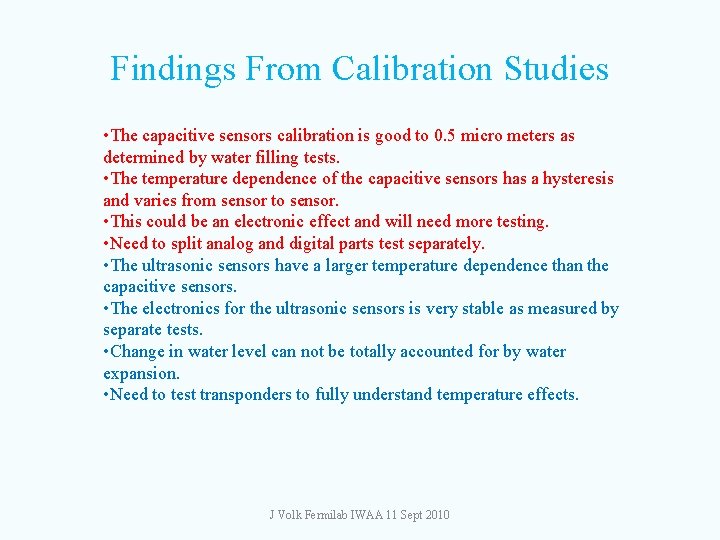
Findings From Calibration Studies • The capacitive sensors calibration is good to 0. 5 micro meters as determined by water filling tests. • The temperature dependence of the capacitive sensors has a hysteresis and varies from sensor to sensor. • This could be an electronic effect and will need more testing. • Need to split analog and digital parts test separately. • The ultrasonic sensors have a larger temperature dependence than the capacitive sensors. • The electronics for the ultrasonic sensors is very stable as measured by separate tests. • Change in water level can not be totally accounted for by water expansion. • Need to test transponders to fully understand temperature effects. J Volk Fermilab IWAA 11 Sept 2010
Conclusions • HLS can provide useful information for accelerator operations. • Resolutions of less than 1 micro meter are possible. • Stability test of systems needs more work. • Temperature dependence of electronics needs to be studied. • There is a need to cross calibrate different systems J Volk Fermilab IWAA 11 Sept 2010
Danke schön! Thank You For you attention I can be reached at volk@fnal. gov J Volk Fermilab IWAA 11 Sept 2010
- Slides: 30