Hydrologic Information System Analysis Modeling Decision Making Arc


 GIS Script (Proc.")


- Slides: 20
Hydrologic Information System Analysis, Modeling, Decision Making Arc Hydro Geodatabase
GIS Preprocessors for Hydrologic Models GIS Interface Model 1 Database Model 2 Model 3
Connecting Arc Hydro and Hydrologic Models Interface data models GIS HMS Geo Database Arc Hydro data model RAS WRAP
Nexrad Map to Flood Map in Model Builder FLO Flood map as output ODP LAIN MAP Model for flood flow HMS Nexrad map as input Model for flood depth
Arc Hydro Implementation Projects • LCRA – Arc Hydro geodatabase for Llano Basin – Interface geodatabase model for HEC-HMS – Experiments with Lib. Hydro on Llano Basin • SARA – Arc Hydro geodatabase for Salado and Rosillo Creeks – Interface geodatabase model for RAS (partly) – “Map to map” application using Model Builder
Lib. Hydro • A Fortran subroutine library of hydrologic processes developed from HEC-1 • Packaged in Lib. Hydro. DLL for operation under Visual Basic • Transforms input time series to output time series • More details on GISHydro 2003 CD
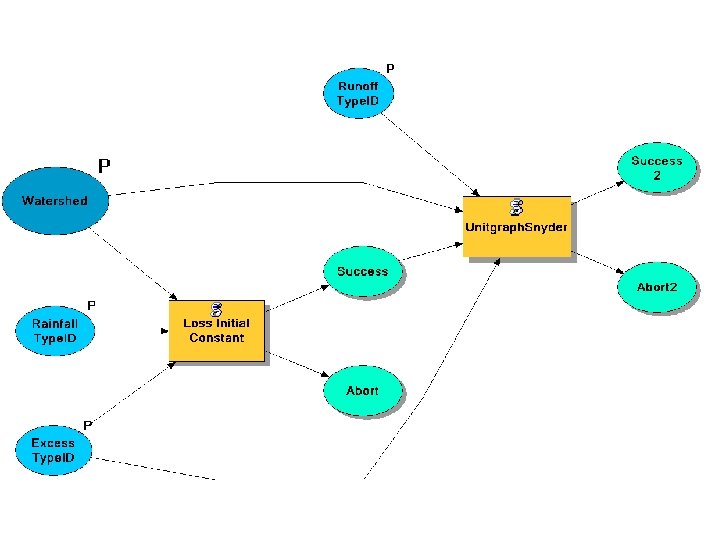
Excess Calculation • Initial Loss and Constant Loss Rate function Pick up a watershed Hydro. ID = 2346 Impervious. Area. Ratio = 0. 0001 Initial. Loss = 1. 6 (mm) Constant. Loss. Rate = 0. 38 (mm) Simulation Period: 7/21/97 – 7/23/97 (3 days) Time Interval: 15 minutes Time step: 4 * 24(hour) * 3(days) = 288
Runoff Calculation • Snyder Unit Hydrograph Pick up a watershed Watershed area: 266. 5 (km 2) Snyder. Cp: 0. 8 Snyder. Tp: 5. 58 (hr) Simulation Period: 7/21/97 – 7/23/97 (3 days) Time Interval: 15 minutes
Outflow Calculation • Add Baseflow module • Outflow = runoff + baseflow • Recession Ratio = 0. 95, Threshold value = 2 (m 3/s)
Schematic Network • Standard Arc Hydro data structure – Schematic Links – Schematic Nodes • Type 1 Nodes and Links for Watersheds • Type 2 Nodes and Links for Streams • Type 3 for …. .
Schematic Network Processes • Node processes – Rainfall-runoff and pollutant loads on watersheds – Summing flows or loads on streams – Water quality in water bodies • Link processes – Routing flows in streams – Pollutant losses in streams
Looping Through the Schematic Network Get Upstream Features Upstream Hydro. IDs Hydro. ID Topology Collection Feature, Values Get Upstream Values Process Upstream Values Receive Processed Value Collection Hydro. ID, New Value Update Value Collection See GISHydro 2003 CD for details Process Value to Pass Feature, Value Processed Value Pass Process
Schematic Network Process Implementation Geodatabase Arc. Toolbox Script Tool (Process. Schematic) GIS Script (Proc. Schematic. vbs) DLL (MBSchematic. dll) Script and DLLs Process DLL 1 Process DLL n
Regional Flood Control, Drainage, and Storm Water Management Program Partners in San Antonio
San Antonio River Basin
Interlocal Agreement Coverage Area Leon Medina Salado Cibilo Creek San Antonio River Watershed Area Sq. Mi. Population Cibolo Creek 204 97, 000 Leon Creek 235 278, 000 Medina River 290 83, 000 Salado Creek 222 349, 000 San Antonio River 270 582, 000
Prototype Application • Rosillo/Salado Creek watershed • Arc Hydro geodatabase developed for full Salado Creek watershed • TAMU and UT developed Arc Hydro-compliant, model-specific geodatabases for Rosillo Creek – HEC-HMS – HEC-RAS • Utilizing interfaces currently under development (Pre. Pro 2000/HEC-Geo. HMS, HEC-Geo. RAS) • Successfully linked the Rosillo Creek and Salado Creek models for HEC-HMS and HEC-RAS applications
Flood Alert / Flood Forecasting Flood Modeling and Forecasting • Coordination has begun with NWS River Forecast Center – Update river forecasting to 1 hour (currently 6 hours) – Evaluating flash flood forecasting for smaller watersheds • Evaluating integration of NEXRAD data into the proposed system