
Hydrogen Station Capacity Evaluation Tool Danny Terlip Sam


- Slides: 26
Hydrogen Station Capacity Evaluation Tool Danny Terlip, Sam Sprik, Josh Eichman, Dani Murphy, Mike Penev, Maggie Mann, Dan Leighton, Kevin Nixon, Jen Kurtz June 18, 2018
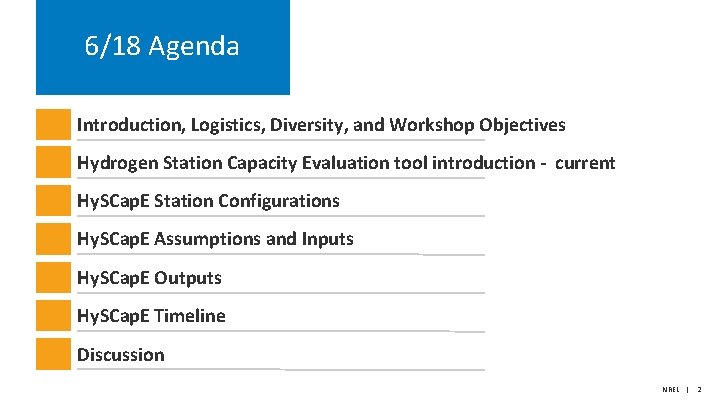
6/18 Agenda Introduction, Logistics, Diversity, and Workshop Objectives Hydrogen Station Capacity Evaluation tool introduction - current Hy. SCap. E Station Configurations Hy. SCap. E Assumptions and Inputs Hy. SCap. E Outputs Hy. SCap. E Timeline Discussion NREL | 2
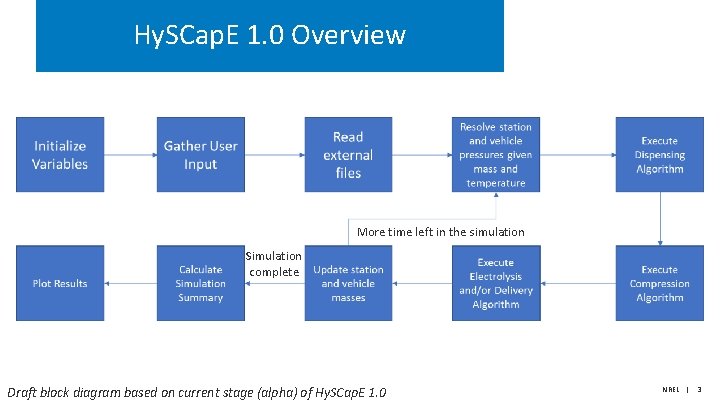
Hy. SCap. E 1. 0 Overview More time left in the simulation Simulation complete Draft block diagram based on current stage (alpha) of Hy. SCap. E 1. 0 NREL | 3
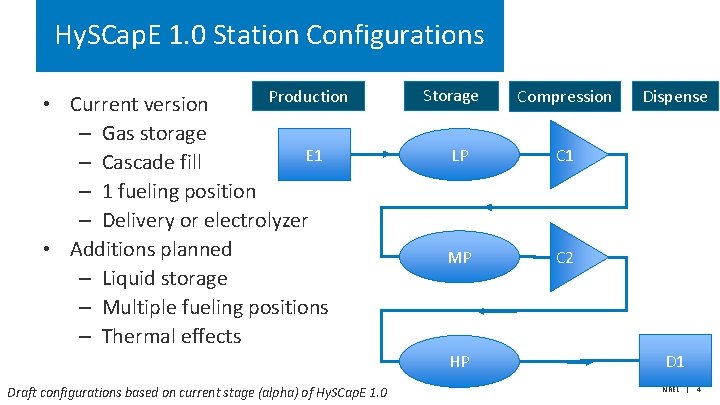
Hy. SCap. E 1. 0 Station Configurations Production • Current version – Gas storage E 1 – Cascade fill – 1 fueling position – Delivery or electrolyzer • Additions planned – Liquid storage – Multiple fueling positions – Thermal effects Storage LP C 1 MP C 2 HP Draft configurations based on current stage (alpha) of Hy. SCap. E 1. 0 Compression Dispense D 1 NREL | 4
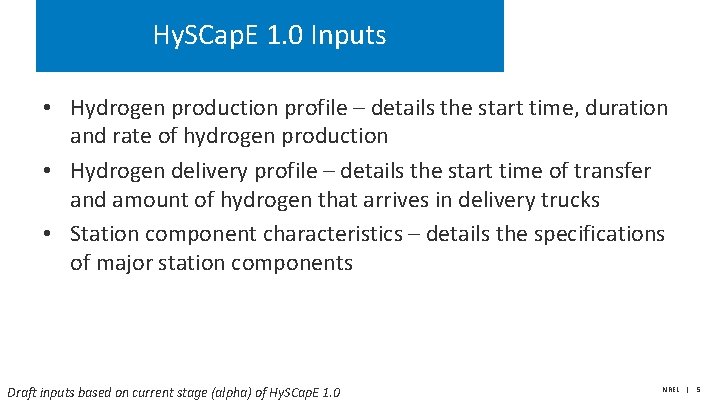
Hy. SCap. E 1. 0 Inputs • Hydrogen production profile – details the start time, duration and rate of hydrogen production • Hydrogen delivery profile – details the start time of transfer and amount of hydrogen that arrives in delivery trucks • Station component characteristics – details the specifications of major station components Draft inputs based on current stage (alpha) of Hy. SCap. E 1. 0 NREL | 5
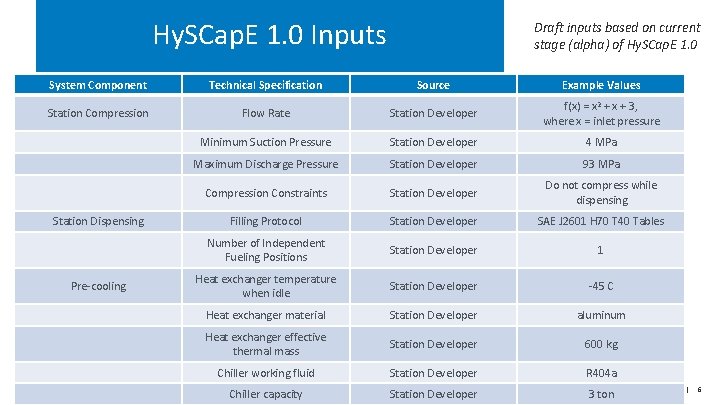
Hy. SCap. E 1. 0 Inputs Draft inputs based on current stage (alpha) of Hy. SCap. E 1. 0 System Component Technical Specification Source Example Values Station Compression Flow Rate Station Developer f(x) = x 2 + x + 3, where x = inlet pressure Minimum Suction Pressure Station Developer 4 MPa Maximum Discharge Pressure Station Developer 93 MPa Compression Constraints Station Developer Do not compress while dispensing Filling Protocol Station Developer SAE J 2601 H 70 T 40 Tables Number of Independent Fueling Positions Station Developer 1 Heat exchanger temperature when idle Station Developer -45 C Heat exchanger material Station Developer aluminum Heat exchanger effective thermal mass Station Developer 600 kg Chiller working fluid Station Developer R 404 a Chiller capacity Station Developer 3 ton Station Dispensing Pre-cooling NREL | 6
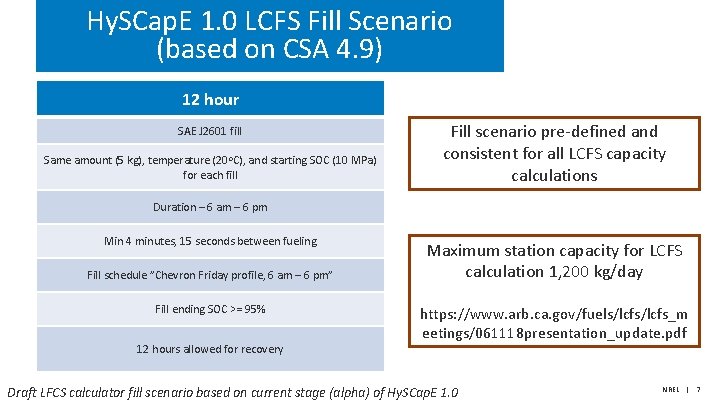
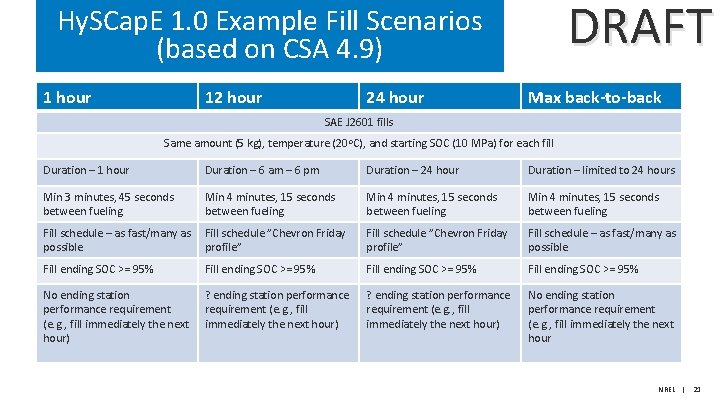
Hy. SCap. E 1. 0 LCFS Fill Scenario (based on CSA 4. 9) 12 hour SAE J 2601 fill Same amount (5 kg), temperature (20 o. C), and starting SOC (10 MPa) for each fill Fill scenario pre-defined and consistent for all LCFS capacity calculations Duration – 6 am – 6 pm Min 4 minutes, 15 seconds between fueling Fill schedule ”Chevron Friday profile, 6 am – 6 pm” Fill ending SOC >= 95% 12 hours allowed for recovery Maximum station capacity for LCFS calculation 1, 200 kg/day https: //www. arb. ca. gov/fuels/lcfs_m eetings/061118 presentation_update. pdf Draft LFCS calculator fill scenario based on current stage (alpha) of Hy. SCap. E 1. 0 NREL | 7
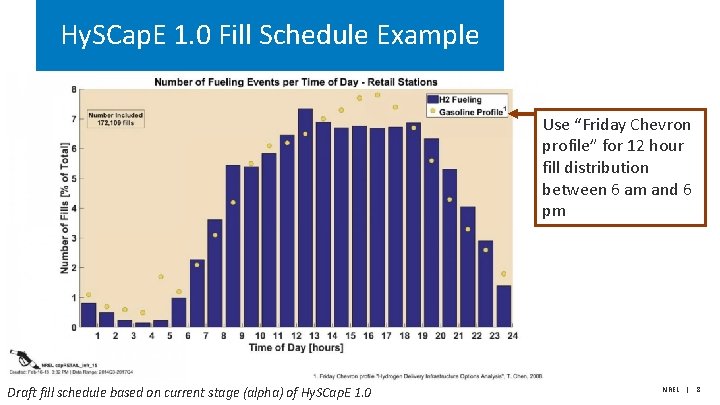
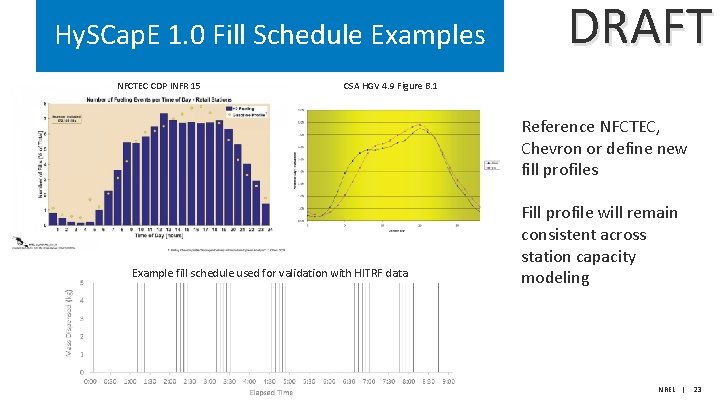
Hy. SCap. E 1. 0 Fill Schedule Example Use “Friday Chevron profile” for 12 hour fill distribution between 6 am and 6 pm Draft fill schedule based on current stage (alpha) of Hy. SCap. E 1. 0 NREL | 8
Hy. SCap. E 1. 0 Outputs • Fill count – the number of fills performed over the duration of the test • Fill amount – the mass of hydrogen dispensed for each fill • Duration – the amount of time from the start of the test to when an ending condition is met • Ending SOC – the final SOC of every vehicle fill • Cumulative kg – the total mass of hydrogen dispensed during the test Draft outputs based on current stage (alpha) of Hy. SCap. E 1. 0 NREL | 9
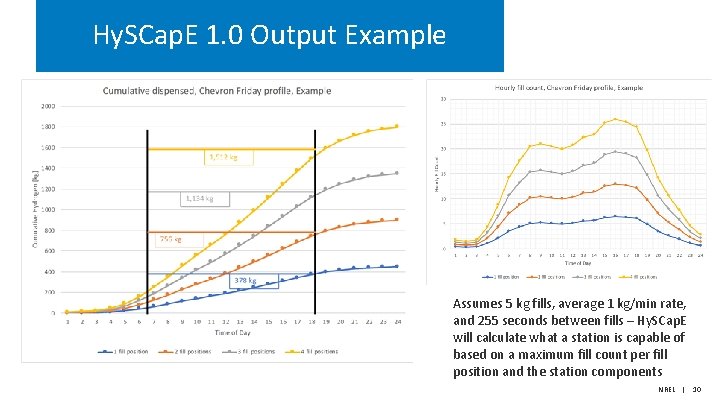
Hy. SCap. E 1. 0 Output Example Assumes 5 kg fills, average 1 kg/min rate, and 255 seconds between fills – Hy. SCap. E will calculate what a station is capable of based on a maximum fill count per fill position and the station components NREL | 10
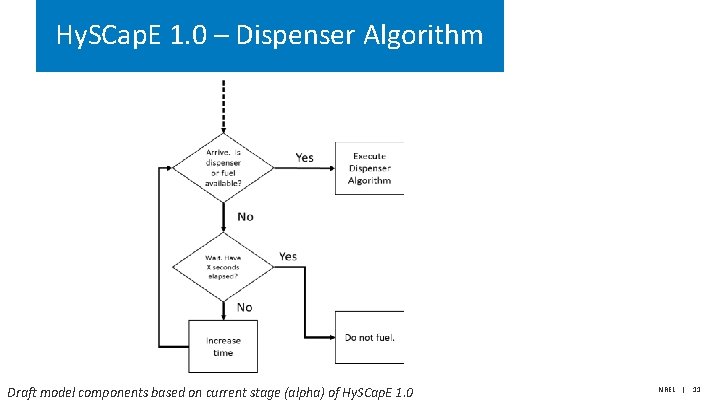
Hy. SCap. E 1. 0 – Dispenser Algorithm Draft model components based on current stage (alpha) of Hy. SCap. E 1. 0 NREL | 11
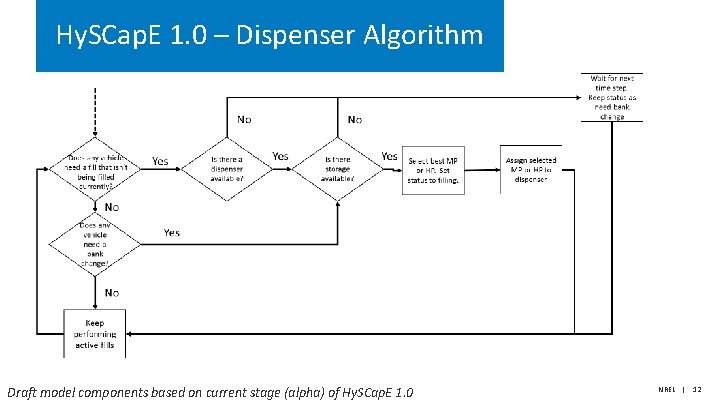
Hy. SCap. E 1. 0 – Dispenser Algorithm Draft model components based on current stage (alpha) of Hy. SCap. E 1. 0 NREL | 12
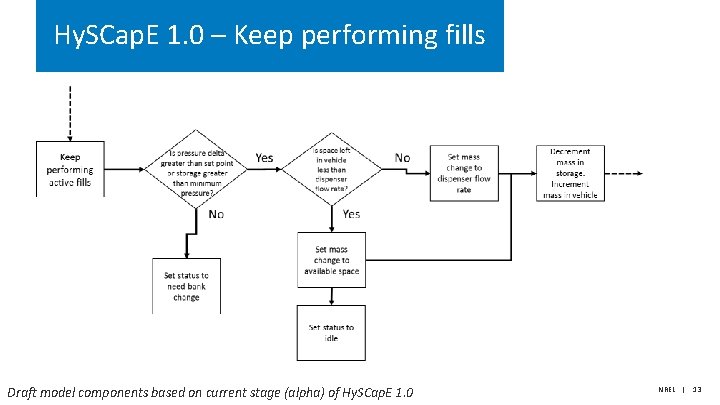
Hy. SCap. E 1. 0 – Keep performing fills Draft model components based on current stage (alpha) of Hy. SCap. E 1. 0 NREL | 13
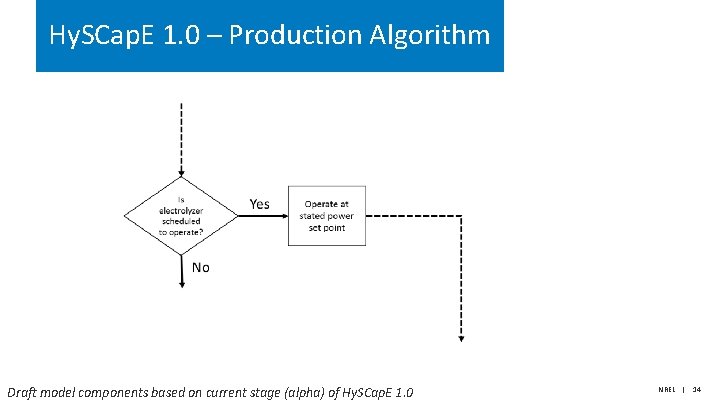
Hy. SCap. E 1. 0 – Production Algorithm Draft model components based on current stage (alpha) of Hy. SCap. E 1. 0 NREL | 14
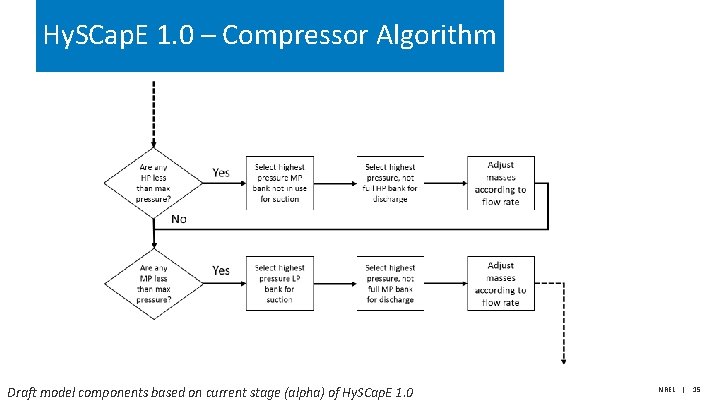
Hy. SCap. E 1. 0 – Compressor Algorithm Draft model components based on current stage (alpha) of Hy. SCap. E 1. 0 NREL | 15
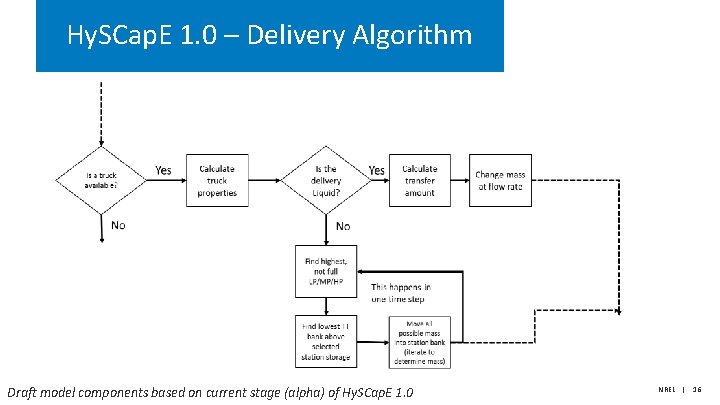
Hy. SCap. E 1. 0 – Delivery Algorithm Draft model components based on current stage (alpha) of Hy. SCap. E 1. 0 NREL | 16
Hy. SCap. E 1. 0 Timeline • • • Alpha development – Documentation – Validation • NREL’s experimental data • Existing retail hydrogen fill data – Define input/output/assumptions – Webinar Beta development – Added features (e. g. , liquid storage, multiple fuel positions) – Limited user trial – Model iteration – Documentation update – Webinar Model release – Version 1. 0 documentation and model share NREL | 17
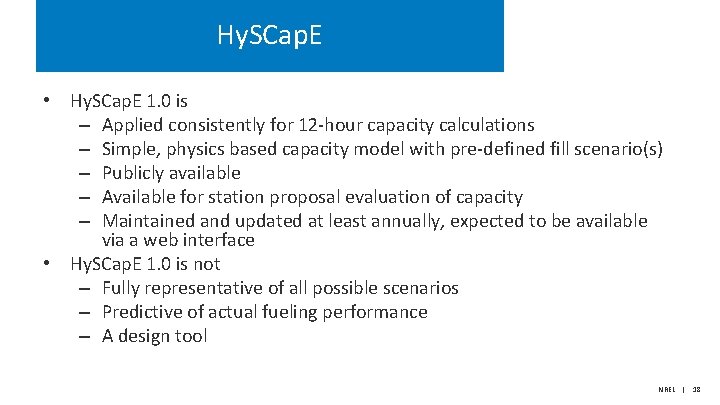
Hy. SCap. E • Hy. SCap. E 1. 0 is – Applied consistently for 12 -hour capacity calculations – Simple, physics based capacity model with pre-defined fill scenario(s) – Publicly available – Available for station proposal evaluation of capacity – Maintained and updated at least annually, expected to be available via a web interface • Hy. SCap. E 1. 0 is not – Fully representative of all possible scenarios – Predictive of actual fueling performance – A design tool NREL | 18
Thank you www. nrel. gov Publication Number NREL is a national laboratory of the U. S. Department of Energy, Office of Energy Efficiency and Renewable Energy, operated by the Alliance for Sustainable Energy, LLC.
Backup
DRAFT Hy. SCap. E 1. 0 Example Fill Scenarios (based on CSA 4. 9) 1 hour 12 hour 24 hour Max back-to-back SAE J 2601 fills Same amount (5 kg), temperature (20 o. C), and starting SOC (10 MPa) for each fill Duration – 1 hour Duration – 6 am – 6 pm Duration – 24 hour Duration – limited to 24 hours Min 3 minutes, 45 seconds between fueling Min 4 minutes, 15 seconds between fueling Fill schedule – as fast/many as Fill schedule ”Chevron Friday possible profile” Fill schedule ”Chevron Friday profile” Fill schedule – as fast/many as possible Fill ending SOC >= 95% No ending station performance requirement (e. g. , fill immediately the next hour) ? ending station performance requirement (e. g. , fill immediately the next hour) No ending station performance requirement (e. g. , fill immediately the next hour NREL | 21
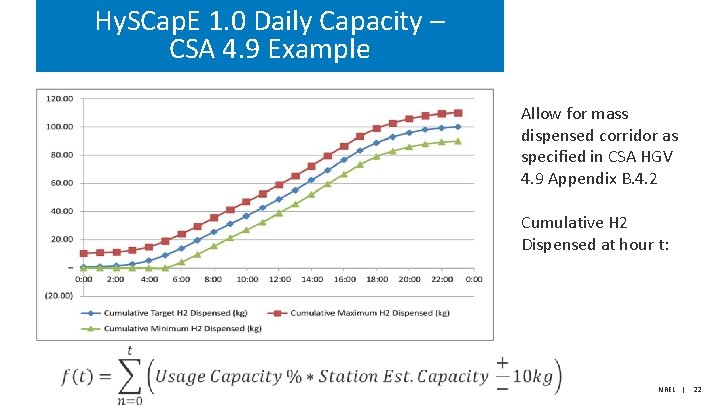
Hy. SCap. E 1. 0 Daily Capacity – CSA 4. 9 Example Allow for mass dispensed corridor as specified in CSA HGV 4. 9 Appendix B. 4. 2 Cumulative H 2 Dispensed at hour t: NREL | 22
Hy. SCap. E 1. 0 Fill Schedule Examples NFCTEC CDP INFR 15 DRAFT CSA HGV 4. 9 Figure B. 1 Reference NFCTEC, Chevron or define new fill profiles Example fill schedule used for validation with HITRF data Fill profile will remain consistent across station capacity modeling NREL | 23
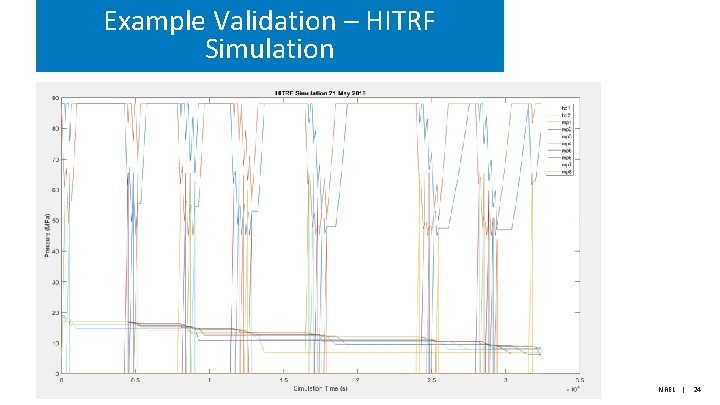
Example Validation – HITRF Simulation NREL | 24
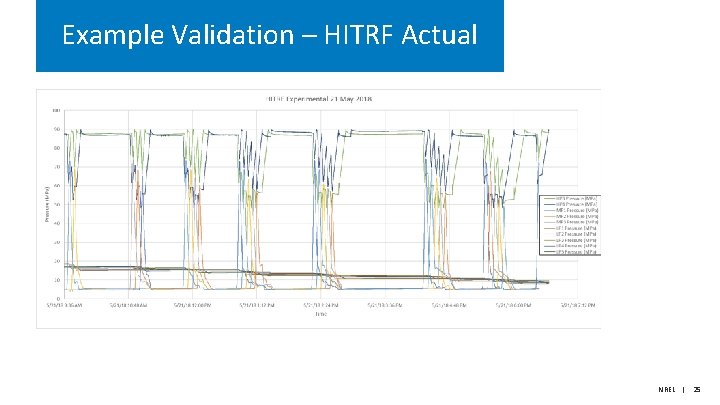
Example Validation – HITRF Actual NREL | 25
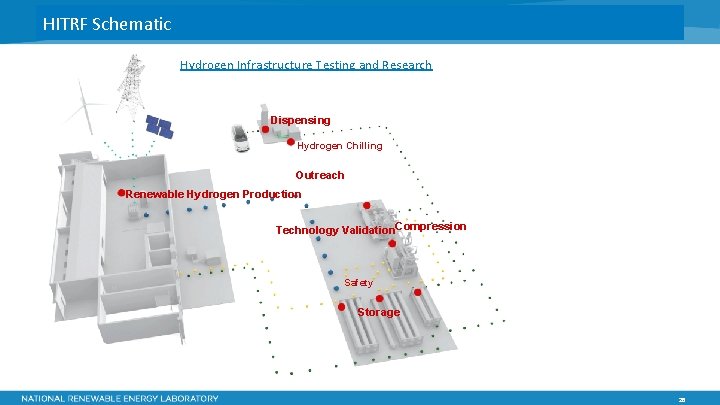
HITRF Schematic Hydrogen Infrastructure Testing and Research Dispensing Hydrogen Chilling Outreach Renewable Hydrogen Production Technology Validation. Compression Safety Storage 26