
Hydrogen 21 cm Cosmology TzuChing Chang ASIAA UeLi
- Slides: 29
Hydrogen 21 cm Cosmology Tzu-Ching Chang (ASIAA) Ue-Li Pen, Kiyo Masui (CITA) Jeff Peterson, Kevin Bandura, Tabitha Voytek, Aravind Natarajan (CMU) Pat Mc. Donald (LBNL) Victor Liao (ASIAA)
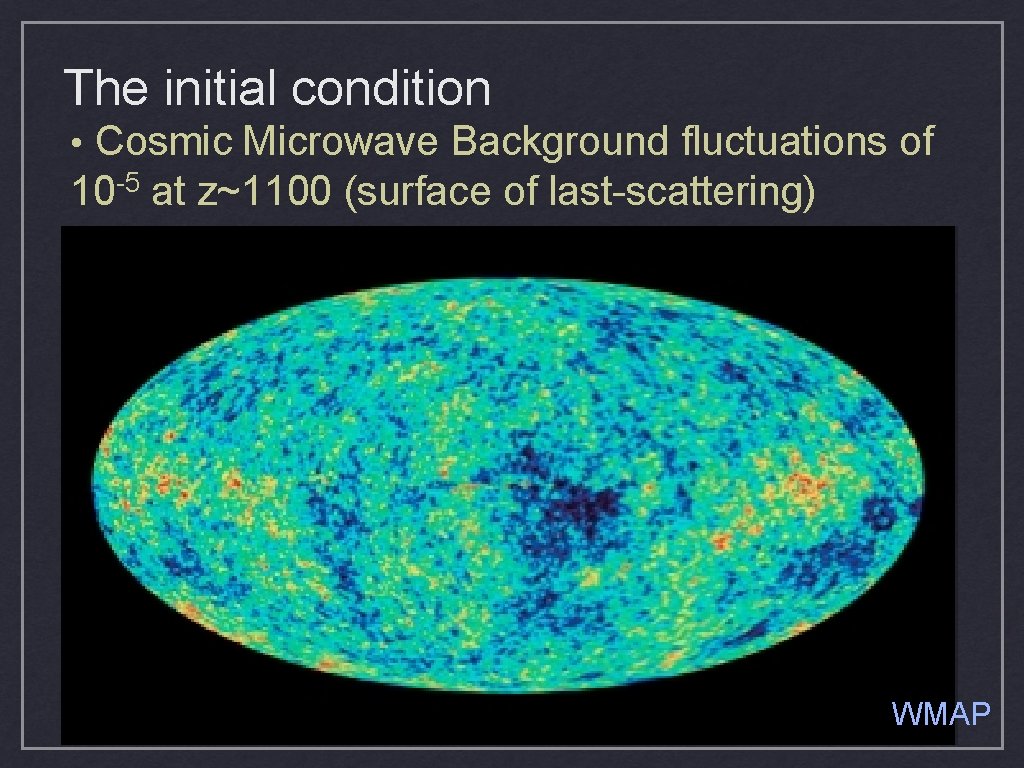
The initial condition • Cosmic Microwave Background fluctuations of -5 10 at z~1100 (surface of last-scattering) WMAP
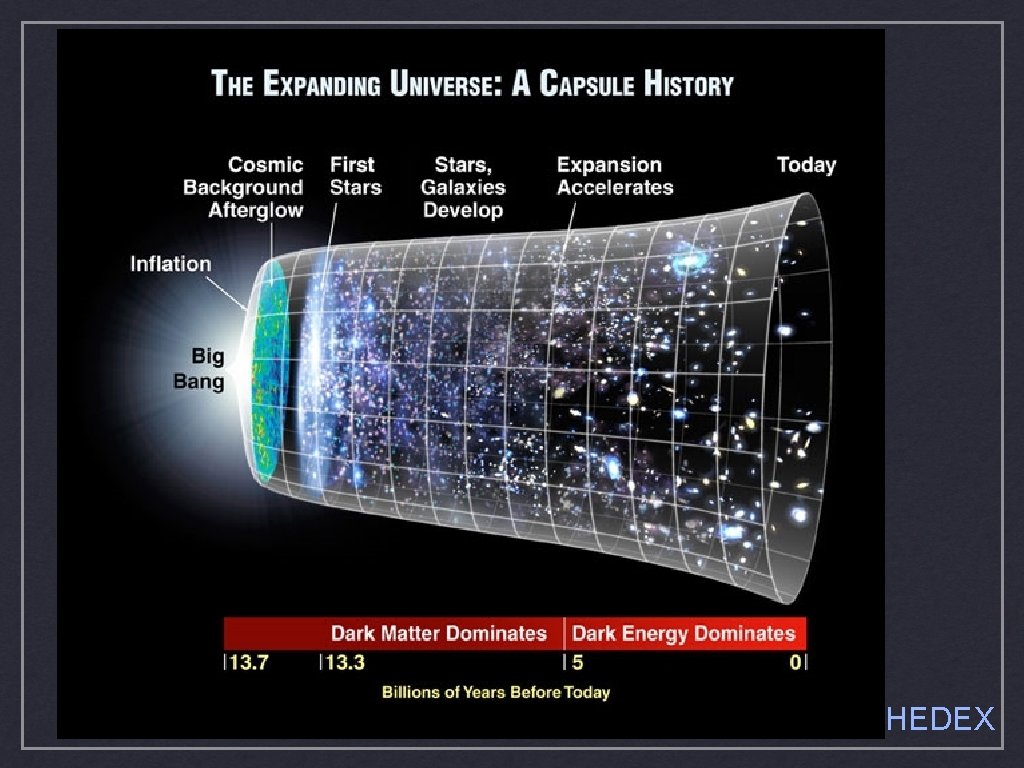
HEDEX
Dark Energy • Dominates the current energy budget of the Universe • Causes accelerated expansion • Modifies growth of structure • Unknown origins • Most prosaic “explanation” is a cosmological constant • Well established observationally (e. g. SNe) • A sensitive probe - Baryon Acoustic Oscillation
Baryon Acoustic Oscillations Sound waves in the photonbaryon plasma in the early universe propagate from density perturbations; they freeze out when universe transited from radiation to matter domination (recombination). • Thus they have a characteristic scale of 100 h 1 Mpc (~150 Mpc), corresponding to the sound horizon at recombination at z~1100. • Courtesy of D. Eisenstein
Baryon Acoustic Oscillation • A more subtle feature when superposed on a complex density field
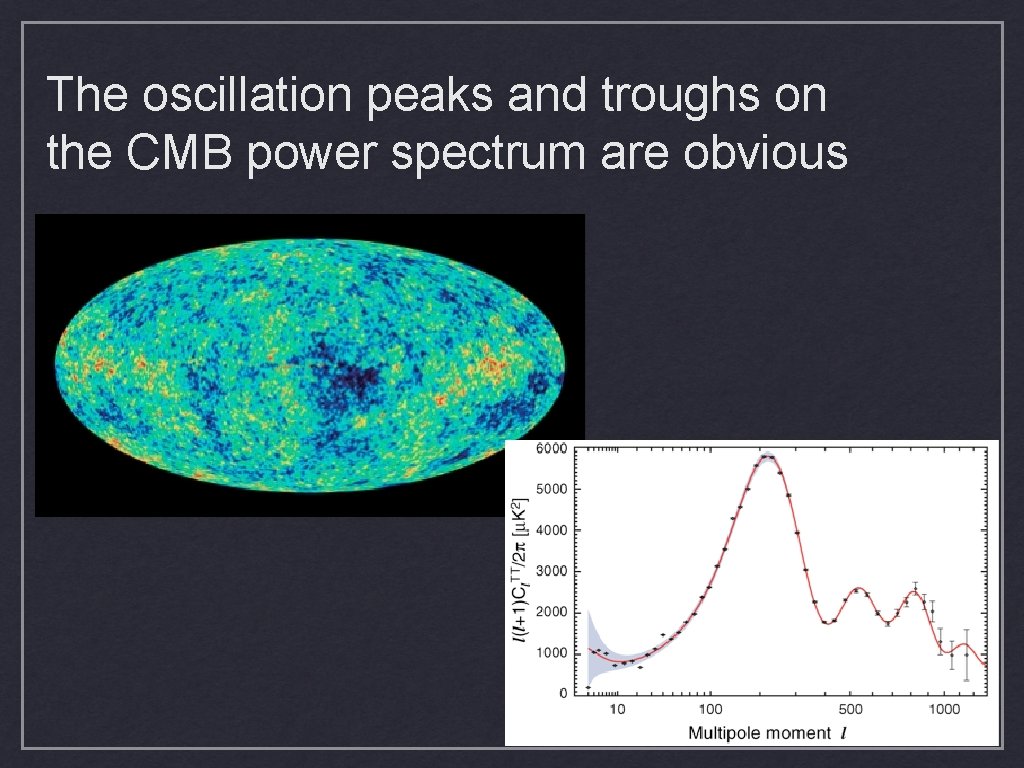
The oscillation peaks and troughs on the CMB power spectrum are obvious
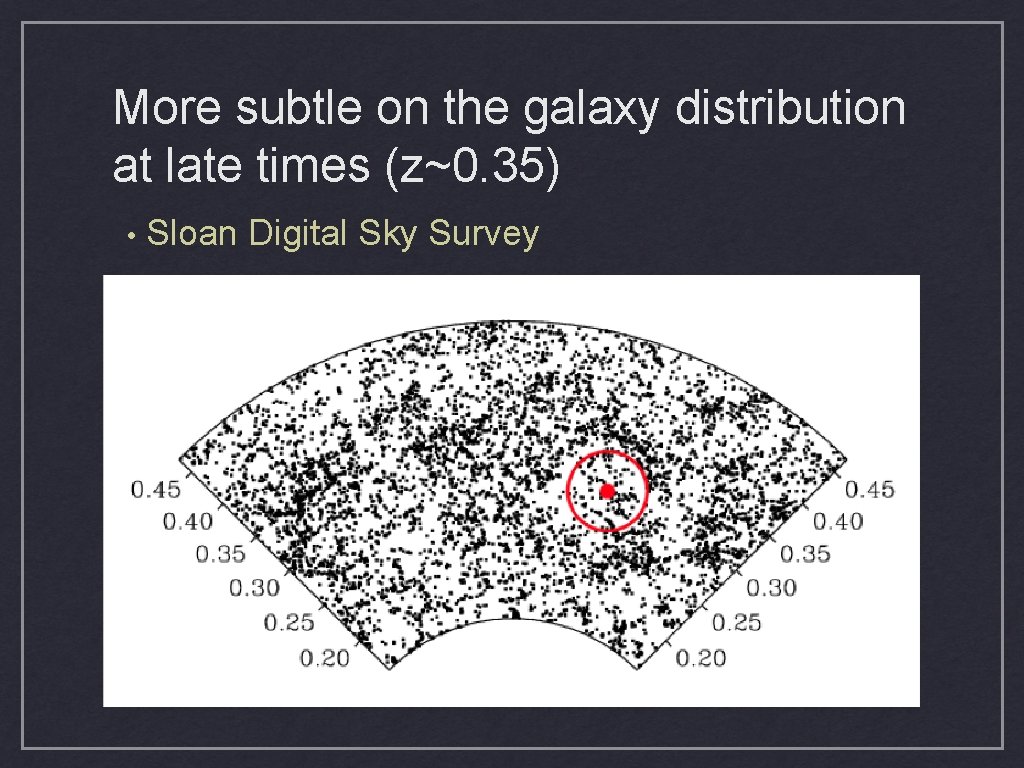
More subtle on the galaxy distribution at late times (z~0. 35) • Sloan Digital Sky Survey
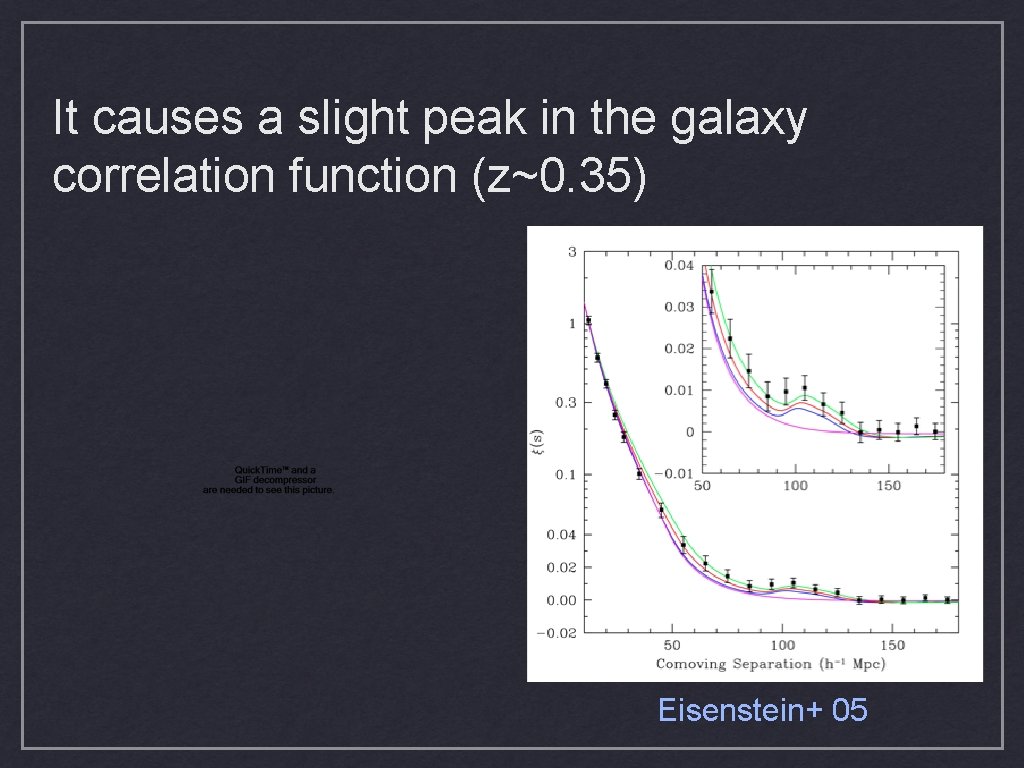
It causes a slight peak in the galaxy correlation function (z~0. 35) Eisenstein+ 05
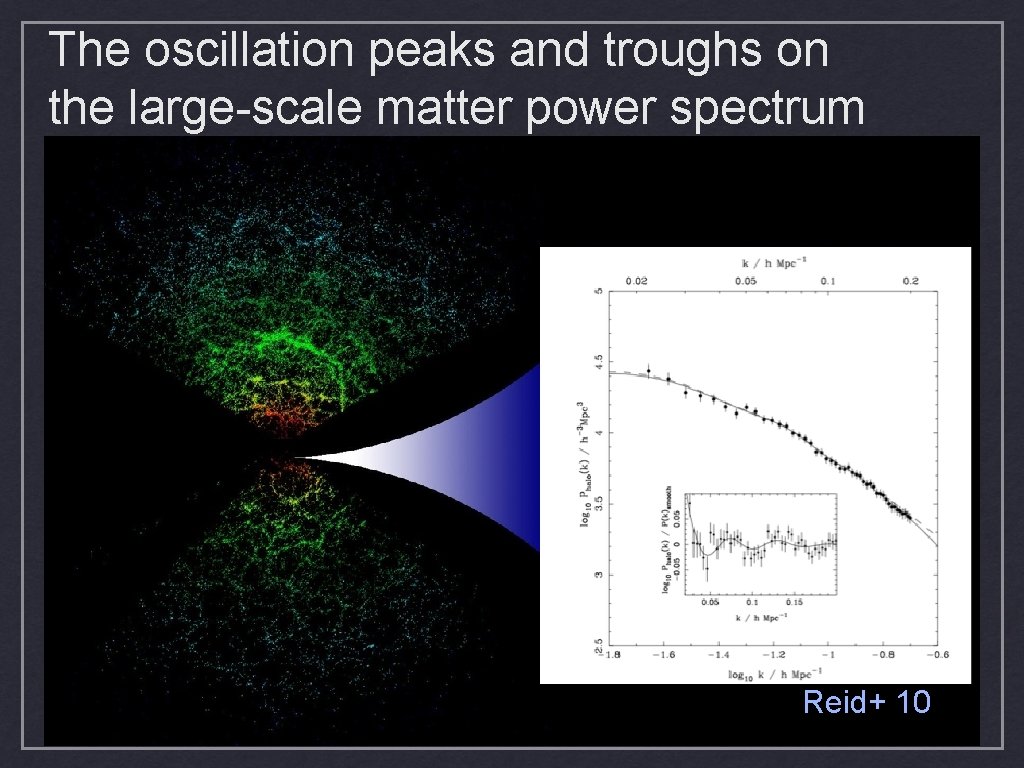
The oscillation peaks and troughs on the large-scale matter power spectrum Reid+ 10
Why is Baryon Acoustic Oscillation (BAO) interesting? It is a direct demonstration of the gravitational instability paradigm: a feature we see in the CMB 380, 000 years after the Big Bang is also seen in an evolved state in the presentday Universe, 13. 6 Gyrs after. • The scale of the feature is fixed: it is determined by the scale of the sound horizon at recombination, therefore by the physics in the early Universe. It is a “standard ruler”, and thus is a direct constraint on the geometry of the Universe. • We probe dark energy via its evolution on the expansion rate of the Universe. BAO and CMB, both standard rules, provide an excellent measurement of dark energy properties. •
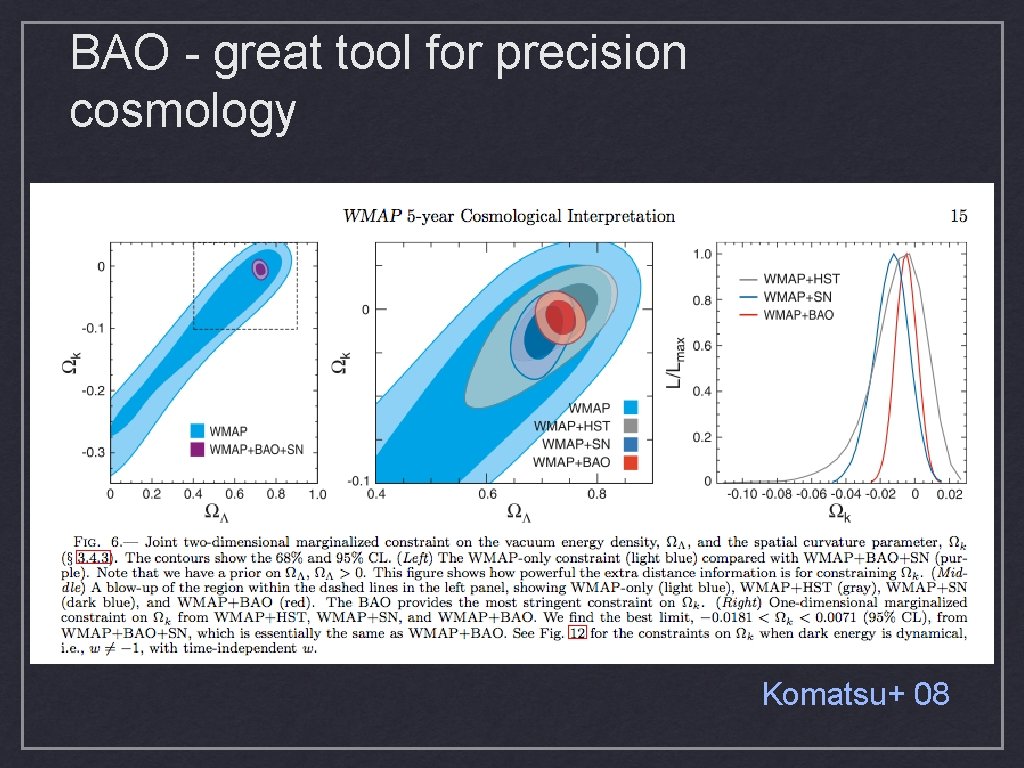
BAO - great tool for precision cosmology Komatsu+ 08
BAO Measurements • BAO feature is present in the distribution of large-scale structure • Can be quantified by imprints on the largescale matter power spectrum • Galaxies are tracers of large-scale structure; traditionally, we need to measure the 3 D position of millions of galaxies in a redshift survey (e. g. SDSS) • Here we propose an alternative: 21 -cm
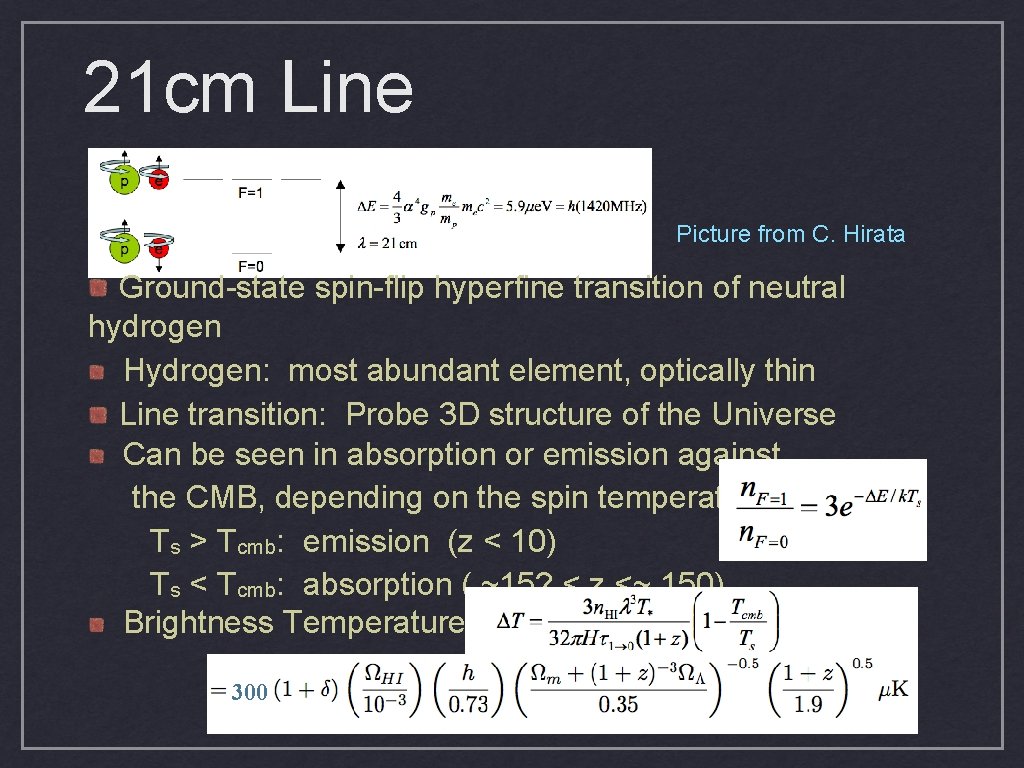
21 cm Line Picture from C. Hirata Ground-state spin-flip hyperfine transition of neutral hydrogen Hydrogen: most abundant element, optically thin Line transition: Probe 3 D structure of the Universe Can be seen in absorption or emission against the CMB, depending on the spin temperature: Ts > Tcmb: emission (z < 10) Ts < Tcmb: absorption ( ~15? < z <~ 150) Brightness Temperature: 300
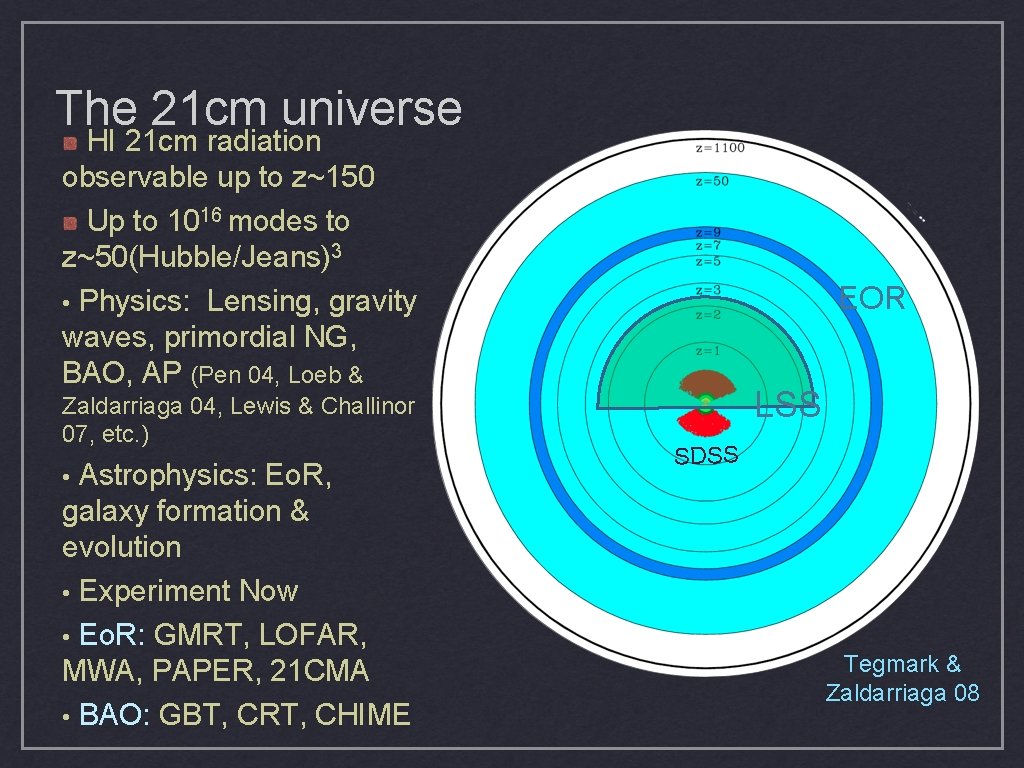
The 21 cm universe HI 21 cm radiation observable up to z~150 Up to 1016 modes to z~50(Hubble/Jeans)3 • Physics: Lensing, gravity waves, primordial NG, BAO, AP (Pen 04, Loeb & Zaldarriaga 04, Lewis & Challinor 07, etc. ) Astrophysics: Eo. R, galaxy formation & evolution • Experiment Now • Eo. R: GMRT, LOFAR, MWA, PAPER, 21 CMA • BAO: GBT, CRT, CHIME • EOR LSS SDSS Tegmark & Zaldarriaga 08
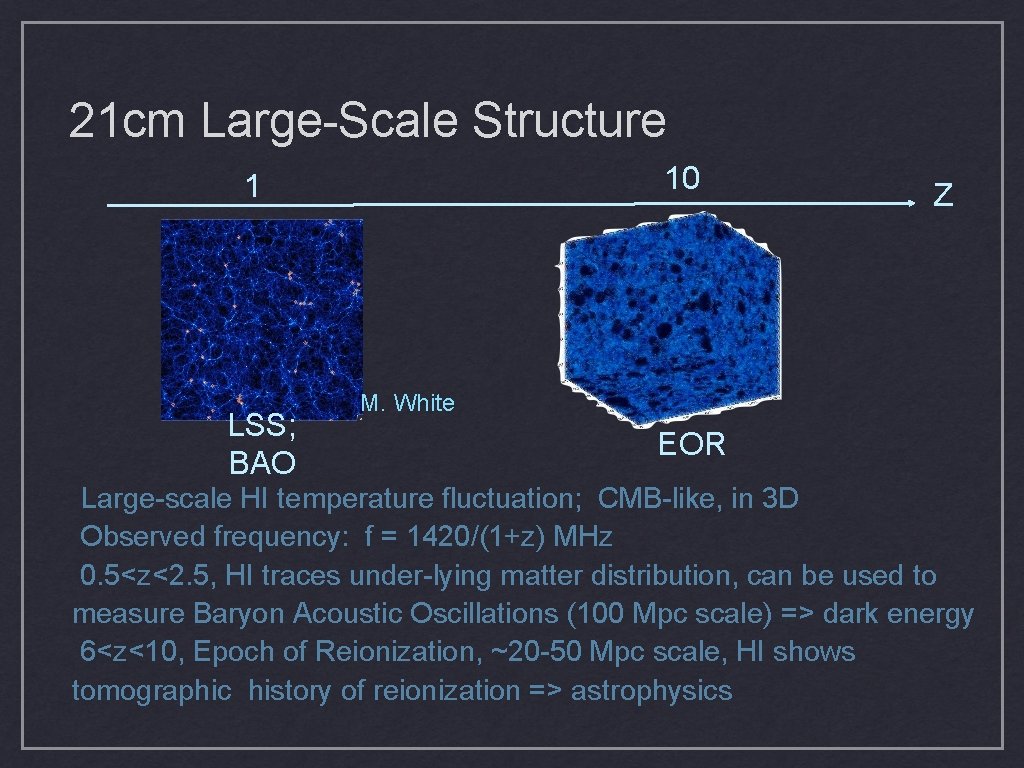
21 cm Large-Scale Structure 10 1 LSS; BAO Z M. White EOR Large-scale HI temperature fluctuation; CMB-like, in 3 D Observed frequency: f = 1420/(1+z) MHz 0. 5<z<2. 5, HI traces under-lying matter distribution, can be used to measure Baryon Acoustic Oscillations (100 Mpc scale) => dark energy 6<z<10, Epoch of Reionization, ~20 -50 Mpc scale, HI shows tomographic history of reionization => astrophysics
21 cm emission on galaxy scales Due to small emissivity, HI in emission is difficult to detect. Previously, HI direct detection at z~0. 2 (Verheijen et al 2007), stacking at z~0. 3 (Lah et al. 2007); both on galaxy scales.
21 cm Intensity Mapping “Intensity Mapping” (Chang et al 2008, Wyithe & Loeb 2008): instead of HI associated with galaxies, interested in HI associated with large-scale structure => measure the collective HI emission from a large region, more massive and luminous, without spatially resolving down to galaxy scales. Measurement of spatially diffused spectral line, in the confusion-limited regime Brightness temperature fluctuations on the sky: just like CMB temperature field, but in 3 D Low angular resolution redshift survey: economical
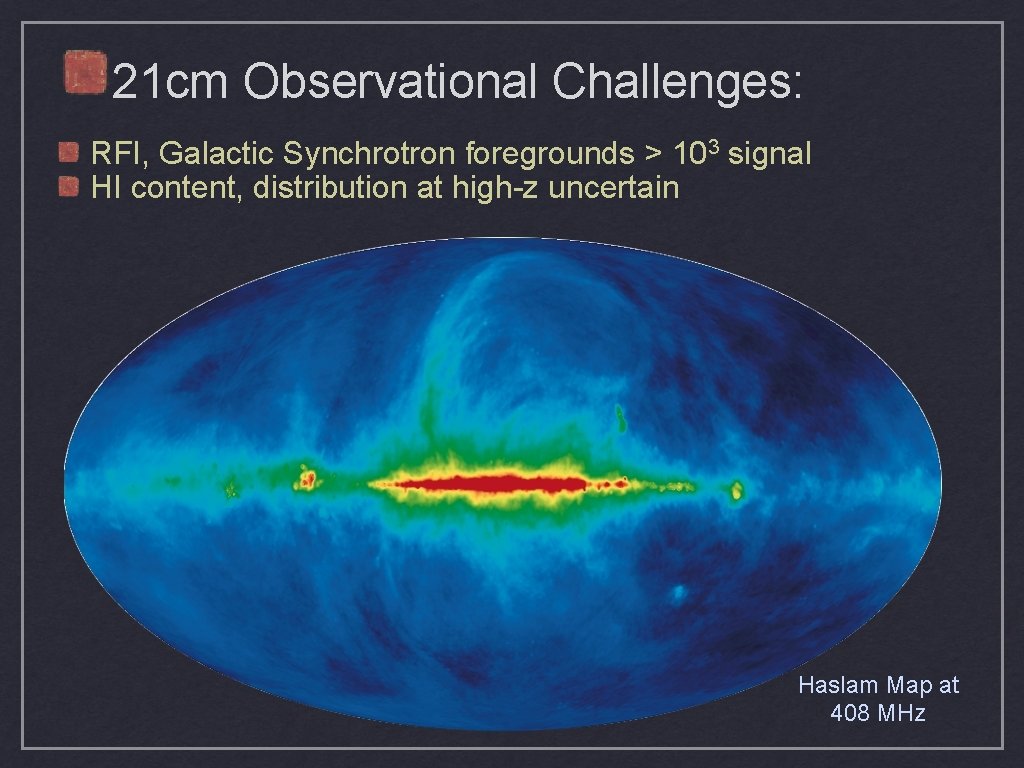
21 cm Observational Challenges: RFI, Galactic Synchrotron foregrounds > 103 signal HI content, distribution at high-z uncertain Haslam Map at 408 MHz
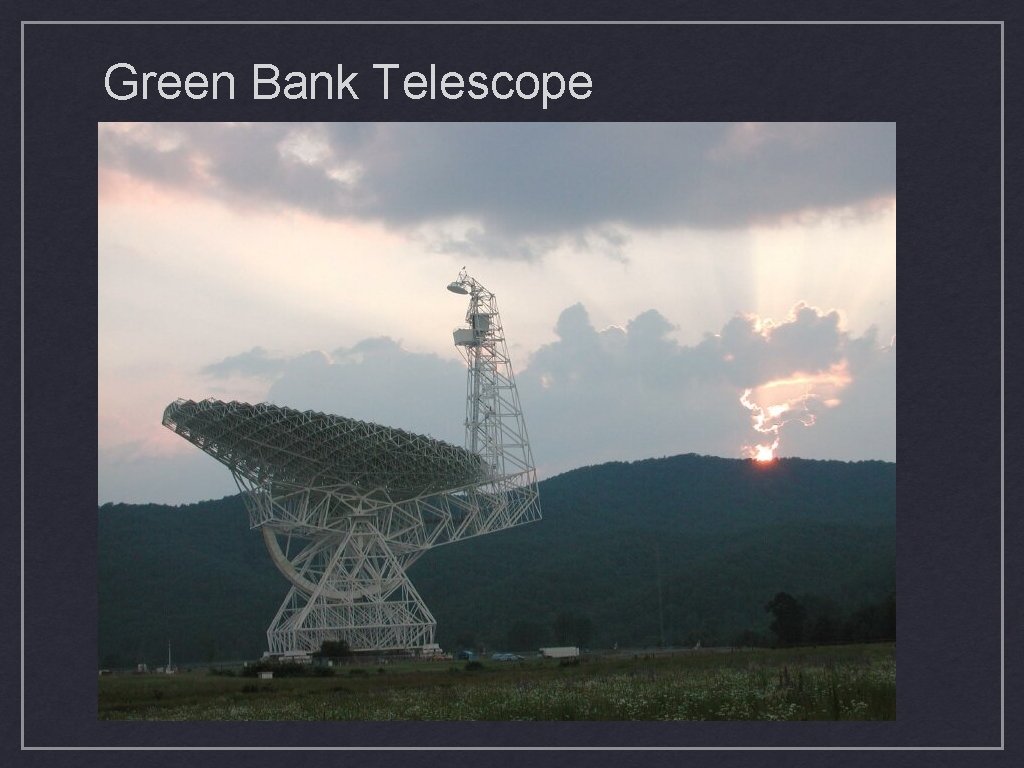
Green Bank Telescope
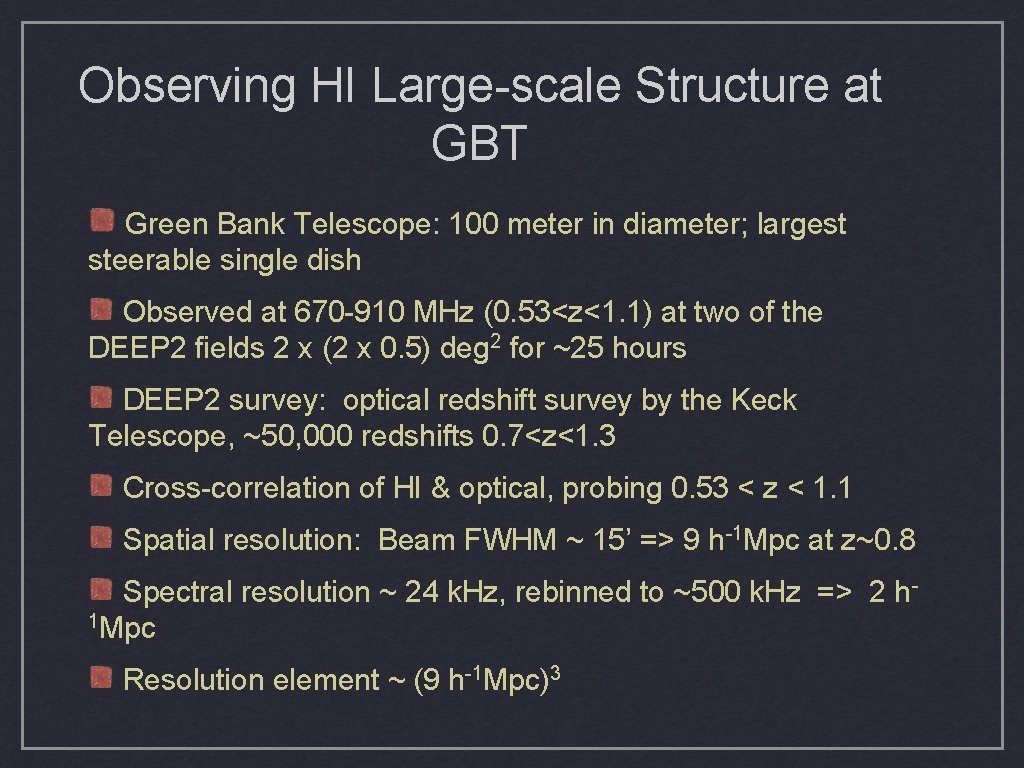
Observing HI Large-scale Structure at GBT Green Bank Telescope: 100 meter in diameter; largest steerable single dish Observed at 670 -910 MHz (0. 53<z<1. 1) at two of the DEEP 2 fields 2 x (2 x 0. 5) deg 2 for ~25 hours DEEP 2 survey: optical redshift survey by the Keck Telescope, ~50, 000 redshifts 0. 7<z<1. 3 Cross-correlation of HI & optical, probing 0. 53 < z < 1. 1 Spatial resolution: Beam FWHM ~ 15’ => 9 h-1 Mpc at z~0. 8 Spectral resolution ~ 24 k. Hz, rebinned to ~500 k. Hz => 2 h 1 Mpc Resolution element ~ (9 h-1 Mpc)3
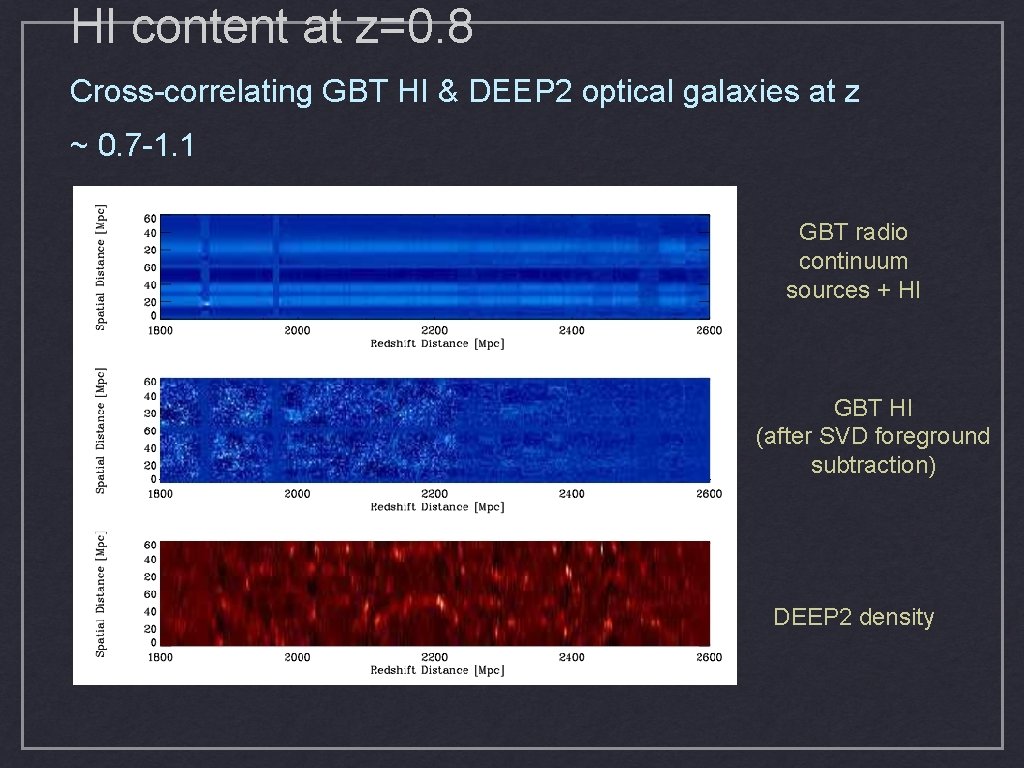
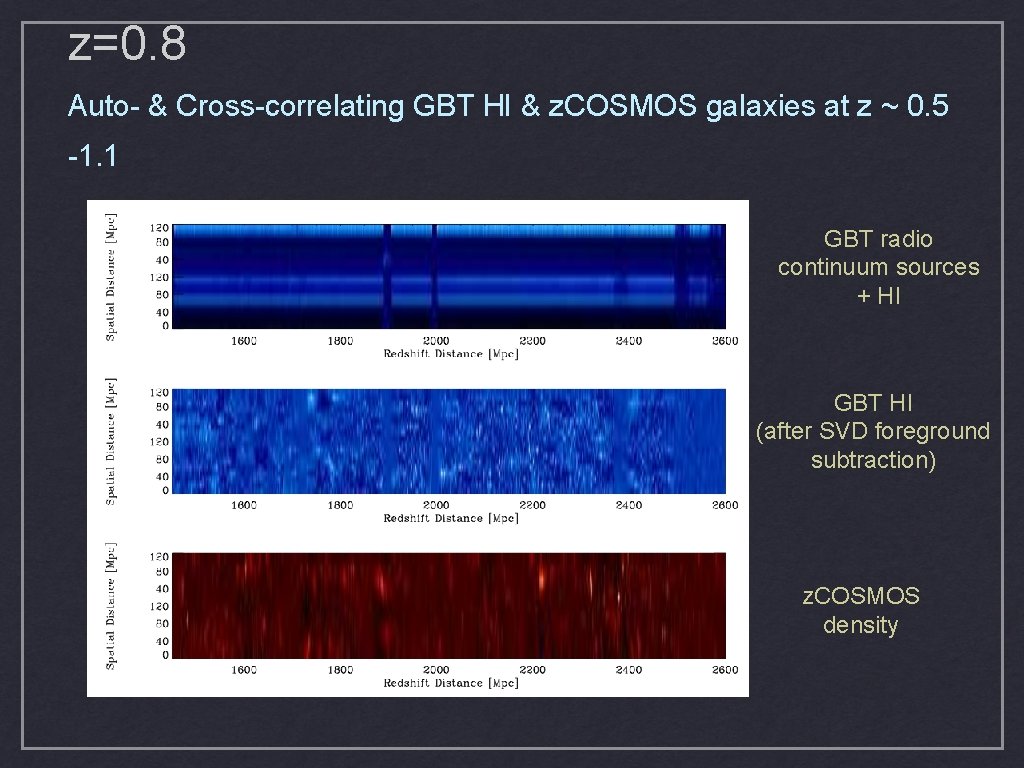
HI content at z=0. 8 Cross-correlating GBT HI & DEEP 2 optical galaxies at z ~ 0. 7 -1. 1 GBT radio continuum sources + HI GBT HI (after SVD foreground subtraction) DEEP 2 density
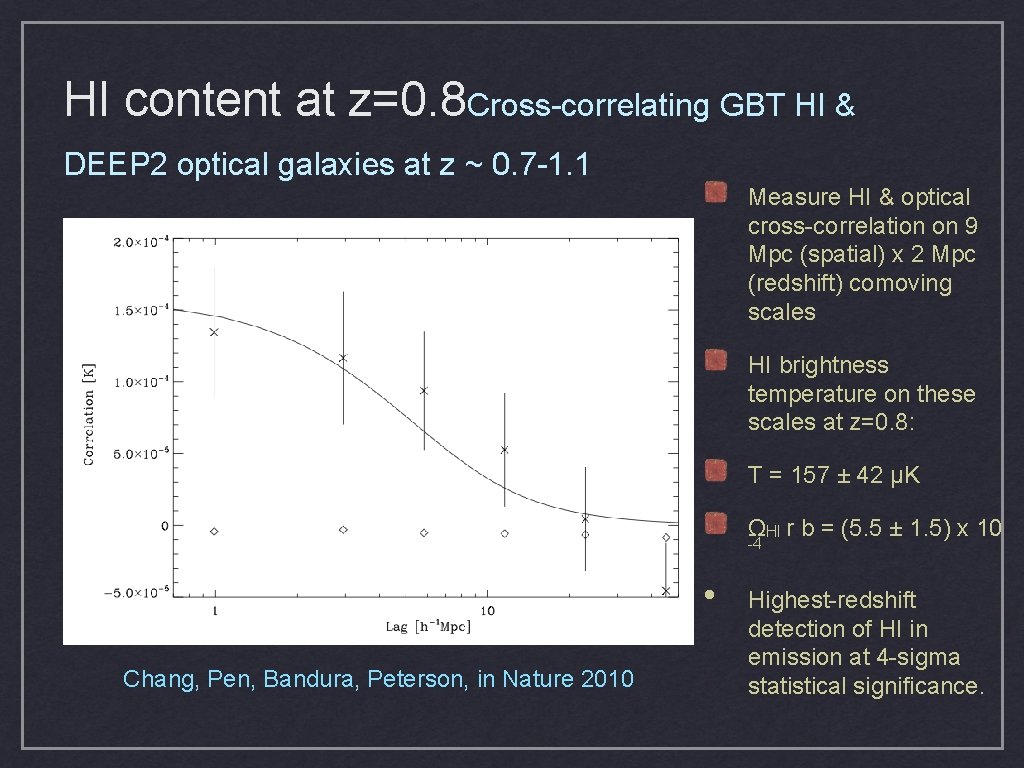
HI content at z=0. 8 Cross-correlating GBT HI & DEEP 2 optical galaxies at z ~ 0. 7 -1. 1 Measure HI & optical cross-correlation on 9 Mpc (spatial) x 2 Mpc (redshift) comoving scales HI brightness temperature on these scales at z=0. 8: T = 157 ± 42 μK ΩHI r b = (5. 5 ± 1. 5) x 10 -4 • Chang, Pen, Bandura, Peterson, in Nature 2010 Highest-redshift detection of HI in emission at 4 -sigma statistical significance.
z=0. 8 Auto- & Cross-correlating GBT HI & z. COSMOS galaxies at z ~ 0. 5 -1. 1 GBT radio continuum sources + HI GBT HI (after SVD foreground subtraction) z. COSMOS density
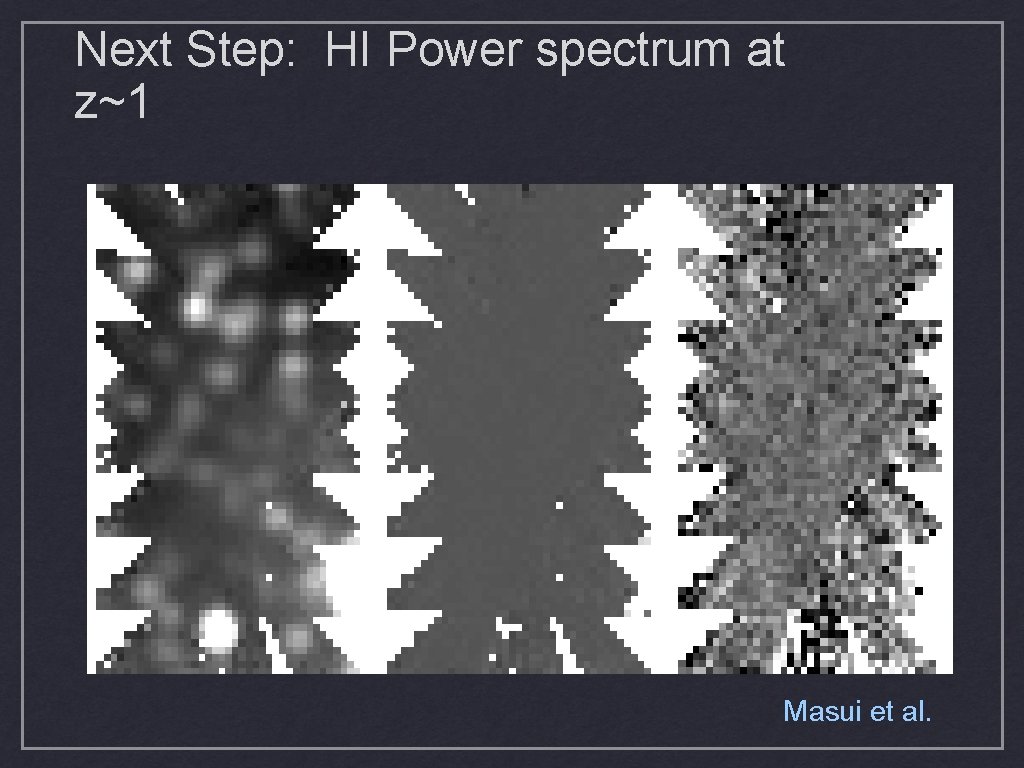
Next Step: HI Power spectrum at z~1 Masui et al.
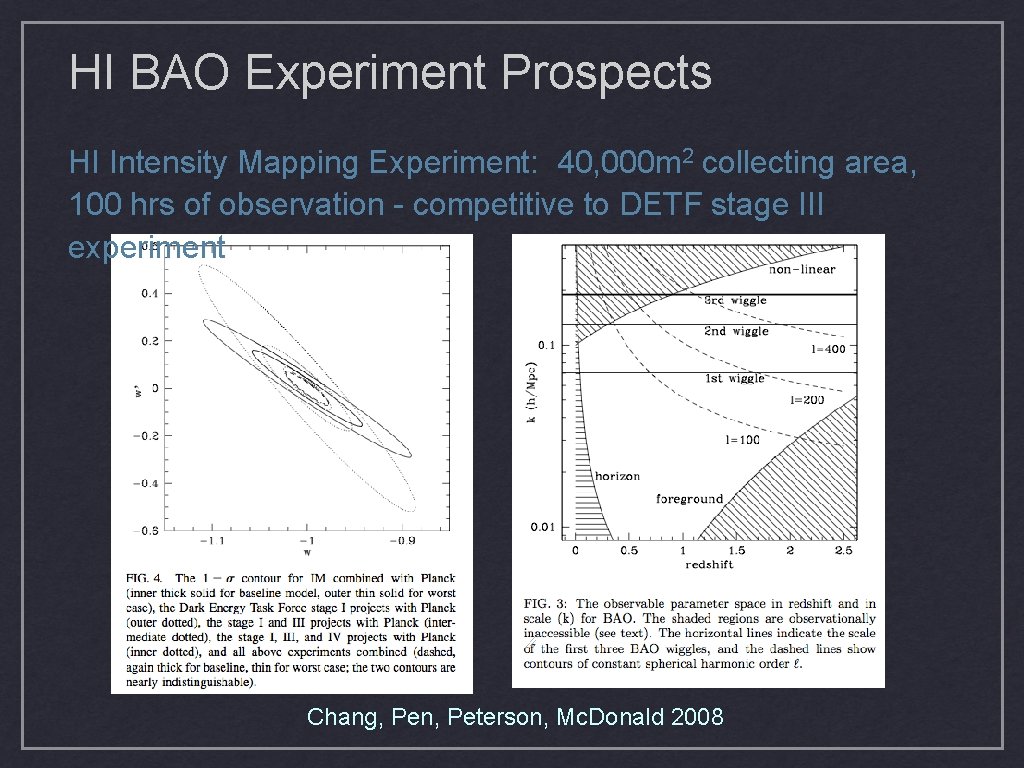
HI BAO Experiment Prospects HI Intensity Mapping Experiment: 40, 000 m 2 collecting area, 100 hrs of observation - competitive to DETF stage III experiment Chang, Pen, Peterson, Mc. Donald 2008
21 cm at z~1: current status HI cross-correlation (with DEEP 2 optical galaxies): measured at z~0. 8: abundant HI at z~1; HI traces largescale structure HI auto-correlation at z~0. 8: GBT on z. COSMOS field HI large-scale structure redshift-space distortion: 50 deg, 300 hrs at GBT, observation and data analysis in progress (caution: foreground, calibration issues. . ) Looking to build a survey instrument for Baryon Acoustic Oscillation measurement (e. g. , Chang et al. 08, Wyithe & Loeb 08, Seo et al. 10): large collecting area, compact configuration, wide-field survey (~104 m 2) covering 0. 5<z<2. 5 (400 -900 MHz, df~0. 5 MHz), resolution ~10’ (10 comoving Mpc)
Conclusion • BAO is a powerful tool for precision measurement of dark energy properties • 21 -cm line is a promising large-scale structure tracer at low redshifts, yielding BAO measurements • 21 -cm would be a good probe of the observable universe.