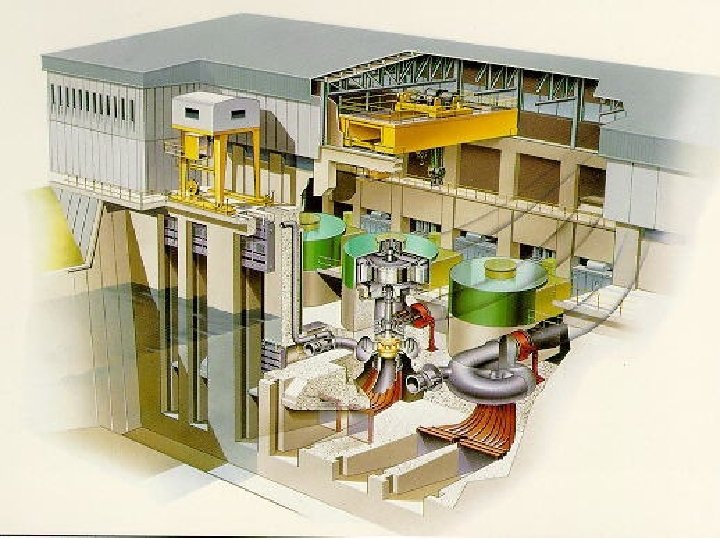
Hydro power plants Hydro power plants Inlet gate


![Materials Material Steel, St. 37 Max. Stresses [MPa] 150 Steel, St. 42 190 Steel,](https://slidetodoc.com/presentation_image_h2/c122ddfc87152c625b54ccd55b369fad/image-30.jpg "Materials Material Steel, St. 37 Max. Stresses [MPa] 150 Steel, St. 42 190 Steel,")


 Water hammer, Dhwh Deflection between")

![Example Jowkowsky a = 1000 [m/s] cmax = 10 [m/s] g = 9, 81](https://slidetodoc.com/presentation_image_h2/c122ddfc87152c625b54ccd55b369fad/image-42.jpg "Example Jowkowsky a = 1000 [m/s] cmax = 10 [m/s] g = 9, 81")

![Example L TC cmax g = = 300 10 10 9, 81 [m] [s]](https://slidetodoc.com/presentation_image_h2/c122ddfc87152c625b54ccd55b369fad/image-44.jpg "Example L TC cmax g = = 300 10 10 9, 81 [m] [s]")


![Cost [$] Calculation of the economical correct diameter of the pipe s, K t](https://slidetodoc.com/presentation_image_h2/c122ddfc87152c625b54ccd55b369fad/image-47.jpg "Cost [$] Calculation of the economical correct diameter of the pipe s, K t")


 • Relatively small")


 •")
- Slides: 73
Hydro power plants
Hydro power plants Inlet gate Air inlet Surge shaft Penstock Tunnel Sand trap Trash rack Self closing valve Tail water Main valve Turbine Draft tube gate
The principle the water conduits of a traditional high head power plant
Ulla- Førre Original figur ved Statkraft Vestlandsverkene
Arrangement of a small hydropower plant
Ligga Power Plant, Norrbotten, Sweden H = 39 m Q = 513 m 3/s P = 182 MW Drunner=7, 5 m
Borcha Power Plant, Turkey H = 87, 5 m P = 150 MW Drunner=5, 5 m
Water intake • • Dam Coarse trash rack Intake gate Sediment settling basement
Dams • Rockfill dams • Pilar og platedammer • Hvelvdammer
Rock-fill dams 1. 2. 3. 4. Core Filter zone Transition zone Supporting shell Moraine, crushed soft rock, concrete, asphalt Sandy gravel Fine blasted rock Blasted rock
Slab concrete dam
Arc dam
Gates in Hydro Power Plants
Types of Gates • Radial Gates • Wheel Gates • Slide Gates • Flap Gates • Rubber Gates
Radial Gates at Älvkarleby, Sweden
Radial Gate The forces acting on the arc will be transferred to the bearing
Slide Gate Jhimruk Power Plant, Nepal
Flap Gate
Rubber gate Flow disturbance Reinforced rubber Open position Reinforced rubber Closed position Bracket Air inlet
Circular gate End cover Ribs Hinge Manhole Pipe Ladder Bolt Fastening element Seal Frame
Circular gate Jhimruk Power Plant, Nepal
Trash Racks Panauti Power Plant, Nepal
Theun Hinboun Power Plant Laos
Gravfoss Power Plant Norway Trash Rack size: Width: 12 meter Height: 13 meter Stainless Steel
Comp. Rack Trash Rack delivered by VA-Tech
Cleaning the trash rack
Pipes • Materials • Calculation of the change of length due to the change of the temperature • Calculation of the head loss • Calculation of maximum pressure – Static pressure – Water hammer • Calculation of the pipe thickness • Calculation of the economical correct diameter • Calculation of the forces acting on the anchors
Materials • Steel • Polyethylene, PE • Glass-fibre reinforced Unsaturated Polyesterplastic , GUP • Wood • Concrete
Materials Material Steel, St. 37 Max. Stresses [MPa] 150 Steel, St. 42 190 Steel, St. 52 206 PE Max. Diameter Max. Pressure [m] ~ 1, 0 160 2, 4 320 Max. p = 160 m. Max. D: 1, 4 m. Wood ~5 80 Concrete ~5 ~ 400 GUP 5
Steel pipes in penstock Nore Power Plant, Norway
GUP-Pipe Raubergfossen Power Plant, Norway
Wood Pipes Breivikbotn Power Plant, Norway Øvre Porsa Power Plant, Norway
Calculation of the change of length due to the change of the temperature Where: DL = a = DT = Change of length [m] Length [m] Coefficient of thermal expansion [m/o. C m] Change of temperature [o. C]
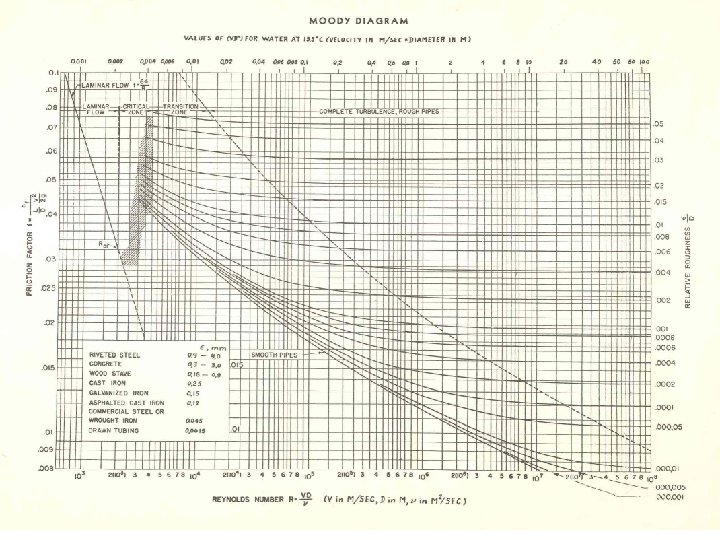
Calculation of the head loss Where: hf = L = D = c = g = Head loss Friction factor Length of pipe Diameter of the pipe Water velocity Gravity [m] [-] [m] [m/s 2]
Example Calculation of the head loss Power Plant data: H = 100 m Head Q = 10 m 3/s Flow Rate L = 1000 m Length of pipe D = 2, 0 m Diameter of the pipe The pipe material is steel Where: c = 3, 2 m/s Water velocity n = 1, 308· 10 -6 m 2/s Kinetic viscosity Re = 4, 9 · 106 Reynolds number
Where: Re = 4, 9 · 106 Reynolds number e = 0, 045 mm Roughness D = 2, 0 m Diameter of the pipe e/D = 2, 25 · 10 -5 Relative roughness f = 0, 013 Friction factor The pipe material is steel 0, 013
Example Calculation of the head loss Power Plant data: H = 100 m Head Q = 10 m 3/s Flow Rate L = 1000 m Length of pipe D = 2, 0 m Diameter of the pipe The pipe material is steel Where: f = 0, 013 c = 3, 2 m/s g = 9, 82 m/s 2 Friction factor Water velocity Gravity
Calculation of maximum pressure Static head, Hgr (Gross Head) Water hammer, Dhwh Deflection between pipe supports Friction in the axial direction Hgr • •
Maximum pressure rise due to the Water Hammer Jowkowsky Dhwh a cmax g = = Pressure rise due to water hammer Speed of sound in the penstock maximum velocity gravity c [m. WC] [m/s] [m/s 2]
Example Jowkowsky a = 1000 [m/s] cmax = 10 [m/s] g = 9, 81 [m/s 2] c=10 m/s
Maximum pressure rise due to the Water Hammer Where: Dhwh a cmax g L TC = = = Pressure rise due to water hammer Speed of sound in the penstock maximum velocity gravity Length Time to close the main valve or guide vanes C L [m. WC] [m/s] [m/s 2] [m] [s]
Example L TC cmax g = = 300 10 10 9, 81 [m] [s] [m/s 2] C=10 L m/s
Calculation of the pipe thickness • Based on: – Material properties – Pressure from: • Water hammer • Static head Where: L = Length of the pipe Di p st t Cs r Hgr Dhwh = Inner diameter of the pipe = Pressure inside the pipe = Stresses in the pipe material = Thickness of the pipe = Coefficient of safety = Density of the water = Gross Head = Pressure rise due to water hammer [m] [Pa] [m] [-] [kg/m 3] [m] st st p ri t
Example Calculation of the pipe thickness • Based on: – Material properties – Pressure from: • Water hammer • Static head st Where: L = 0, 001 m Length of the pipe Di st r Cs Hgr Dhwh = = = Inner diameter of the pipe Stresses in the pipe material Density of the water t Coefficient of safety Gross Head Pressure rise due to water hammer 2, 0 m 206 MPa 1000 kg/m 3 1, 2 100 m 61 m st p ri
Cost [$] Calculation of the economical correct diameter of the pipe s, K t s o tot lc a t To osts Installation c Costs for h ydraulic lo Diameter [m] , Kt sses, K f
Example Calculation of the economical correct diameter of the pipe Hydraulic Losses Power Plant data: H = 100 m Q = 10 m 3/s plant = 85 % L = 1000 m Where: PLoss = r = g = Q = hf = L = r = C 2 = Head Flow Rate Plant efficiency Length of pipe Loss of power due to the head loss Density of the water [kg/m 3] gravity [m/s 2] Flow rate [m 3/s] Head loss [m] Friction factor [-] Length of pipe [m] Radius of the pipe [m] Calculation coefficient [W]
Example Calculation of the economical correct diameter of the pipe Cost of the Hydraulic Losses per year Where: Kf = PLoss = T = k. Whprice = r = C 2 = Cost for the hydraulic losses[€] Loss of power due to the head loss Energy production time [h/year] Energy price [€/k. Wh] Radius of the pipe [m] Calculation coefficient [W]
Example Calculation of the economical correct diameter of the pipe Present value of the Hydraulic Losses per year Where: Kf = T = k. Whprice = r = C 2 = Cost for the hydraulic losses[€] Energy production time [h/year] Energy price [€/k. Wh] Radius of the pipe [m] Calculation coefficient Present value for 20 year of operation: Where: Kf pv n I = Present value of the hydraulic losses = Lifetime, (Number of year ) [-] = Interest rate [-] [€]
Example Calculation of the economical correct diameter of the pipe Cost for the Pipe Material Where: m = rm = V = r = L = p = s = C 1 = Kt = Mass of the pipe Density of the material Volume of material Radius of pipe Length of pipe Pressure in the pipe Maximum stress Calculation coefficient Installation costs Cost for the material [kg] [kg/m 3] [m] [MPa] [€] [€/kg] NB: This is a simplification because no other component then the pipe is calculated
Example Calculation of the economical correct diameter of the pipe • Installation Costs: – Pipes – Maintenance – Interests – Etc.
Example Calculation of the economical correct diameter of the pipe Where: Kf = Kt = T = k. Whprice = r = C 1 = C 2 = M = n = I = Cost for the hydraulic losses Installation costs [€] Energy production time [h/year] Energy price [€/k. Wh] Radius of the pipe [m] Calculation coefficient Cost for the material [€/kg] Lifetime, (Number of year ) [-] Interest rate [-] [€]
Example Calculation of the economical correct diameter of the pipe
Calculation of the forces acting on the anchors
Calculation of the forces acting on the anchors F 5 F 1 F F 2 F 3 F 4 F 1 = Force due to the water pressure [N] F 2 = Force due to the water pressure [N] F 3 = Friction force due to the pillars upstream the anchor F 4 = Friction force due to the expansion joint upstream the anchor F 5 = Friction force due to the expansion joint downstream the anchor [N] [N]
Calculation of the forces acting on the anchors F R G
Valves
Principle drawings of valves Open position Closed position Spherical valve Hollow-jet valve Gate valve Butterfly valve
Spherical valve
Bypass system
Butterfly valve
Butterfly valve
Butterfly valve disk types
Hollow-jet Valve
Pelton turbines • Large heads (from 100 meter to 1800 meter) • Relatively small flow rate • Maximum of 6 nozzles • Good efficiency over a vide range
Jostedal, Norway *Q = 28, 5 m 3/s *H = 1130 m *P = 288 MW Kværner
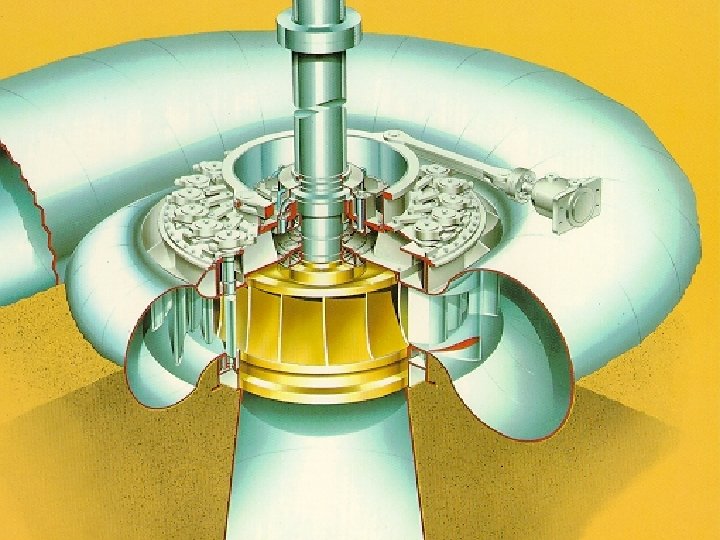
Francis turbines • Heads between 15 and 700 meter • Medium Flow Rates • Good efficiency =0. 96 for modern machines
SVARTISEN P = 350 MW H = 543 m Q* = 71, 5 m 3/S D 0 = 4, 86 m D 1 = 4, 31 m D 2 = 2, 35 m B 0 = 0, 28 m n = 333 rpm
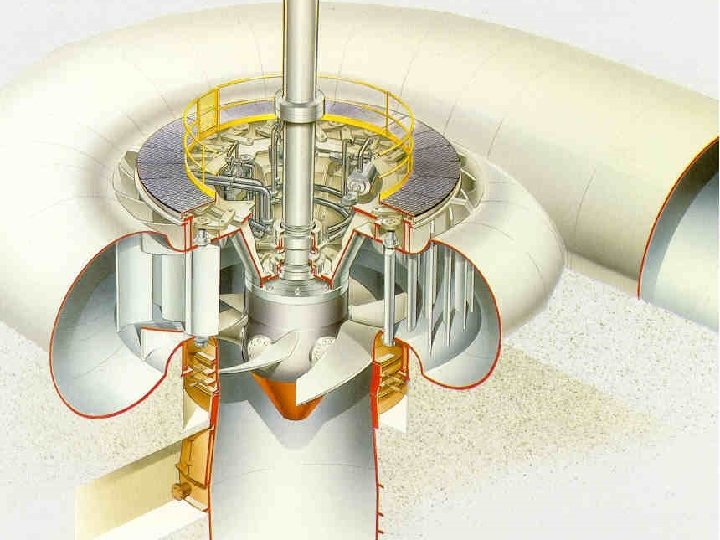
Kaplan turbines • Low head (from 70 meter and down to 5 meter) • Large flow rates • The runner vanes can be governed • Good efficiency over a vide range