
HWC with n QPS Splice Monitoring Zinur Charifoulline
- Slides: 28
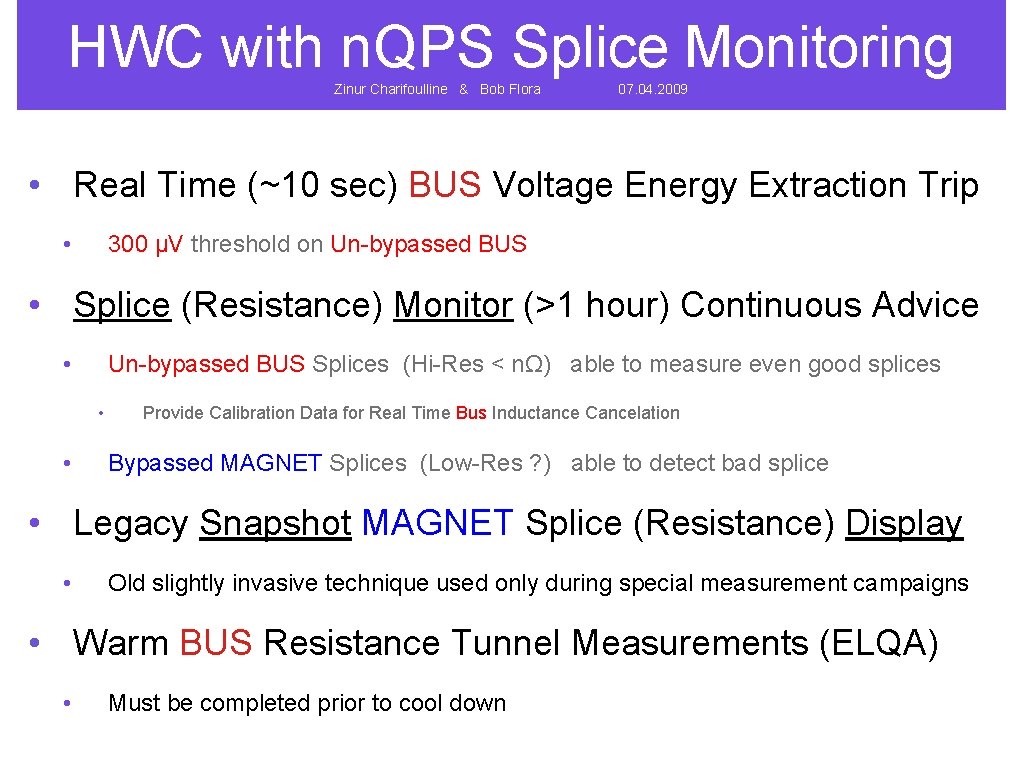
HWC with n. QPS Splice Monitoring Zinur Charifoulline & Bob Flora 07. 04. 2009 • Real Time (~10 sec) BUS Voltage Energy Extraction Trip • 300 µV threshold on Un-bypassed BUS • Splice (Resistance) Monitor (>1 hour) Continuous Advice • Un-bypassed BUS Splices (Hi-Res < nΩ) able to measure even good splices • • Provide Calibration Data for Real Time Bus Inductance Cancelation Bypassed MAGNET Splices (Low-Res ? ) able to detect bad splice • Legacy Snapshot MAGNET Splice (Resistance) Display • Old slightly invasive technique used only during special measurement campaigns • Warm BUS Resistance Tunnel Measurements (ELQA) • Must be completed prior to cool down
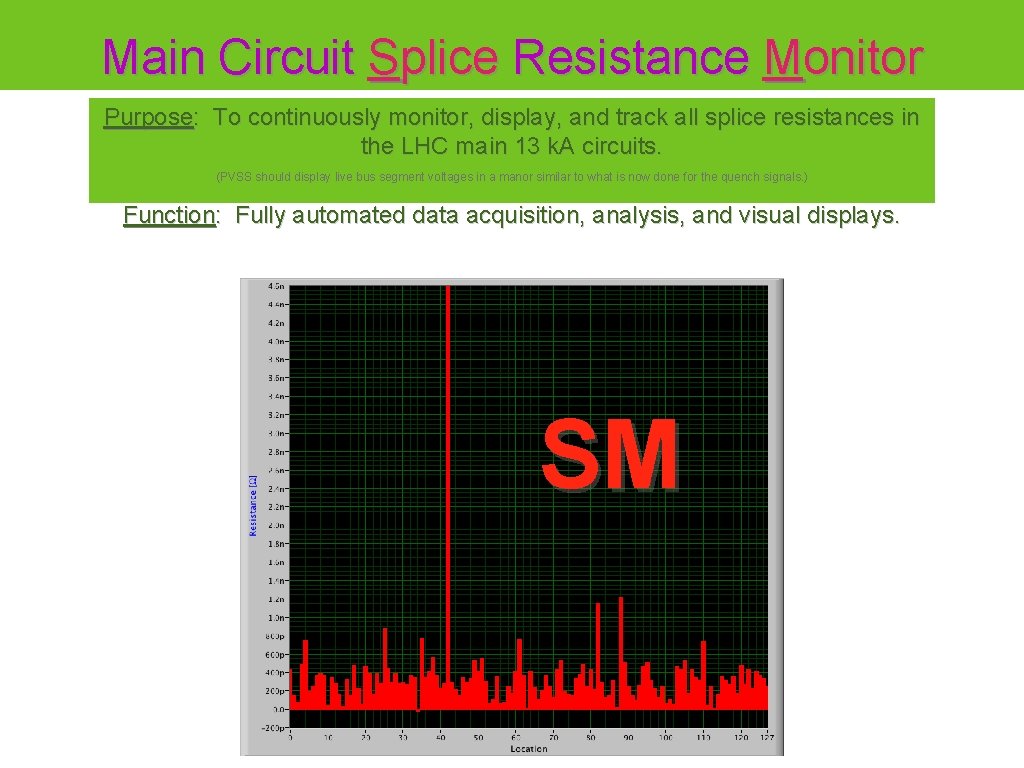
Main Circuit Splice Resistance Monitor Purpose: To continuously monitor, display, and track all splice resistances in the LHC main 13 k. A circuits. (PVSS should display live bus segment voltages in a manor similar to what is now done for the quench signals. ) Function: Fully automated data acquisition, analysis, and visual displays. SM
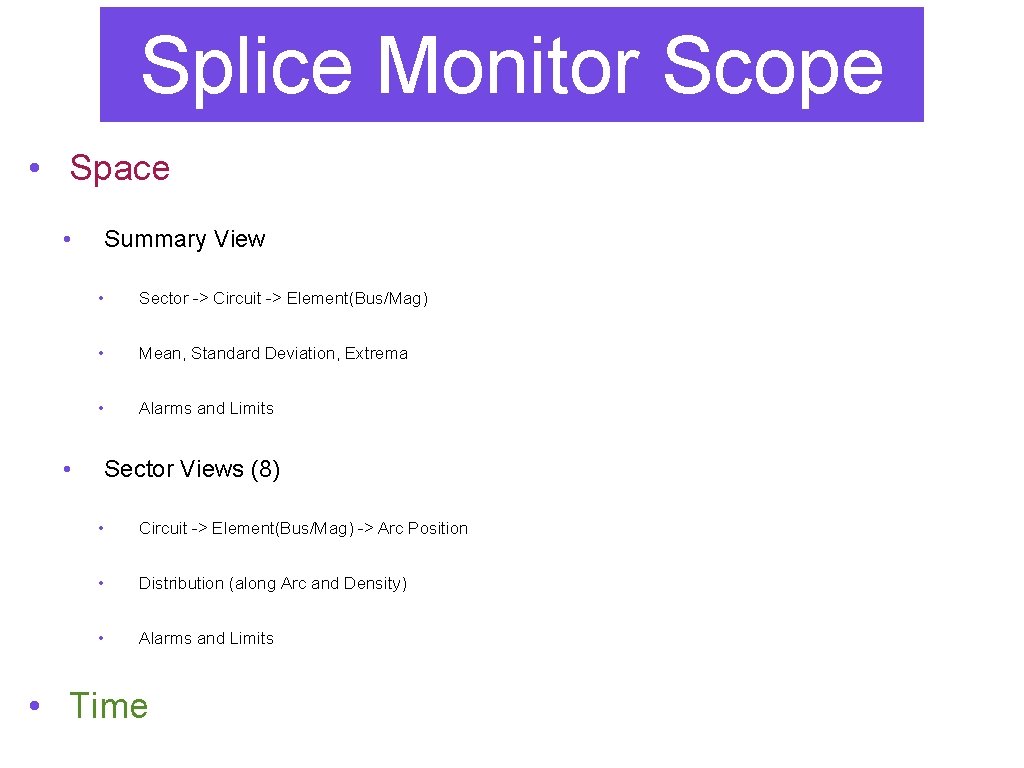
Splice Monitor Scope • Space • Summary View • Sector -> Circuit -> Element(Bus/Mag) • Mean, Standard Deviation, Extrema • Alarms and Limits • Sector Views (8) • Circuit -> Element(Bus/Mag) -> Arc Position • Distribution (along Arc and Density) • Alarms and Limits • Time
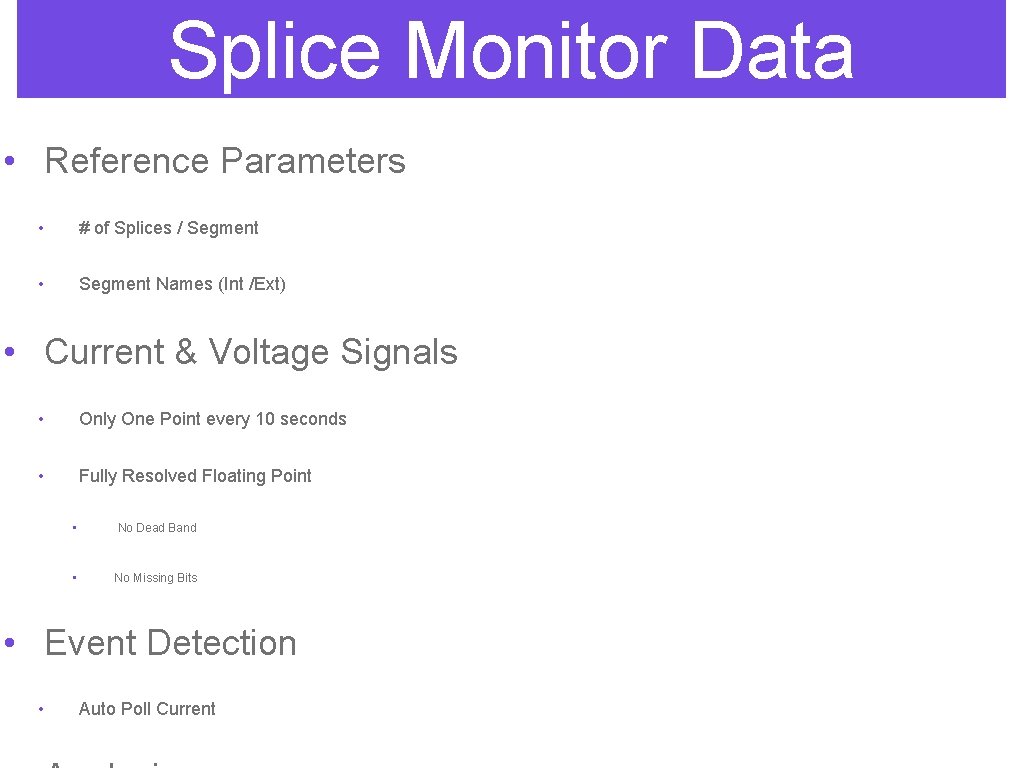
Splice Monitor Data • Reference Parameters • # of Splices / Segment • Segment Names (Int /Ext) • Current & Voltage Signals • Only One Point every 10 seconds • Fully Resolved Floating Point • No Dead Band • No Missing Bits • Event Detection • Auto Poll Current
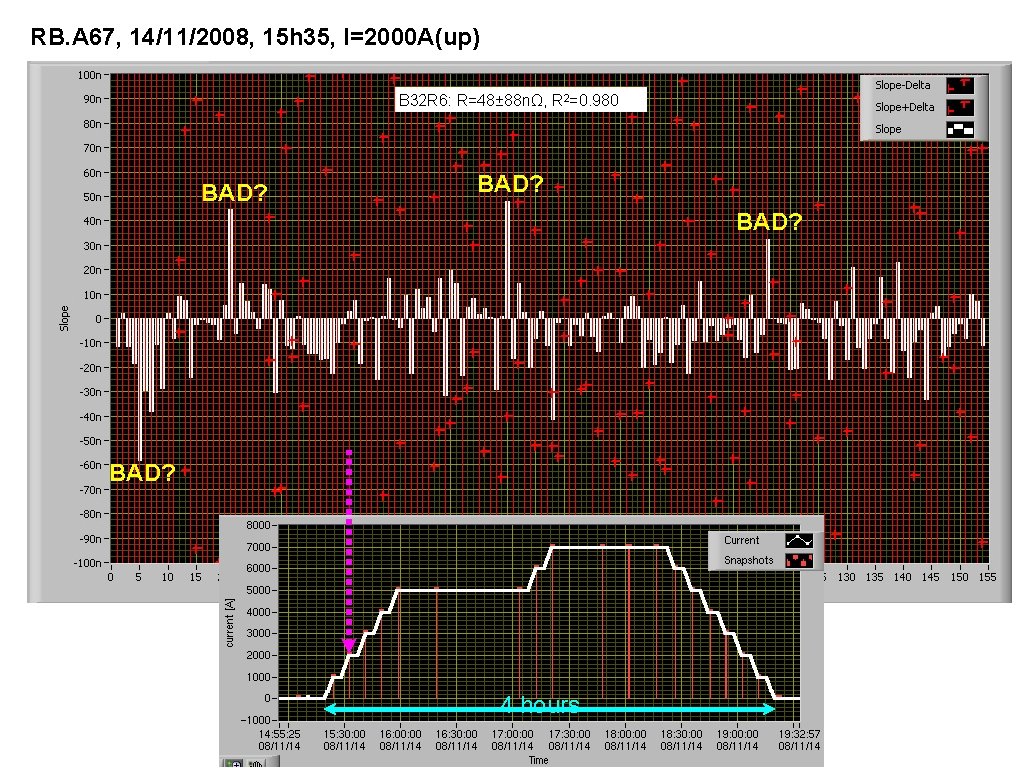
RB. A 67, 14/11/2008, 15 h 35, I=2000 A(up) B 32 R 6: R=48± 88 nΩ, R 2=0. 980 BAD? 4 hours
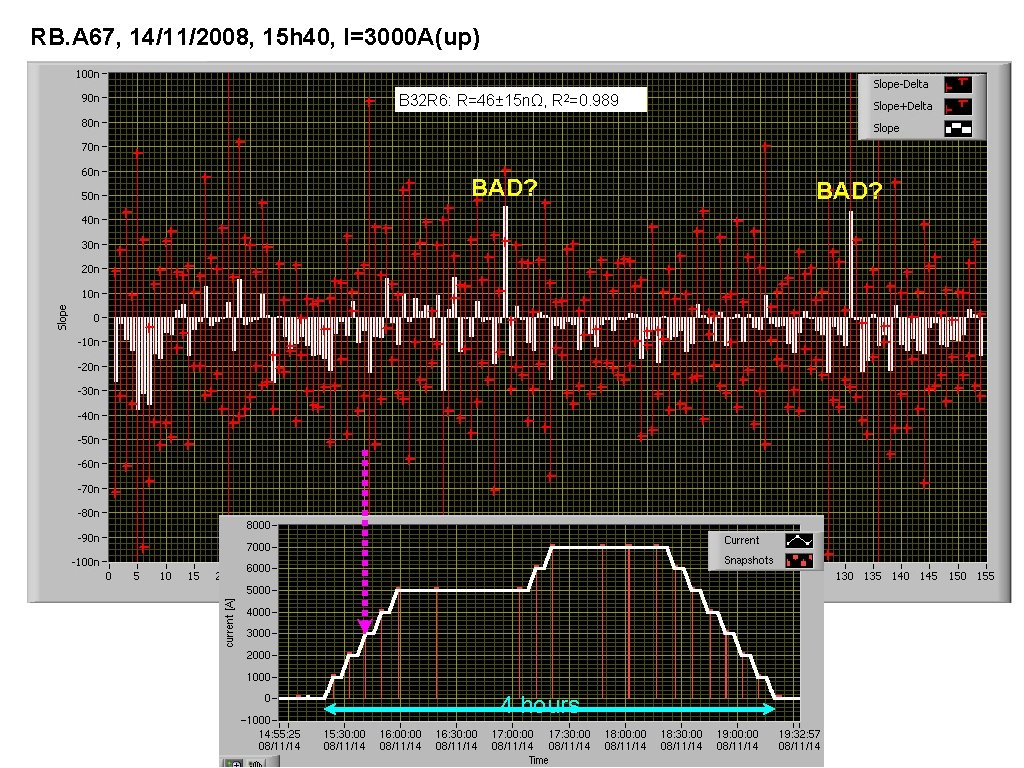
RB. A 67, 14/11/2008, 15 h 40, I=3000 A(up) B 32 R 6: R=46± 15 nΩ, R 2=0. 989 BAD? 4 hours BAD?
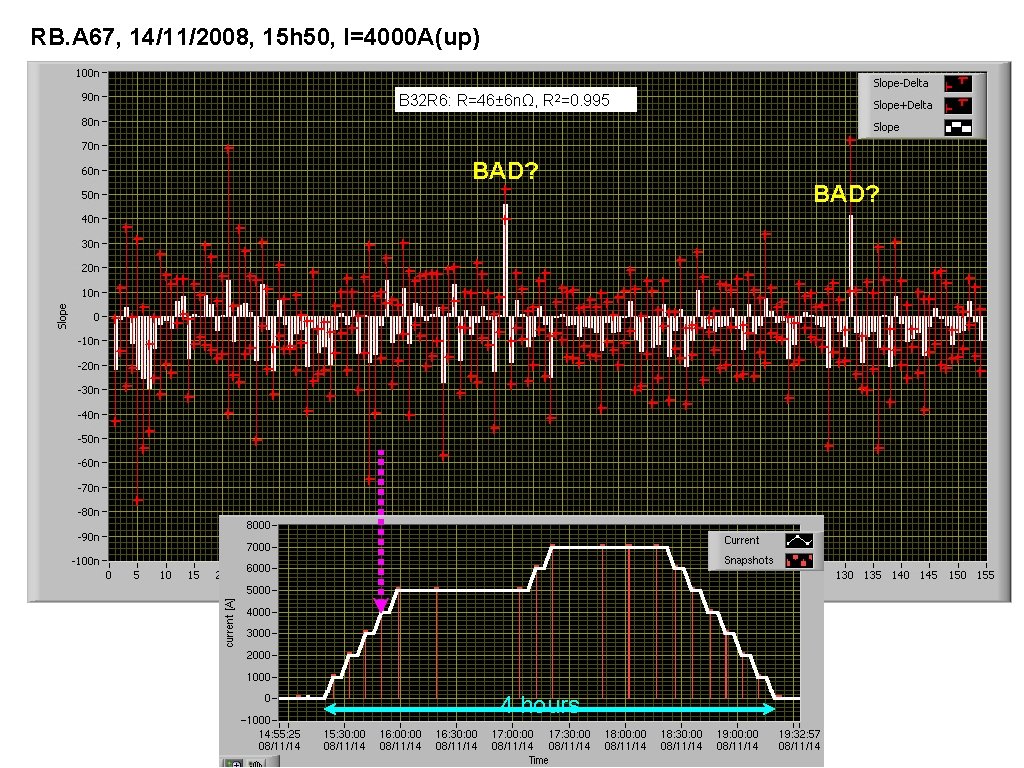
RB. A 67, 14/11/2008, 15 h 50, I=4000 A(up) B 32 R 6: R=46± 6 nΩ, R 2=0. 995 BAD? 4 hours BAD?
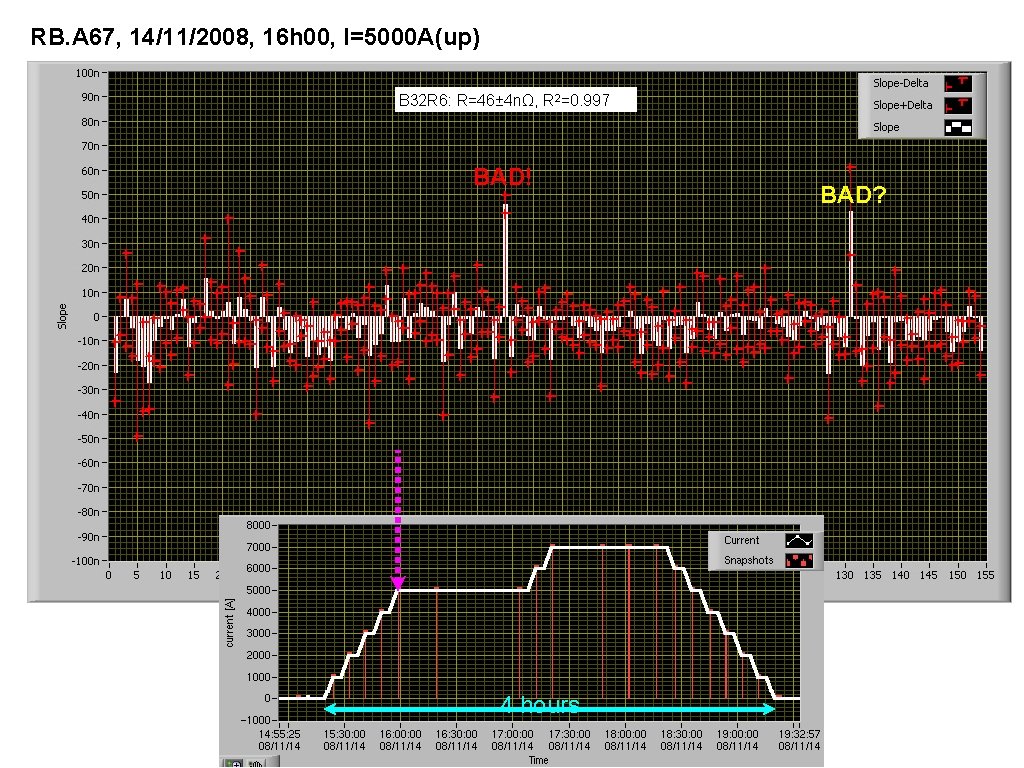
RB. A 67, 14/11/2008, 16 h 00, I=5000 A(up) B 32 R 6: R=46± 4 nΩ, R 2=0. 997 BAD! 4 hours BAD?
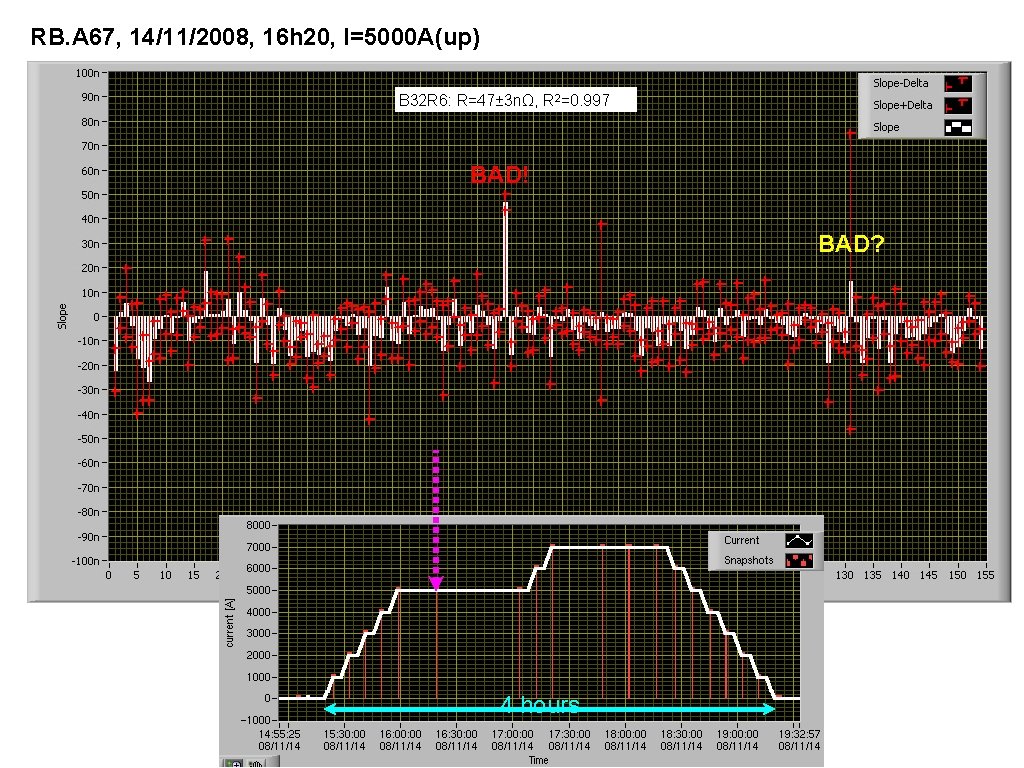
RB. A 67, 14/11/2008, 16 h 20, I=5000 A(up) B 32 R 6: R=47± 3 nΩ, R 2=0. 997 BAD! BAD? 4 hours
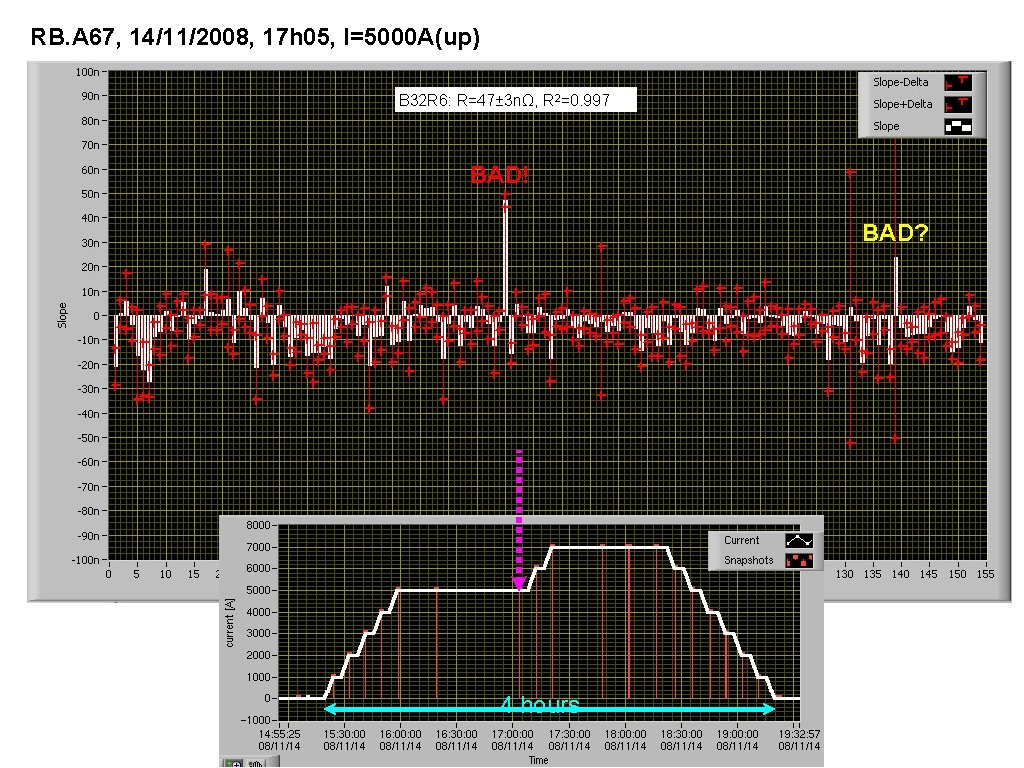
RB. A 67, 14/11/2008, 17 h 05, I=5000 A(up) B 32 R 6: R=47± 3 nΩ, R 2=0. 997 BAD! BAD? 4 hours
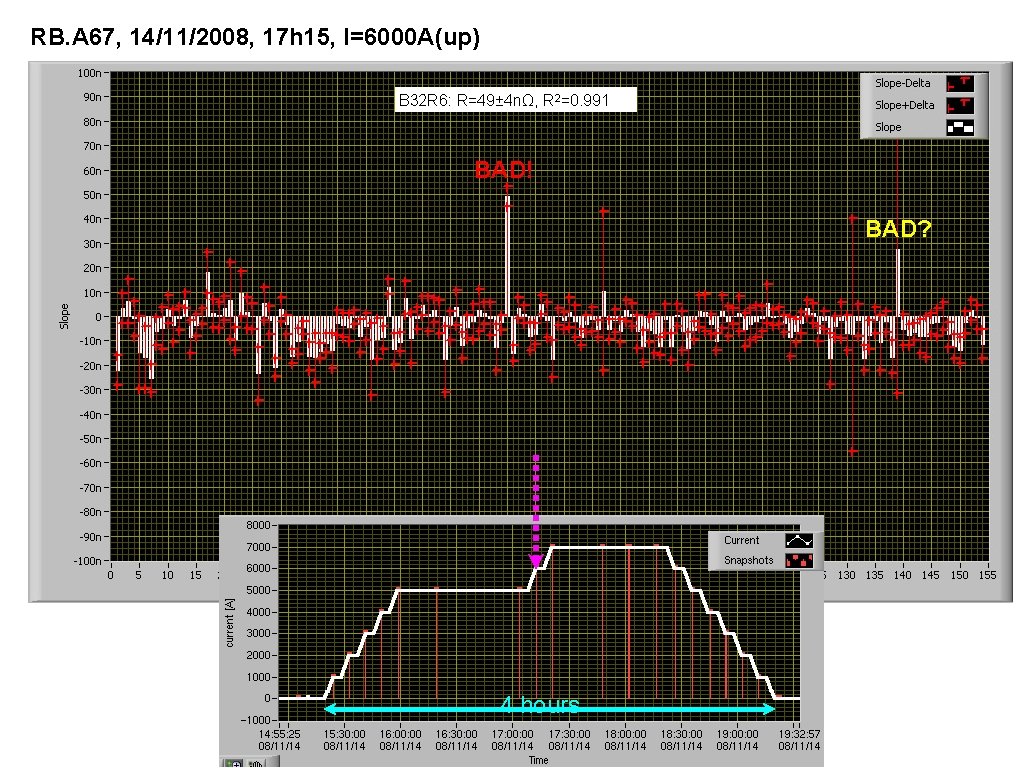
RB. A 67, 14/11/2008, 17 h 15, I=6000 A(up) B 32 R 6: R=49± 4 nΩ, R 2=0. 991 BAD! BAD? 4 hours
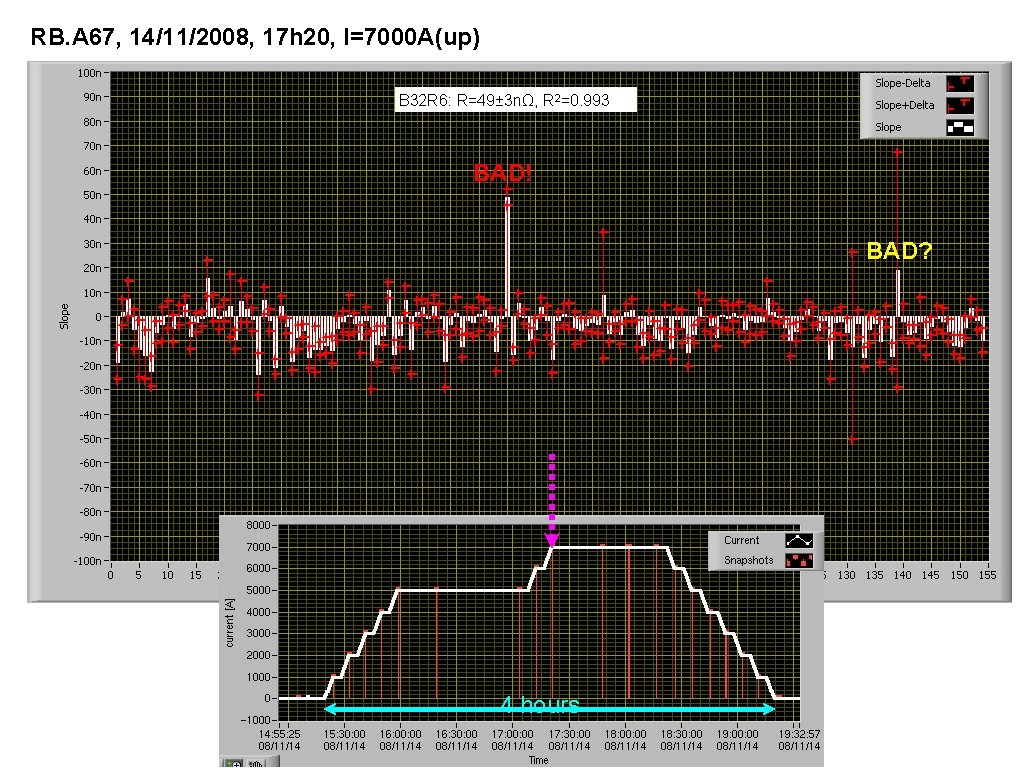
RB. A 67, 14/11/2008, 17 h 20, I=7000 A(up) B 32 R 6: R=49± 3 nΩ, R 2=0. 993 BAD! BAD? 4 hours
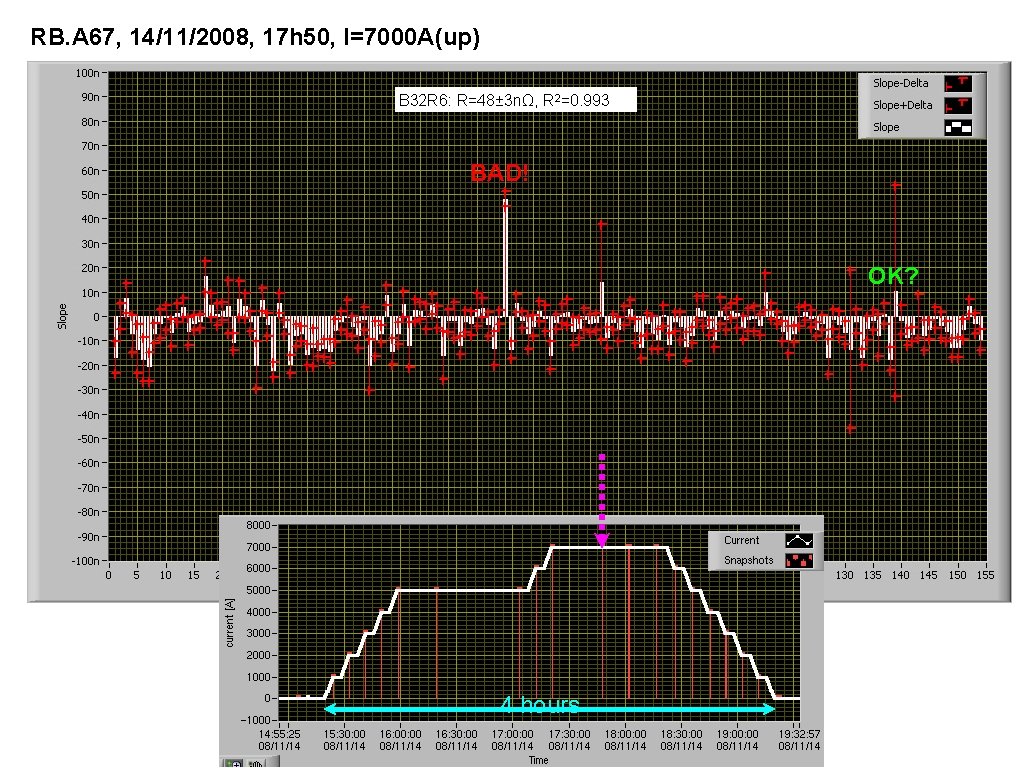
RB. A 67, 14/11/2008, 17 h 50, I=7000 A(up) B 32 R 6: R=48± 3 nΩ, R 2=0. 993 BAD! OK? 4 hours
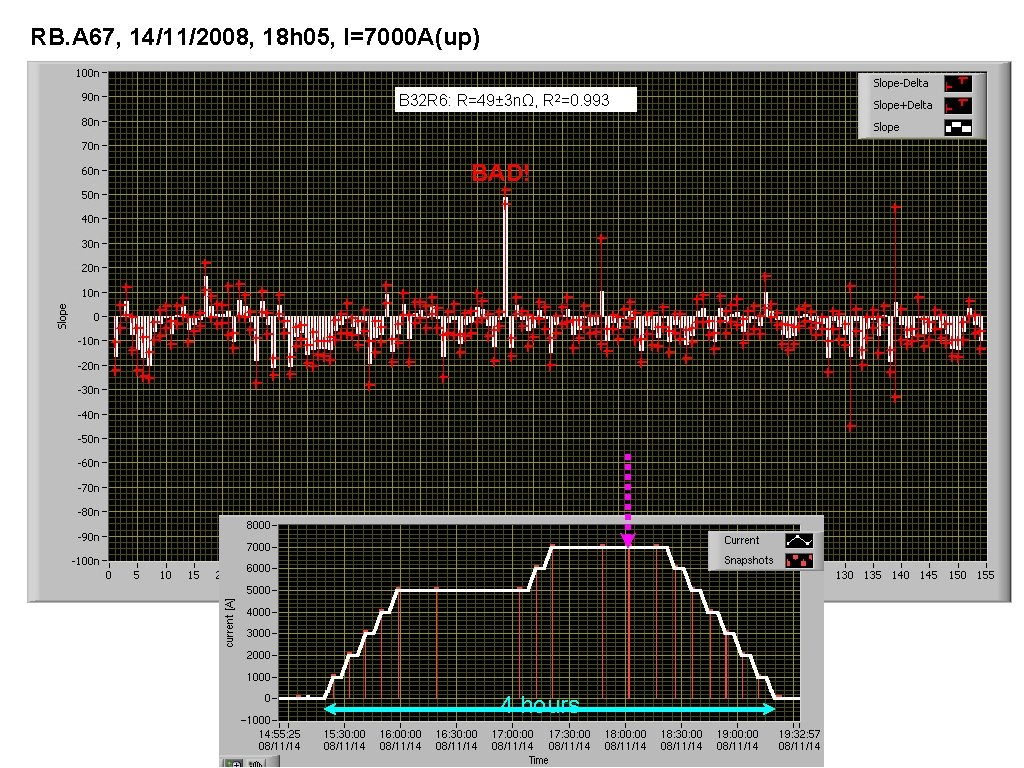
RB. A 67, 14/11/2008, 18 h 05, I=7000 A(up) B 32 R 6: R=49± 3 nΩ, R 2=0. 993 BAD! 4 hours
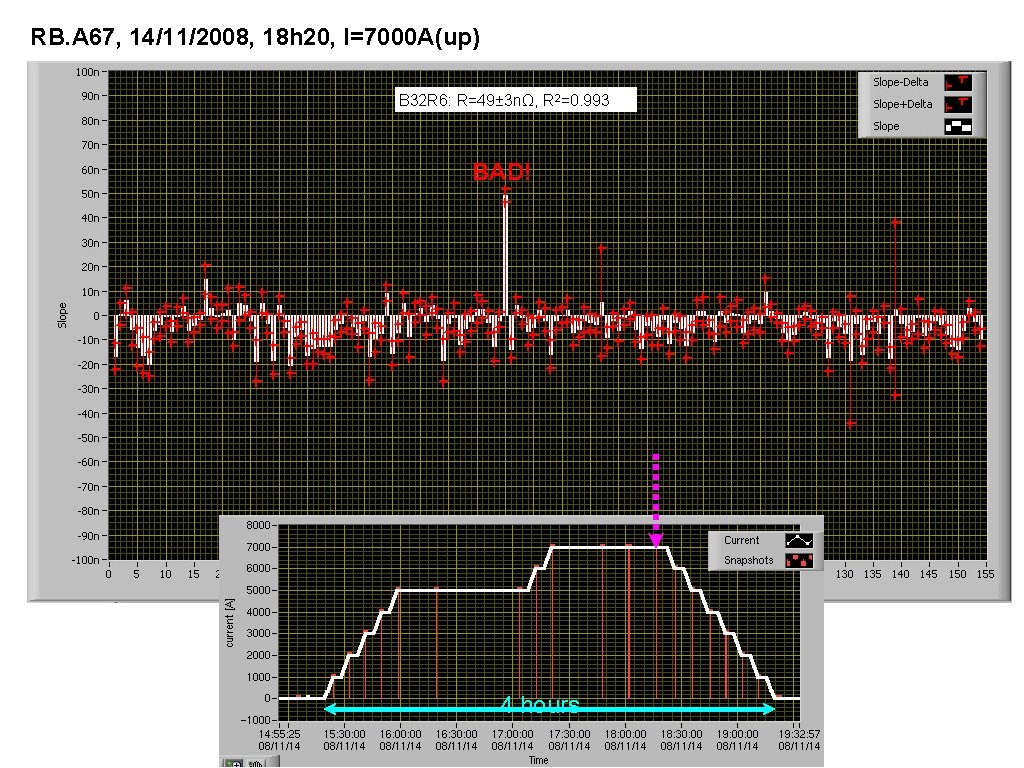
RB. A 67, 14/11/2008, 18 h 20, I=7000 A(up) B 32 R 6: R=49± 3 nΩ, R 2=0. 993 BAD! 4 hours
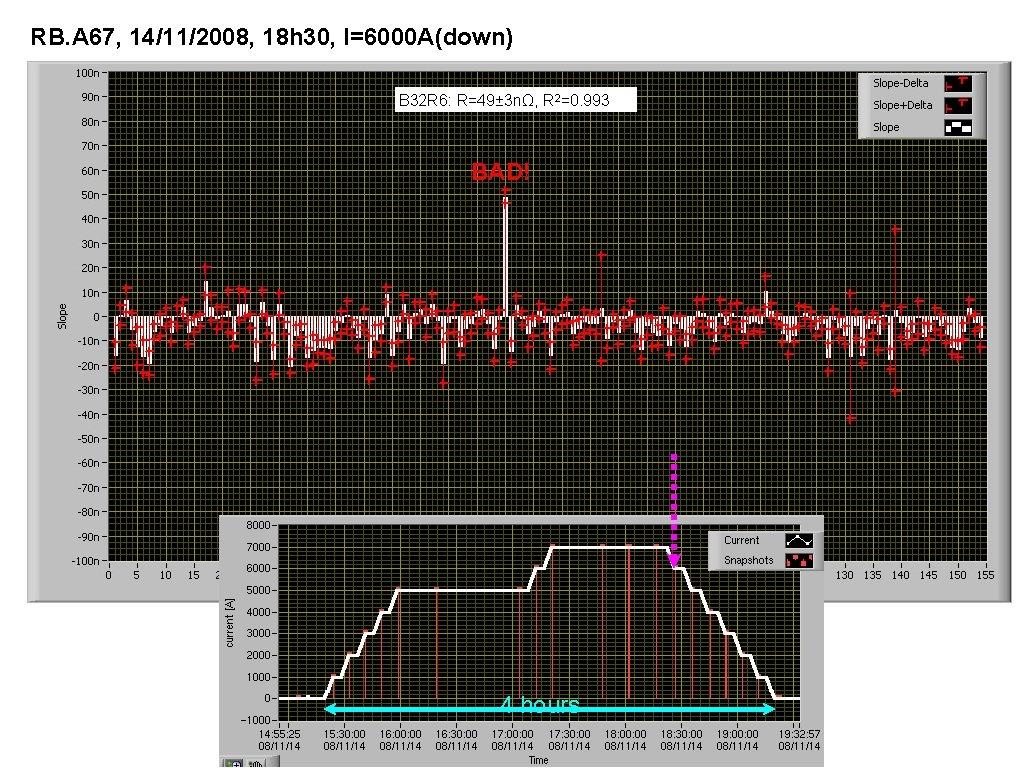
RB. A 67, 14/11/2008, 18 h 30, I=6000 A(down) B 32 R 6: R=49± 3 nΩ, R 2=0. 993 BAD! 4 hours
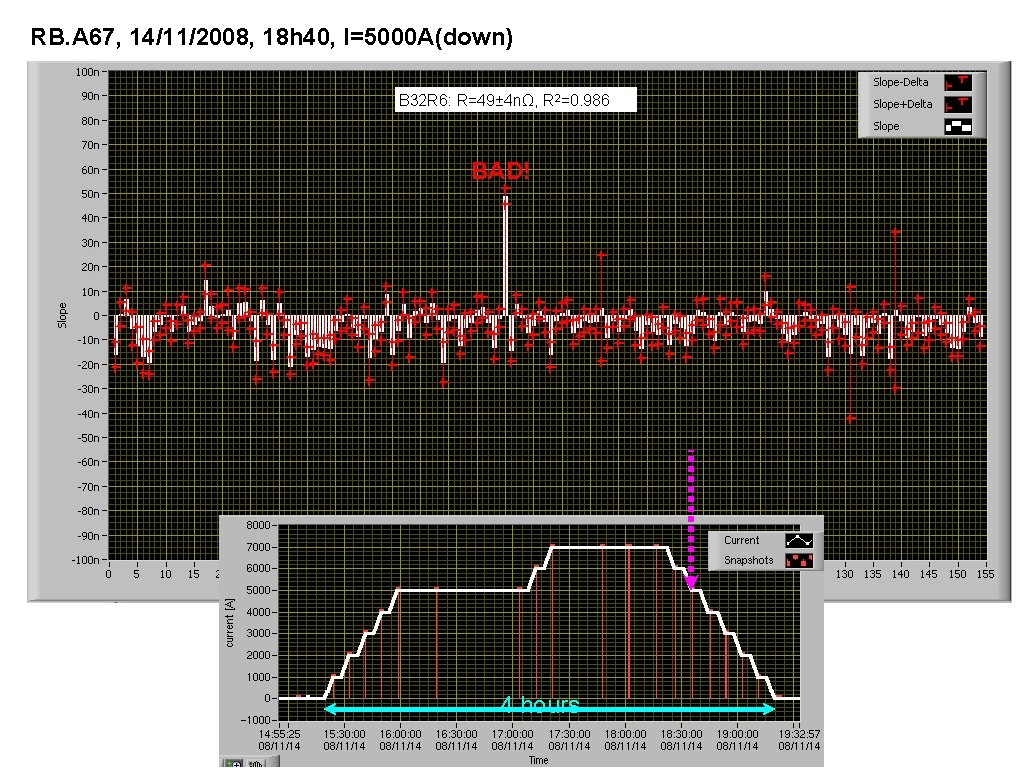
RB. A 67, 14/11/2008, 18 h 40, I=5000 A(down) B 32 R 6: R=49± 4 nΩ, R 2=0. 986 BAD! 4 hours
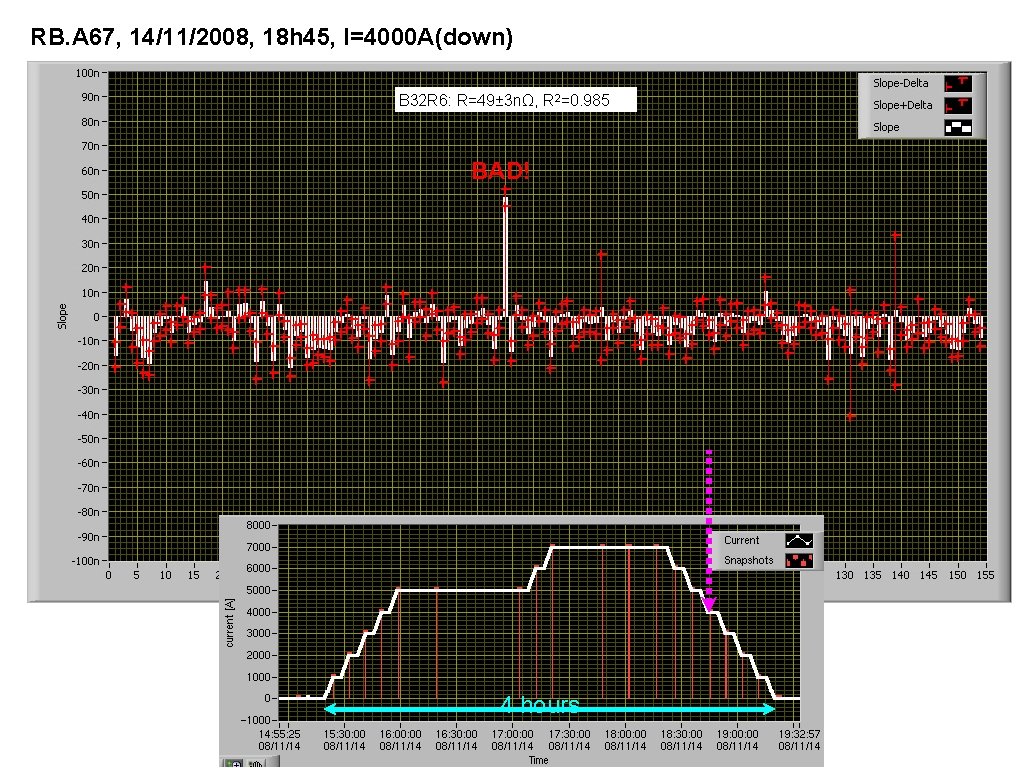
RB. A 67, 14/11/2008, 18 h 45, I=4000 A(down) B 32 R 6: R=49± 3 nΩ, R 2=0. 985 BAD! 4 hours
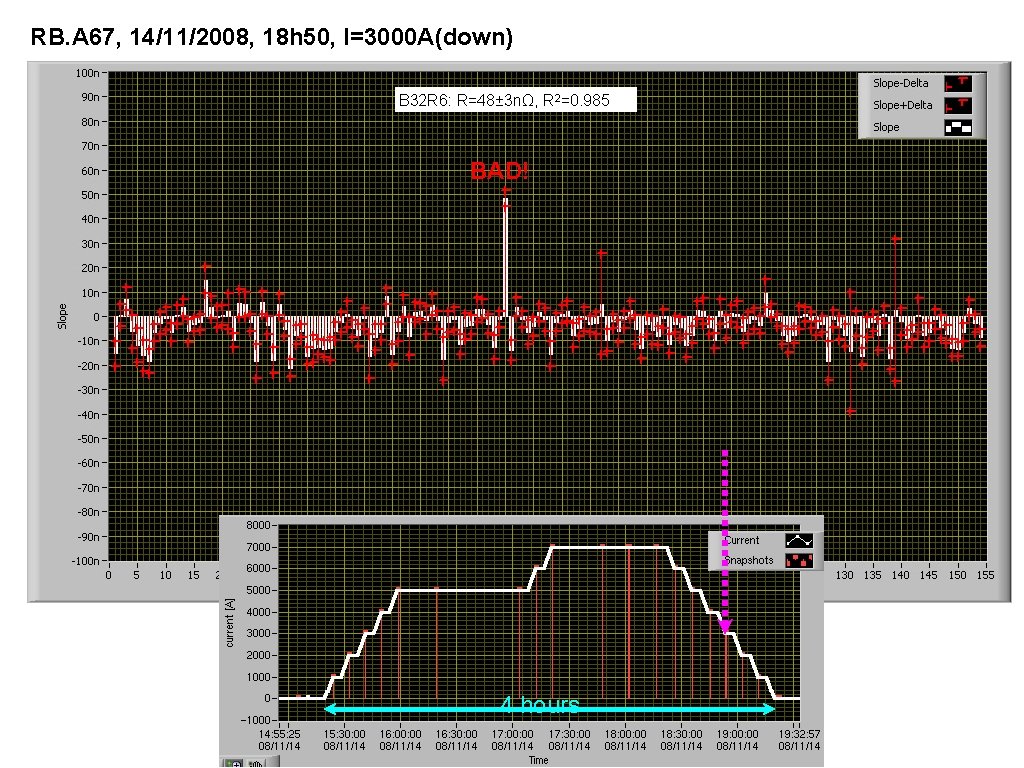
RB. A 67, 14/11/2008, 18 h 50, I=3000 A(down) B 32 R 6: R=48± 3 nΩ, R 2=0. 985 BAD! 4 hours
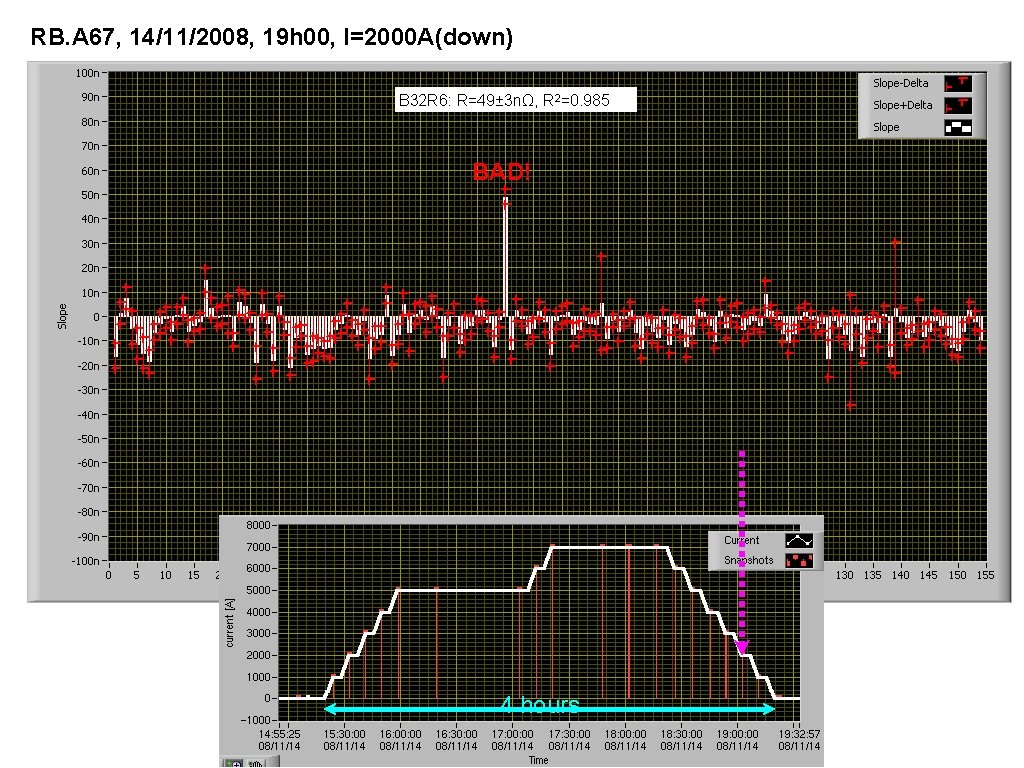
RB. A 67, 14/11/2008, 19 h 00, I=2000 A(down) B 32 R 6: R=49± 3 nΩ, R 2=0. 985 BAD! 4 hours
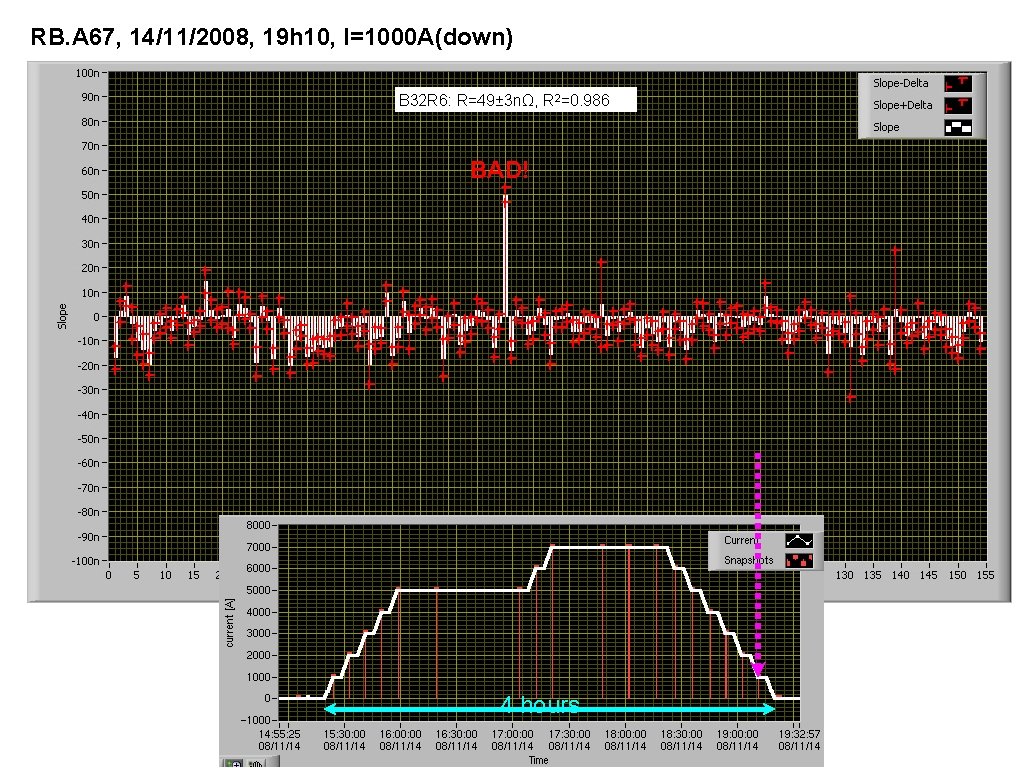
RB. A 67, 14/11/2008, 19 h 10, I=1000 A(down) B 32 R 6: R=49± 3 nΩ, R 2=0. 986 BAD! 4 hours
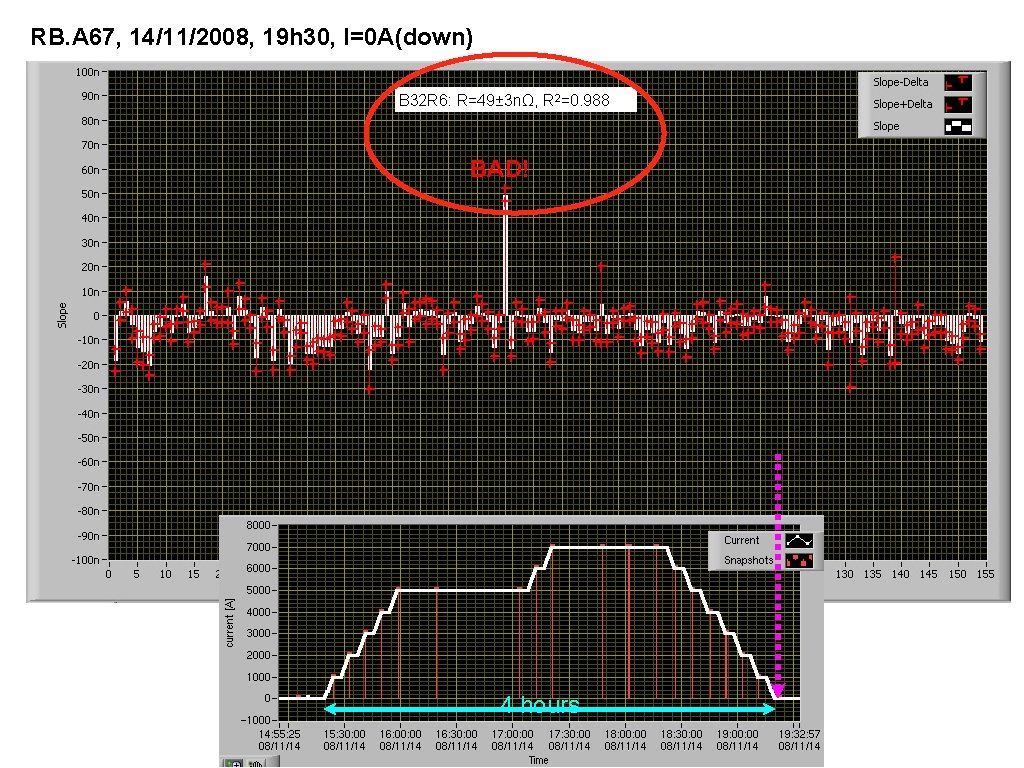
RB. A 67, 14/11/2008, 19 h 30, I=0 A(down) B 32 R 6: R=49± 3 nΩ, R 2=0. 988 BAD! 4 hours
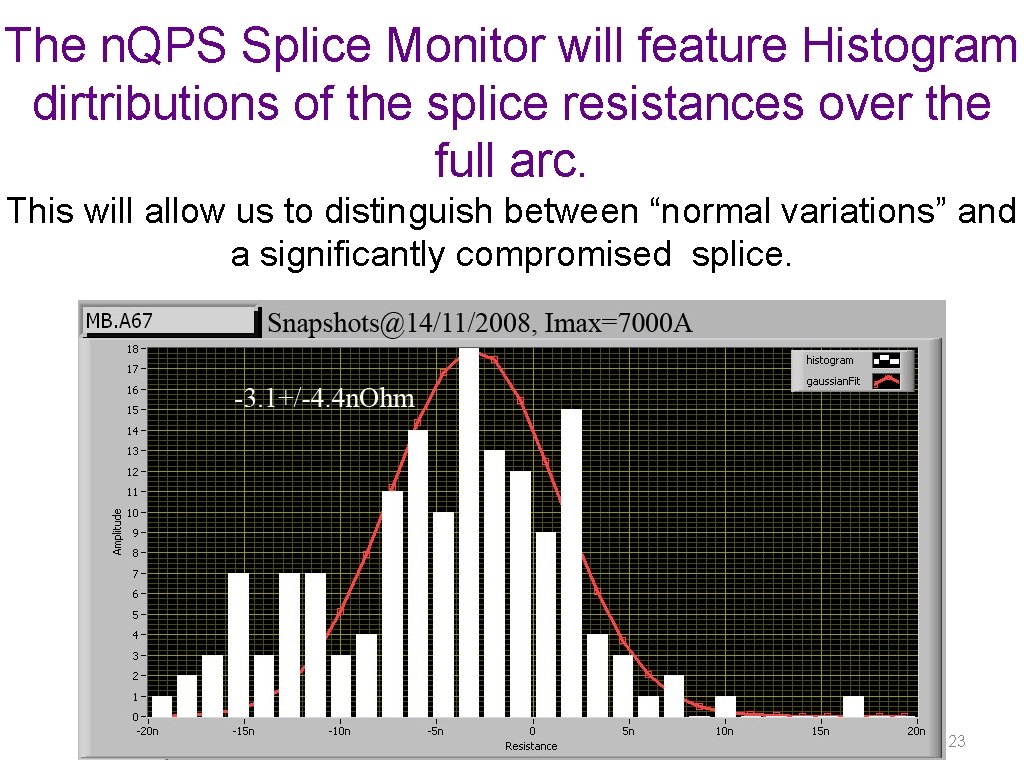
The n. QPS Splice Monitor will feature Histogram dirtributions of the splice resistances over the full arc. This will allow us to distinguish between “normal variations” and a significantly compromised splice. 23
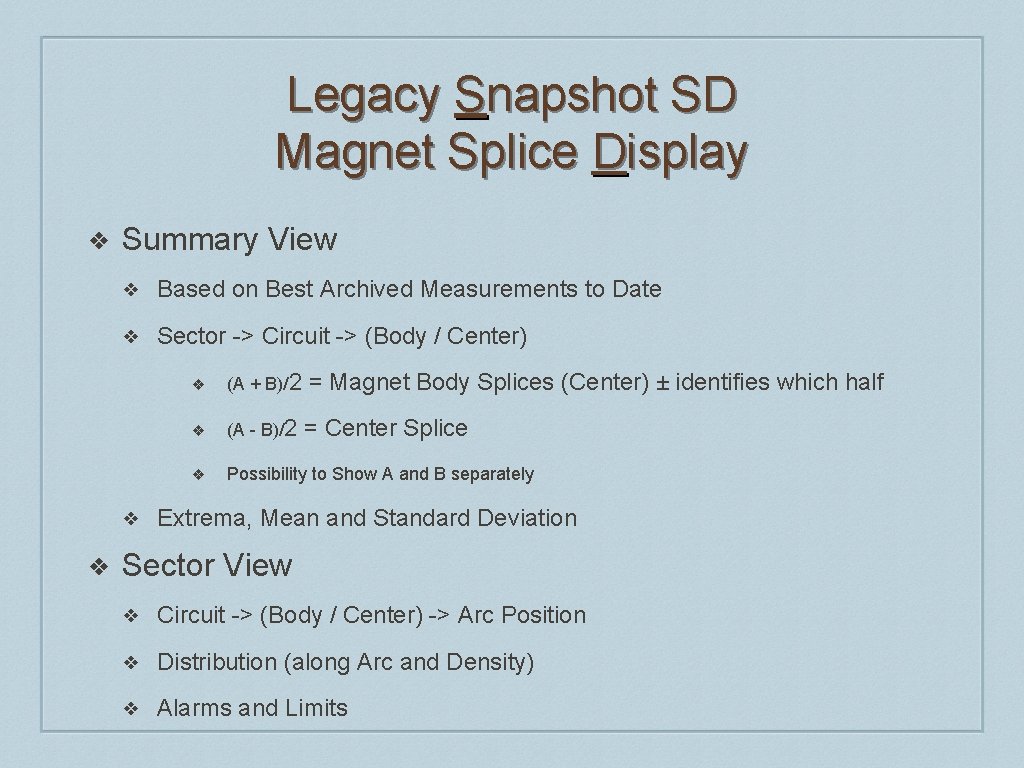
Legacy Snapshot SD Magnet Splice Display ❖ Driven by the Sequencer for each Main Circuit ❖ Invoked by the Sequencer ❖ Starting at zero current & after ramping to each new plateau ❖ ❖ Snapshot Pairs Provoked by the Sequencer ❖ Board B ❖ Board A Each New Snapshot Pair Data Set Delivered to the SD by Sequencer ❖ ❖ Current (I) & All Snapshot Data for Each Magnet from both A & B SD Display Updated for Each New Snapshot Pair Data Set
Legacy Snapshot SD Magnet Splice Display ❖ Summary View ❖ Based on Best Archived Measurements to Date ❖ Sector -> Circuit -> (Body / Center) ❖ ❖ ❖ (A + B)/2 = Magnet Body Splices (Center) ± identifies which half ❖ (A - B)/2 = Center Splice ❖ Possibility to Show A and B separately Extrema, Mean and Standard Deviation Sector View ❖ Circuit -> (Body / Center) -> Arc Position ❖ Distribution (along Arc and Density) ❖ Alarms and Limits
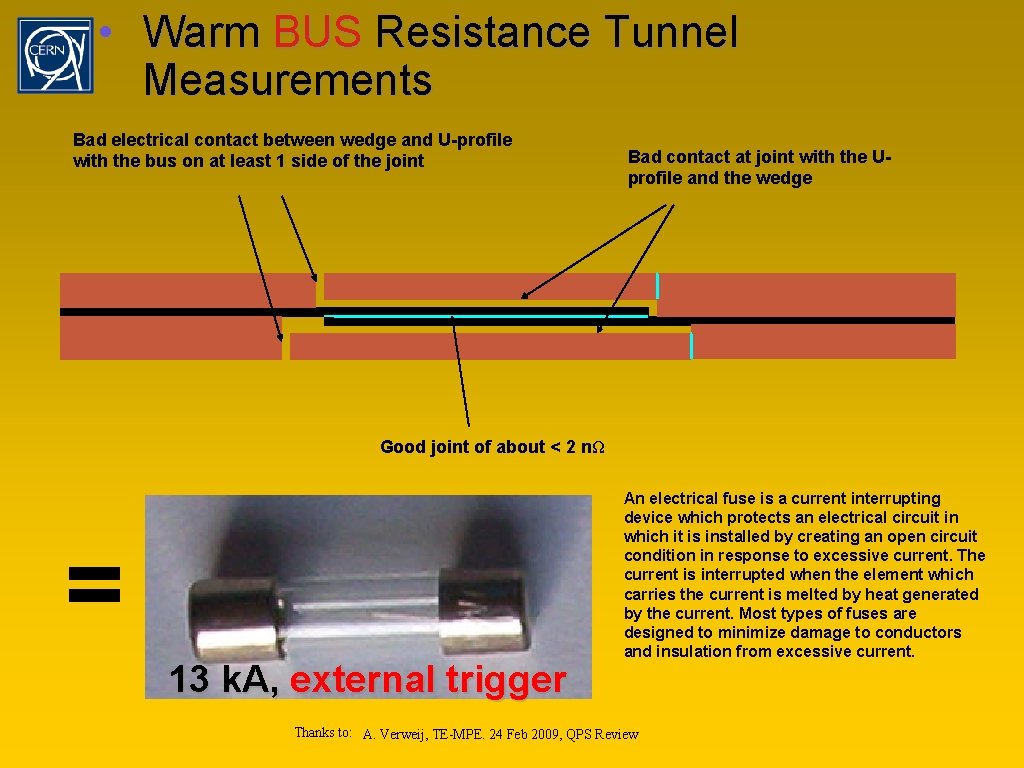
• Warm BUS Resistance Tunnel Measurements Bad electrical contact between wedge and U-profile with the bus on at least 1 side of the joint Bad contact at joint with the Uprofile and the wedge Good joint of about < 2 nΩ = 13 k. A, external trigger An electrical fuse is a current interrupting device which protects an electrical circuit in which it is installed by creating an open circuit condition in response to excessive current. The current is interrupted when the element which carries the current is melted by heat generated by the current. Most types of fuses are designed to minimize damage to conductors and insulation from excessive current. Thanks to: A. Verweij, TE-MPE. 24 Feb 2009, QPS Review
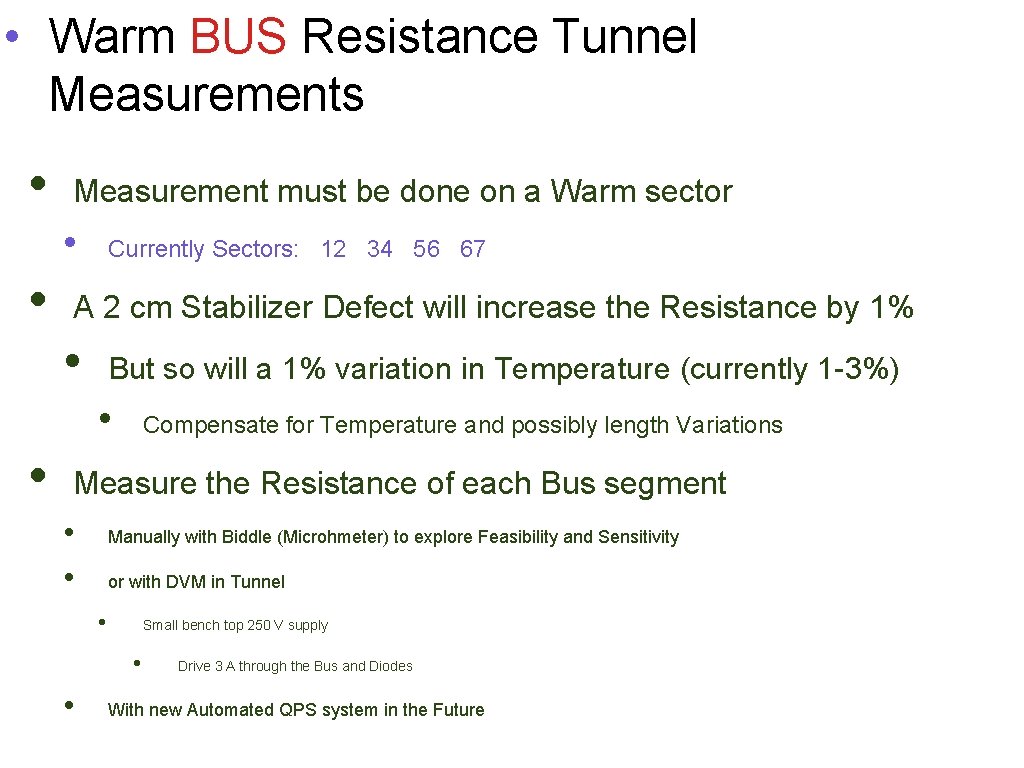
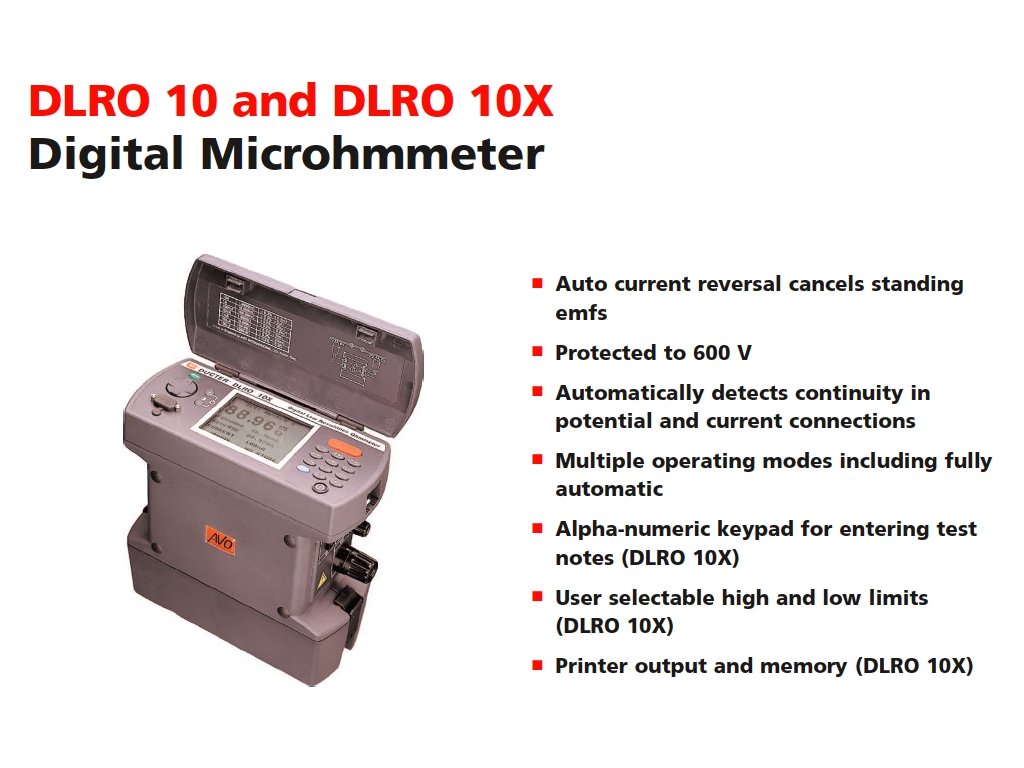
• Warm BUS Resistance Tunnel Measurements • Measurement must be done on a Warm sector • • Currently Sectors: 12 34 56 67 A 2 cm Stabilizer Defect will increase the Resistance by 1% • But so will a 1% variation in Temperature (currently 1 -3%) • • Compensate for Temperature and possibly length Variations Measure the Resistance of each Bus segment • • Manually with Biddle (Microhmeter) to explore Feasibility and Sensitivity or with DVM in Tunnel • Small bench top 250 V supply • • Drive 3 A through the Bus and Diodes With new Automated QPS system in the Future