
HW 4 Debriefing Terry A Ring Chemical Engineering
HW 4 Debriefing Terry A Ring Chemical Engineering University of Utah

Problem Statement • Using distillation heuristics 3 (H 3 - remove greatest molar flows early in sequence) and 4 (H 4 - sequence in order of decreasing relative volatilities) determine the most economical sequence in terms of the annual cost of the distillation sequence for this stream assuming a ≥ 98% overall recovery of each component with a mole percentage composition of ≥ 98%.
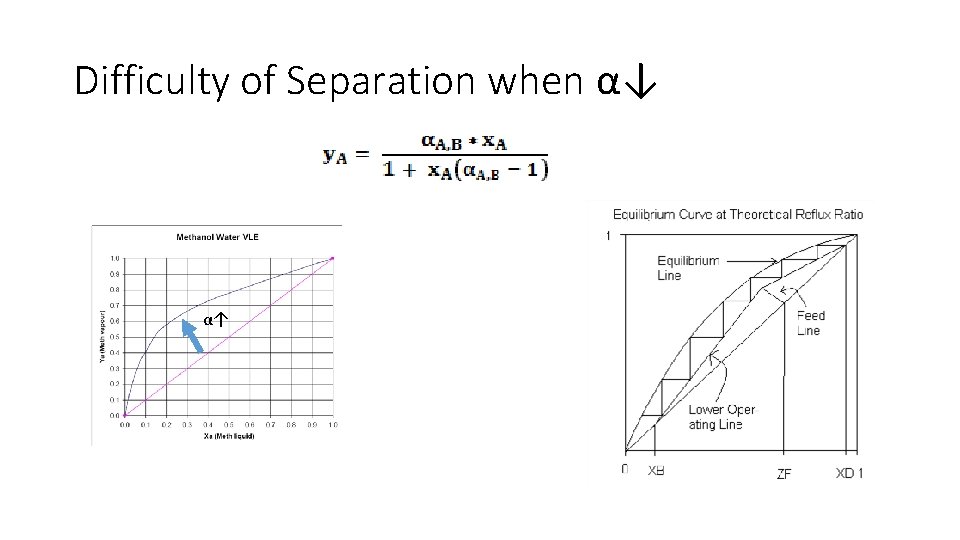
Difficulty of Separation when α↓ α↑
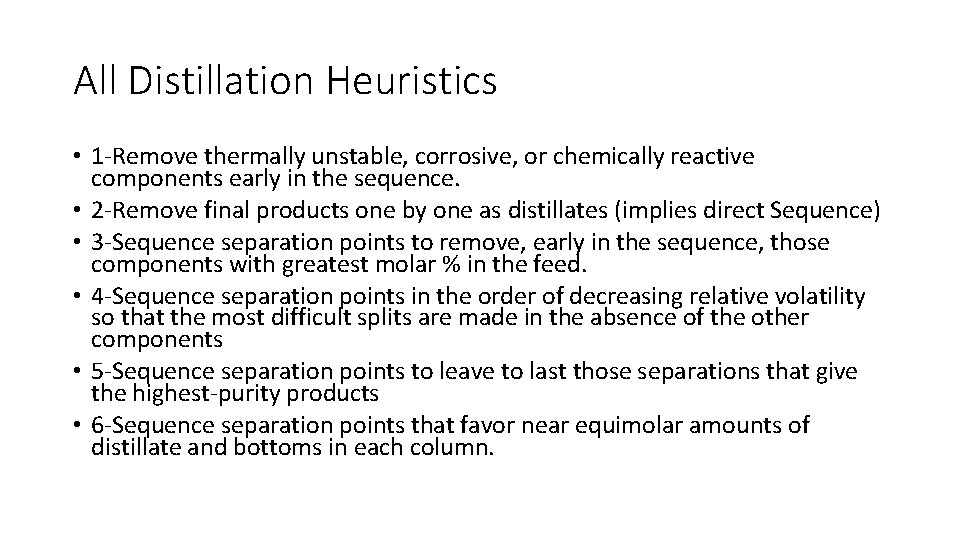
All Distillation Heuristics • 1 -Remove thermally unstable, corrosive, or chemically reactive components early in the sequence. • 2 -Remove final products one by one as distillates (implies direct Sequence) • 3 -Sequence separation points to remove, early in the sequence, those components with greatest molar % in the feed. • 4 -Sequence separation points in the order of decreasing relative volatility so that the most difficult splits are made in the absence of the other components • 5 -Sequence separation points to leave to last those separations that give the highest-purity products • 6 -Sequence separation points that favor near equimolar amounts of distillate and bottoms in each column.
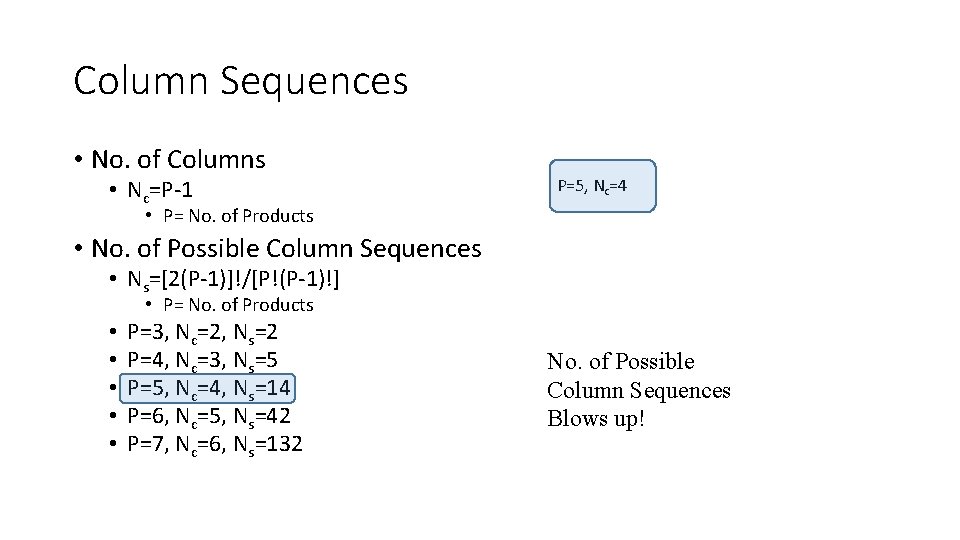
Column Sequences • No. of Columns • Nc=P-1 P=5, Nc=4 • P= No. of Products • No. of Possible Column Sequences • Ns=[2(P-1)]!/[P!(P-1)!] • • • P= No. of Products P=3, Nc=2, Ns=2 P=4, Nc=3, Ns=5 P=5, Nc=4, Ns=14 P=6, Nc=5, Ns=42 P=7, Nc=6, Ns=132 No. of Possible Column Sequences Blows up!
Possible Distillation Sequences • How do I determine which sequence is the most cost effective? ? ?
Marginal Vapor Rate • Marginal Annualized Cost~ Marginal Vapor Rate • Marginal Annualized Cost proportional to • • • Reboiler Duty (Operating Cost) Reboiler Area (Capital Cost) Condenser Duty (Operating Cost) Condenser Area (Capital Cost) Diameter of Column (Capital Cost) • Vapor Rate is proportional to all of the above
Selecting Multiple Column Separation Trains • Minimum Cost for Separation Train will occur when you have a Minimum of Total Vapor Flow Rate for all columns • Ri = 1. 2 Rmin • Vi=Di(Ri+1) • Vi= Vapor Flow Rate in a column • Di= Distillate Flow Rate • Ri =Recycle Ratio • Vtot=∑Vi • We may identify D as the desired distillate flow rate from the feed • Where do we get R or Rmin? ?
Rmin or R from Aspen/DSTWU
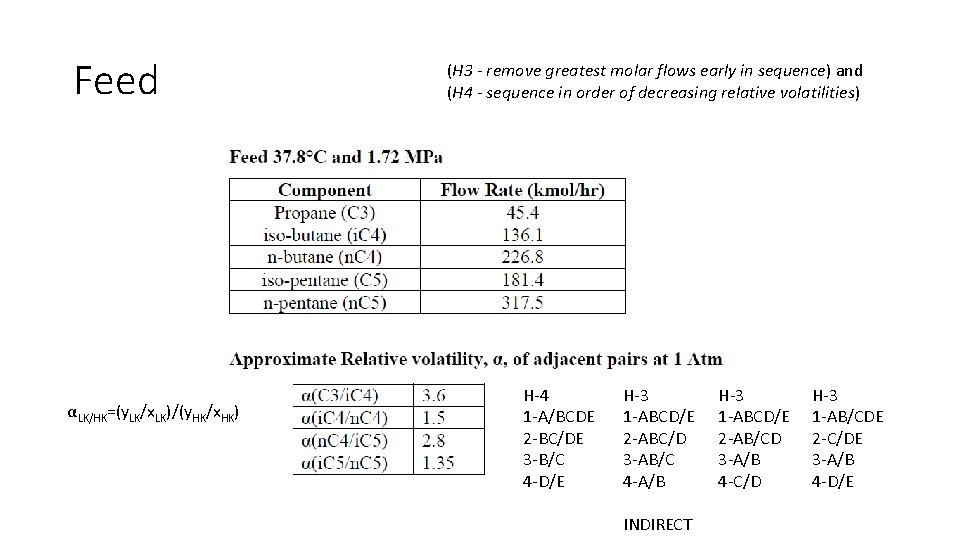
Feed αLK/HK=(y. LK/x. LK)/(y. HK/x. HK) (H 3 - remove greatest molar flows early in sequence) and (H 4 - sequence in order of decreasing relative volatilities) H-4 1 -A/BCDE 2 -BC/DE 3 -B/C 4 -D/E H-3 1 -ABCD/E 2 -ABC/D 3 -AB/C 4 -A/B INDIRECT H-3 1 -ABCD/E 2 -AB/CD 3 -A/B 4 -C/D H-3 1 -AB/CDE 2 -C/DE 3 -A/B 4 -D/E
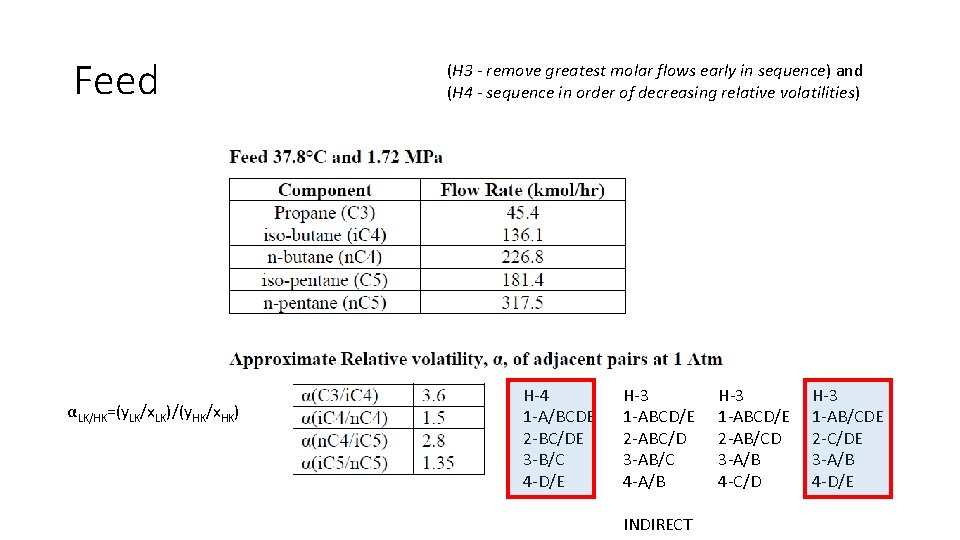
Feed αLK/HK=(y. LK/x. LK)/(y. HK/x. HK) (H 3 - remove greatest molar flows early in sequence) and (H 4 - sequence in order of decreasing relative volatilities) H-4 1 -A/BCDE 2 -BC/DE 3 -B/C 4 -D/E H-3 1 -ABCD/E 2 -ABC/D 3 -AB/C 4 -A/B INDIRECT H-3 1 -ABCD/E 2 -AB/CD 3 -A/B 4 -C/D H-3 1 -AB/CDE 2 -C/DE 3 -A/B 4 -D/E
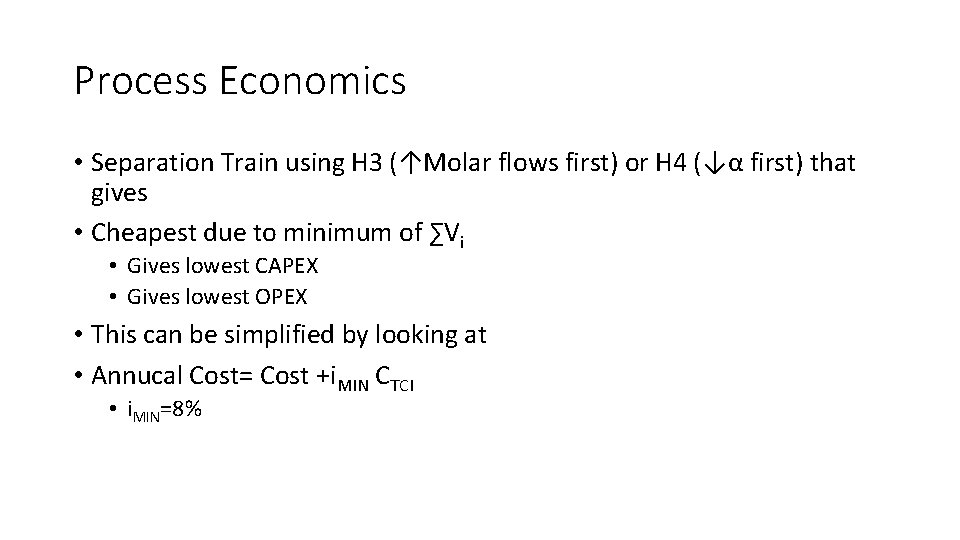
Process Economics • Separation Train using H 3 (↑Molar flows first) or H 4 (↓α first) that gives • Cheapest due to minimum of ∑Vi • Gives lowest CAPEX • Gives lowest OPEX • This can be simplified by looking at • Annucal Cost= Cost +i. MIN CTCI • i. MIN=8%
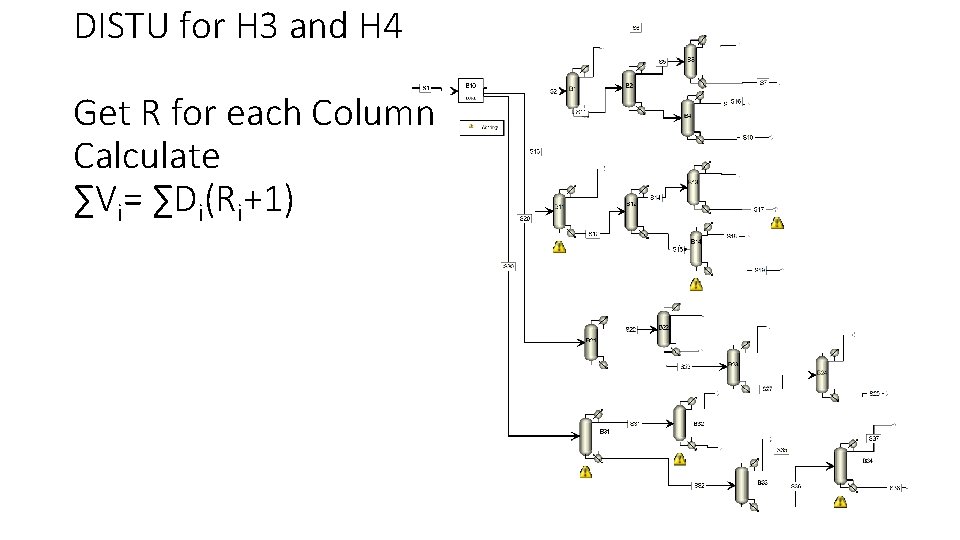
DISTU for H 3 and H 4 Get R for each Column Calculate ∑Vi= ∑Di(Ri+1)
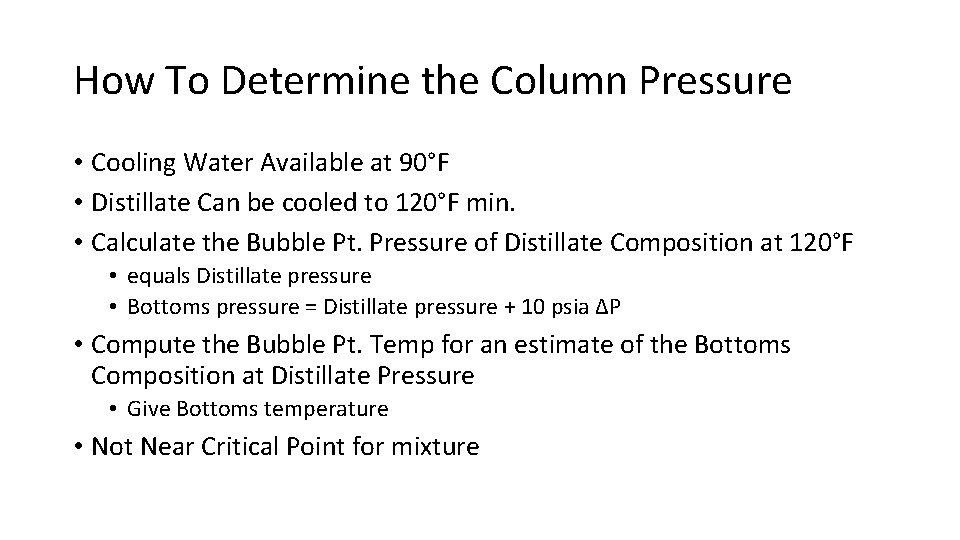
How To Determine the Column Pressure • Cooling Water Available at 90°F • Distillate Can be cooled to 120°F min. • Calculate the Bubble Pt. Pressure of Distillate Composition at 120°F • equals Distillate pressure • Bottoms pressure = Distillate pressure + 10 psia ΔP • Compute the Bubble Pt. Temp for an estimate of the Bottoms Composition at Distillate Pressure • Give Bottoms temperature • Not Near Critical Point for mixture
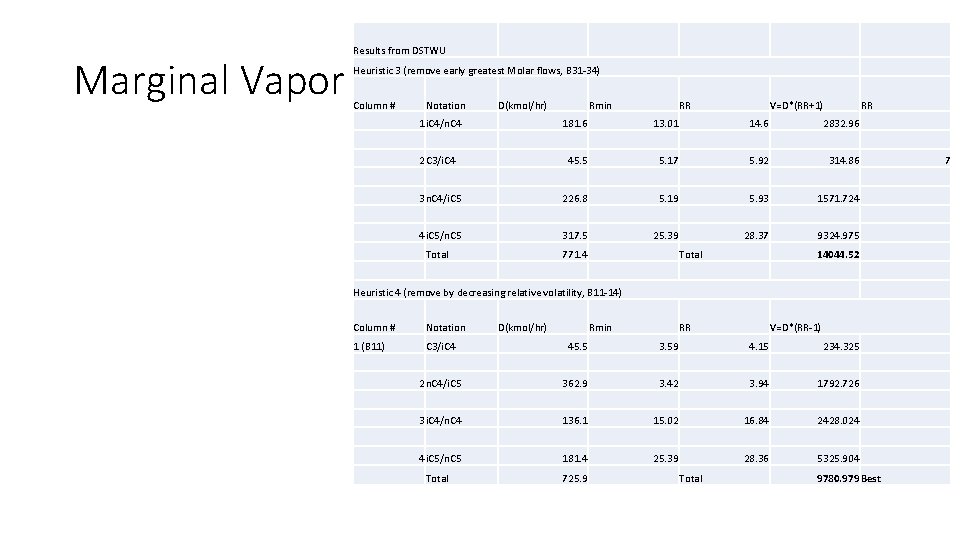
Marginal Vapor Results from DSTWU Heuristic 3 (remove early greatest Molar flows, B 31 -34) Column # Notation D(kmol/hr) Rmin RR V=D*(RR+1) RR 1 i. C 4/n. C 4 181. 6 13. 01 14. 6 2832. 96 2 C 3/i. C 4 45. 5 5. 17 5. 92 314. 86 3 n. C 4/i. C 5 226. 8 5. 19 5. 93 1571. 724 4 i. C 5/n. C 5 317. 5 25. 39 28. 37 9324. 975 Total 771. 4 Total 14044. 52 Heuristic 4 (remove by decreasing relative volatility, B 11 -14) Column # Notation D(kmol/hr) Rmin RR 1 (B 11) C 3/i. C 4 45. 5 3. 59 4. 15 234. 325 2 n. C 4/i. C 5 362. 9 3. 42 3. 94 1792. 726 3 i. C 4/n. C 4 136. 1 15. 02 16. 84 2428. 024 4 i. C 5/n. C 5 181. 4 25. 39 28. 36 5325. 904 Total 725. 9 Total V=D*(RR-1) 9780. 979 Best 7
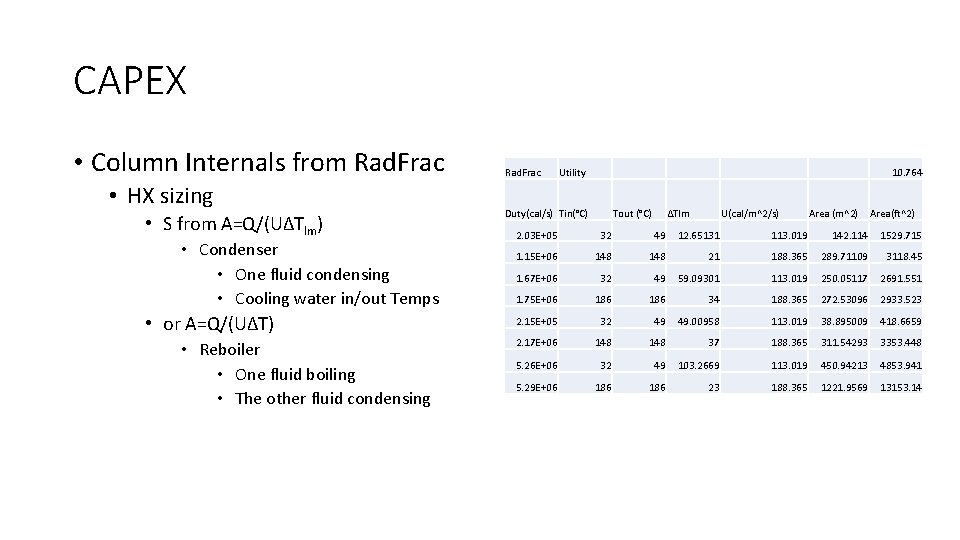
CAPEX • Column Internals from Rad. Frac • HX sizing • S from A=Q/(UΔTlm) • Condenser • One fluid condensing • Cooling water in/out Temps • or A=Q/(UΔT) • Reboiler • One fluid boiling • The other fluid condensing Rad. Frac Utility 10. 764 Duty(cal/s) Tin(°C) Tout (°C) ΔTlm U(cal/m^2/s) Area (m^2) Area(ft^2) 2. 03 E+05 32 49 12. 65131 113. 019 142. 114 1529. 715 1. 15 E+06 148 21 188. 365 289. 71109 3118. 45 1. 67 E+06 32 49 59. 09301 113. 019 250. 05117 2691. 551 1. 75 E+06 186 34 188. 365 272. 53096 2933. 523 2. 15 E+05 32 49 49. 00958 113. 019 38. 895009 418. 6659 2. 17 E+06 148 37 188. 365 311. 54293 3353. 448 5. 26 E+06 32 49 103. 2669 113. 019 450. 94213 4853. 941 5. 29 E+06 186 23 188. 365 1221. 9569 13153. 14
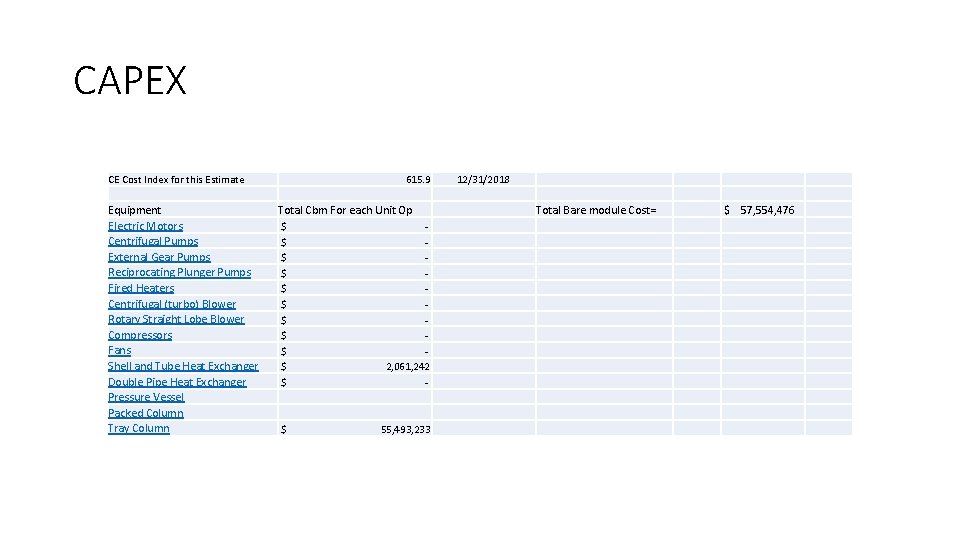
CAPEX CE Cost Index for this Estimate Equipment Electric Motors Centrifugal Pumps External Gear Pumps Reciprocating Plunger Pumps Fired Heaters Centrifugal (turbo) Blower Rotary Straight Lobe Blower Compressors Fans Shell and Tube Heat Exchanger Double Pipe Heat Exchanger Pressure Vessel Packed Column Tray Column 615. 9 Total Cbm For each Unit Op $ - $ - $ - $ 2, 061, 242 $ - $ 55, 493, 233 12/31/2018 Total Bare module Cost= $ 57, 554, 476
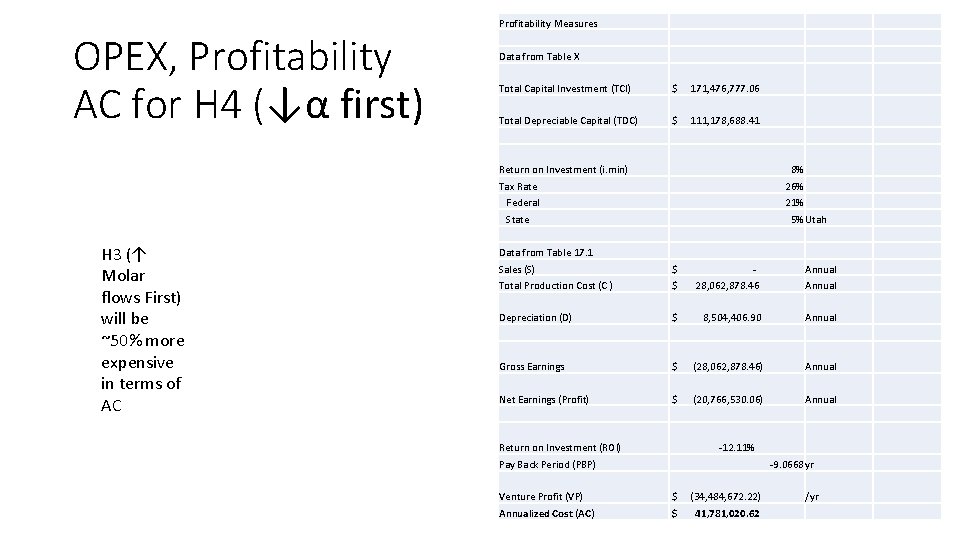
OPEX, Profitability AC for H 4 (↓α first) Profitability Measures Data from Table X Total Capital Investment (TCI) $ 171, 476, 777. 06 Total Depreciable Capital (TDC) $ 111, 178, 688. 41 Return on Investment (i. min) 8% Tax Rate 26% Federal 21% State H 3 (↑ Molar flows First) will be ~50% more expensive in terms of AC 5% Utah Data from Table 17. 1 Sales (S) $ - Annual Total Production Cost (C ) $ 28, 062, 878. 46 Annual Depreciation (D) $ 8, 504, 406. 90 Annual Gross Earnings $ (28, 062, 878. 46) Annual Net Earnings (Profit) $ (20, 766, 530. 06) Annual Return on Investment (ROI) -12. 11% Pay Back Period (PBP) -9. 0668 yr Venture Profit (VP) $ (34, 484, 672. 22) Annualized Cost (AC) $ 41, 781, 020. 62 /yr
- Slides: 18