HW 11 3 REACTION PROFILE DIAGRAMS ENERGY Key

 Reactants start")
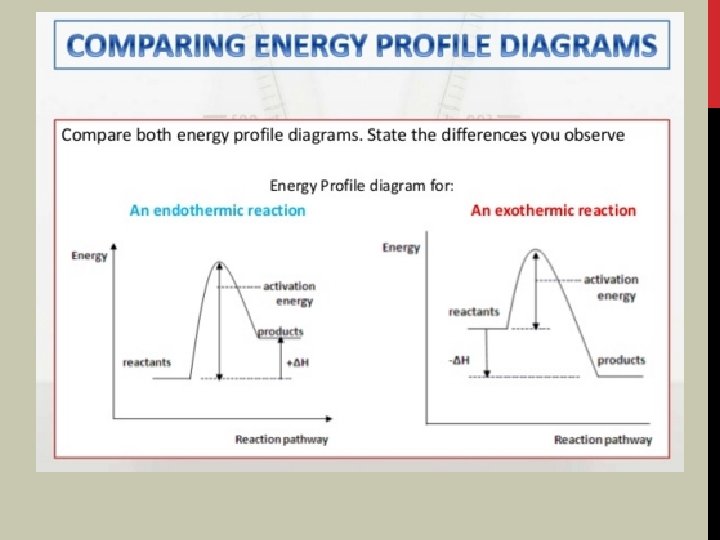
 EXOTHERMIC RXN PRODUCTS ARE LOWER IN E THAN REACTANTS;")
 RXN PROGRESS A) Ea = +10 k. J/mol ∆E = -10")
 RXN PROGRESS A) Ea = +10 k. J/mol ∆E = -10")
 RXN PROGRESS A) Ea = +30 k. J/mol ∆E = +10")
 RXN PROGRESS A) Ea = +30 k. J/mol ∆E = +10")
 RXN PROGRESS A) Ea = +25 k. J/mol ∆E = -30")
 RXN PROGRESS A) Ea = +25 k. J/mol ∆E = -30")
 RXN PROGRESS")
 Small Ea (Touch of a feather sets")
 A catalyst is a substance that SPEEDS UP the")


 Enzymes are biological")
 Enzymes control the")


- Slides: 23
HW 11 -3 REACTION PROFILE DIAGRAMS ENERGY
Key Features: Y-axis = ENERGY X-axis = Reaction Progress (similar to time) Reactants start at 0 energy. TS = HIGHEST energy point at the TOP of the activation barrier. Old bonds being BROKEN new bond being FORMED. ΔE = energy PRODUCTS – REACTANTS; Ea = Δ between R and TS
1 A AND 1 B) EXOTHERMIC RXN PRODUCTS ARE LOWER IN E THAN REACTANTS; ENDOTHERMIC REACTANTS ARE LOWER IN E THAN PRODUCTS
ENERGY (k. J/mol) RXN PROGRESS A) Ea = +10 k. J/mol ∆E = -10 k. J/mol
ENERGY (k. J/mol) RXN PROGRESS A) Ea = +10 k. J/mol ∆E = -10 k. J/mol
ENERGY (k. J/mol) RXN PROGRESS A) Ea = +30 k. J/mol ∆E = +10 k. J/mol
ENERGY (k. J/mol) RXN PROGRESS A) Ea = +30 k. J/mol ∆E = +10 k. J/mol
ENERGY (k. J/mol) RXN PROGRESS A) Ea = +25 k. J/mol ∆E = -30 k. J/mol
ENERGY (k. J/mol) RXN PROGRESS A) Ea = +25 k. J/mol ∆E = -30 k. J/mol
LINK TO NI 3 Reaction ENERGY (k. J/mol) RXN PROGRESS
Decomposition of NI 3: ENERGY (k. J/mol) Small Ea (Touch of a feather sets off reaction Large ∆E (Large amount of E released) RXN PROGRESS
HW 11 -3 CATALYSTS #5) A catalyst is a substance that SPEEDS UP the rate of a chemical reaction without itself BEING CONSUMED IN THE RXN.
TIME- LAPSE OF Co. Cl 2 CATALYZED 11 -3, RXN OF TARTRATE AND H 2 O 2 HW Part 6, # REACTION DOES NOT OCCUR AT OBSERVABLE RATE WITHOUT CATALYST Initial Final During Link #6 Catalyst
TIME- LAPSE OF Co. Cl 2 CATALYZED 11 -3, RXN OF TARTRATE AND H 2 O 2 HW Part 6, # Link #6 Catalyst Initial During Final Catalyst (Co. Cl 2) accelerates the rate of reaction without itself being consumed in the reaction
11 -3, #7 CATALYST IN OZONE DECOMPOSITION RXN Cl is the catalyst; It speeds up the breakdown of ozone, but is not used up in the reaction.
Higher % successfully jumped lower height barrier 1 1/5 x 100 = 20% 4 4/5 x 100 = 80%
HW 11 -3, #9: CATALYSTS ACCELERATE REACTIONS WITHOUT BEING CONSUMED BY LOWERING THE ENERGY OF ACTIVATION Lower Ea = Faster rxn A) ∆E does NOT change B) Ea is SMALLER C) LOWERING Link to collision theory animation
HW 11 -3, #10 A – WHAT IS AN ENZYME? A) Enzymes are biological catalysts that speed up the rate of chemical reactions inside your body.
HW 11 -3, #10 B – WHY ARE ENZYMES IMPORTANT? B) Enzymes control the rates of virtually all important chemical reactions in your body.
PICTURE OF ENZYME CATALYST Active site Enzyme link HW 11 -3, #10
Active site
ENZYME ACTIVE SITE WILL ONLY ACCEPT SPECIFIC SUBSTRATES REACTANTS WITH CORRECT SIZE AND SHAPE