HV Measurements Generating Voltmeter Whenever the source loading


 is the electric field density or charge density")
 is given by where σ (a) = εE(a)")


 scale is linear and")


, Fig is given by the rate of change of")


 provides for matching at both ends")
 it acts as an electrostatic shield")


 Simple matching (b)")
")


 is")


 can be carried out more elegantly by using an appropriately")


- Slides: 64
HV Measurements
Generating Voltmeter Whenever the source loading is not permitted or when direct connection to the high voltage source is to be avoided, the generating principle is employed for the measurement of high voltages. A generating voltmeter is a variable capacitor electrostatic voltage generator which generates current proportional to the voltage to be measured. Similar to electrostatic voltmeter the generating voltmeter provides loss free measurement of d. c. and a. c. voltages. The device is driven by an external constant speed motor and does not absorb power or
Generating Voltmeter
Principle of operation H is a high voltage electrode and the earthed electrode is subdivided into a sensing or pick up electrode P, a guard electrode G and a movable electrode M, all of which are at the same potential. The high voltage electrode H develops an electric field between itself and the electrodes P, G and M. The field lines are shown in Fig. The electric field density σ is also shown. If electrode M is fixed and the voltage V is changed, the field density σ would change and thus a current i (t) would flow between P and the ground.
Principle of operation Where σ (a) is the electric field density or charge density along some path and is assumed constant over the differential area da of the pick up electrode. In this case σ (a) is a function of time also and ∫ da the area of the pick up electrode P exposed to the electric field. However, if the voltage V to be measured is constant (d. c voltage), a current i(t) will flow only if it is moved i. e. now σ (a) will not be function of time but the charge q is changing because the area of the pick up electrode exposed to the electric field is changing.
Principle of operation The current i(t) is given by where σ (a) = εE(a) and ε is the permittivity of the medium between the high voltage electrode and the grounded electrode. The integral boundary denotes the time varying exposed area. The high voltage electrode and the grounded electrode in fact constitute a capacitance system. The capacitance is, however, a function of time as the area A varies with time and,
The current is For DC voltages Hence If the capacitance varies linearly with time and reaches its peak value Cm is time Tc /2 and again reduces to zero linearly in time Tc /2, the capacitance is given as For a constant speed of n rpm of synchronous motor which is varying the capacitance, time Tc is given by Tc = 60/n. Therefore If the capacitance C varies sinusoidally between the limits C 0 and (C 0 + Cm) then C = C 0 + Cm sin wt and the current i is then given as i(t) = im cos wt where im = VCmω
o Here ω is the angular frequency of variation of the capacitance. If ω is constant, the current measured is proportional to the voltage being measured. o Generally the current is rectified and measured by a moving coil meter. o Generating voltmeters can be used for a. c. voltage measurement also provided the angular frequency ω is the same or equal to half that of the voltage being measured. o Fig shows the variations of C as a function of time together with a. c. voltage, the frequency of which is twice the frequency of C (t). o It can be seen from Fig that whatever be the phase relation between voltage and the capacitance, over one cycle variation of the voltage is same (e. g. V(t 1) – V(t 2)) and the rate of change of capacitance over the period Tv is equal to Cm/Tv. o Therefore, the instantaneous value of current i(t) = Cmfv. V(t) where fv = 1/Tv the frequency of voltage. Since fv = 2 fc and fc = n/60 we obtain I(t) = n/30 Cm. V(t)
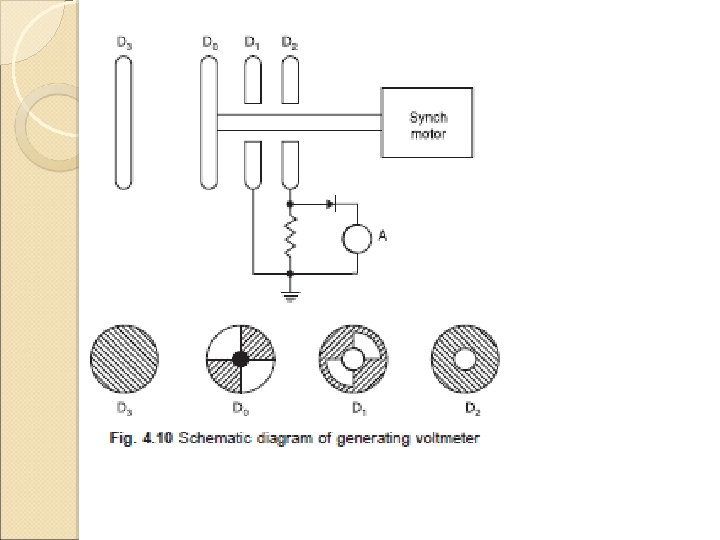
o. Fig. shows a schematic diagram of a generating voltmeter which employs rotating vanes for variation of capacitance. o. The high voltage electrode is connected to a disc electrode D 3 which is kept at a fixed distance on the axis of the other low voltage electrodes D 2, D 1, and D 0. o. The rotor D 0 is driven at a constant speed by a synchronous motor at a suitable speed. The rotor vanes of D 0 cause periodic change in capacitance between the insulated disc D 2 and the high voltage electrode D 3. o. The number and shape of vanes are so designed that a suitable variation of capacitance (sinusoidal or linear) is achieved. The a. c. current is rectified and is measured using moving coil meters. o If the current is small an amplifier may be used before the current is measured. o. Generating voltmeters are linear scale instruments and applicable over a wide range of voltages. o. The sensitivity can be increased by increasing the area of the pick up electrode and by using amplifier circuits.
Generating Voltmeter The main advantages of generating voltmeters are (i) scale is linear and can be extrapolated (ii) source loading is practically zero (iii) no direct connection to the high voltage electrode. However, they require calibration and construction is quite cumbersome. The breakdown of insulating materials depends upon the magnitude of voltage applied and the time of application of voltage. However, if the peak value of voltage is large as compared to breakdown strength of the insulating material, the disruptive discharge phenomenon is in general caused by the instantaneous maximum field gradient stressing the material.
o. Various methods discussed so far can measure peak voltages but because of complex calibration procedures and limited accuracy call for more convenient and more accurate methods. o. A more convenient though less accurate method would be the use of a testing transformer wherein the output voltage is measured and recorded and the input voltage is obtained by multiplying the output voltage by the transformation ratio. o. However, here the output voltage depends upon the loading of the secondary winding and wave shape variation is caused by the transformer impedances and hence this method is unacceptable for peak voltage measurements. o. Chubb and Fortescue suggested a simple and accurate method of measuring peak value of a. c. voltages.
THE CHUBB-FORTESCUE METHOD Chubb and Fortescue suggested a simple and accurate method of measuring peak value of a. c. voltages. The basic circuit consists of a standard capacitor, two diodes and a current integrating ammeter (MC ammeter) as shown in Fig (a).
The displacement current ic(t), Fig is given by the rate of change of the charge and hence the voltage V(t) to be measured flows through the high voltage capacitor C and is subdivided into positive and negative components by the back to back connected diodes. The voltage drop across these diodes can be neglected (1 V for Si diodes) as compared with the voltage to be measured. The measuring instrument (M. C. ammeter) is included in one of the branches. The ammeter reads the mean value of the current.
The relation is similar to the one obtained in case of generating voltmeters. An increased current would be obtained if the current reaches zero more than once during one half cycle. This means the wave shapes of the voltage would contain more than one maxima per half cycle. The standard a. c. voltages for testing should not contain any harmonics and, therefore, there could be very short and rapid voltages caused by the heavy predischarges, within the test circuit which could introduce errors in measurements. To eliminate this problem filtering of a. c. voltage is carried out by introducing a damping resistor in between the capacitor and the diode circuit, Fig. (b).
Also, if full wave rectifier is used instead of the half wave as shown in Fig. the factor 2 in the denominator of the above equation should be replaced by 4. Since the frequency f, the capacitance C and current I can be measured accurately, the measurement of symmetrical a. c voltages using Chubb and Fortescue method is quite accurate and it can be used for calibration of other peak voltage measuring devices.
Fig. shows a digital peak voltage measuring circuit. In contrast to the method discussed just now, the rectified current is not measured directly, instead a proportional analog voltage signal is derived which is then converted into a proportional medium frequency for using a voltage to frequency convertor(Block A in Fig. ). The frequency ratio fm/f is measured with a gate circuit controlled by the a. c power frequency (supply frequency f) and a counter that opens for an adjustable number of period Δt = p/f. The number of cycles n counted during this interval is
Thus the indicator can be calibrated to read Vm directly by selecting suitable values of A, p and R. The voltmeter is found to given an accuracy of 0. 35%.
Peak Voltmeters with Potential Dividers Passive circuits are not very frequently used these days for measurement of the peak value of a. c. or impulse voltages. The development of fully integrated operational amplifiers and other electronic circuits has made it possible to sample and hold such voltages and thus make measurements and, therefore, have replaced the conventional passive circuits. However, it is to be noted that if the passive circuits are designed properly, they provide simplicity and adequate accuracy and hence a small description of these circuits is in order. Passive circuits are cheap , reliable and have a high order of electromagnetic compatibility. However, in contrast, the most sophisticated electronic instruments are costlier and their electromagnetic compatibility (EMC) is low. The passive circuits cannot measure high voltages directly and use potential dividers preferably of the capacitance type.
Fig. shows a simple peak voltmeter circuit consisting of a capacitor voltage divider which reduces the voltage V to be measured to a low voltage Vm. Suppose R 2 and Rd are not present and the supply voltage is V. The voltage across the storage capacitor Cs will be equal to the peak value of voltage across C 2 assuming voltage drop across the diode to be negligibly small. The voltage could be measured by an electrostatic voltmeter or other suitable voltmeters with very high input impedance.
If the reverse current through the diode is very small and the discharge time constant of the storage capacitor very large, the storage capacitor will not discharge significantly for a long time and hence it will hold the voltage to its value for a long time. If now, V is decreased, the voltage V 2 decreases proportionately and since now the voltage across C 2 is smaller than the voltage across Cs to which it is already charged, therefore, the diode does not conduct and the voltage across Cs does not follow the voltage across C 2. Hence, a discharge resistor Rd must be introduced into the circuit so that the voltage across Cs follows the voltage across C 2.
From measurement point of view it is desirable that the quantity to be measured should be indicated by the meter within a few seconds and hence Rd is so chosen that Rd. Cs ≈ 1 sec. As a result of this, following errors are introduced. With the connection of Rd, the voltage across Cs will decrease continuously even when the input voltage is kept constant. Also, it will discharge the capacitor C 2 and the mean potential of V 2(t) will gain a negative d. c. component. Hence a leakage resistor R 2 must be inserted in parallel with C 2 to equalise these unipolar discharge currents. The second error corresponds to the voltage shape across the storage capacitor which contains ripple and is due to the discharge of the capacitor Cs. If the input impedance of the measuring device is very high, the ripple is independent of the meter being used. The error is approximately proportional to the ripple factor and is thus frequency dependent as the discharge time constant cannot be changed. If Rd. Cs = 1 sec, the discharge error amounts to 1% for 50 Hz and 0. 33% for 150 Hz.
The third source of error is related to this discharge error. During the conduction time(when the voltage across Cs is lower than that across C 2 because of discharge of Cs through Rd) of the diode the storage capacitor Cs is recharged to the peak value and thus Cs becomes parallel with C 2. If discharge error is ed, recharge error er is given by Hence Cs should be small as compared with C 2 to keep down the recharge error. It has also been observed that in order to keep the overall error to a low value, it is desirable to have a high value of R 2.
The same effect can be obtained by providing an equalizing arm to the low voltage arm of the voltage divider as shown in Fig. This is accomplished by the addition of a second network comprising diode, Cs and Rd for negative polarity currents to the circuit shown in previous Fig. With this, the d. c. currents in both branches are opposite in polarity and equalize each other. The errors due to R 2 are thus eliminated.
IMPULSE VOLTAGE MEASUREMENTS USING VOLTAGE DIVIDERS If the amplitudes of the impulse voltage is not high and is in the range of a few kilovolts, it is possible to measure them even when these are of short duration by using CROS. However, if the voltages to be measured are of high magnitude of the order of Megavolts which normally is the case for testing and research purposes, various problems arise. The voltage dividers required are of special design and need a thorough understanding of the interaction present in these voltage dividing systems.
Fig. shows a layout of a voltage testing circuit within a high voltage testing area. The voltage generator G is connected to a test object—T through a lead L. These three elements form a voltage generating system. The lead L consists of a lead wire and a resistance to damp oscillation or to limit short-circuit currents if the test object fails. The measuring system starts at the terminals of the test object and consists of a connecting lead CL to the voltage divider D. The output of the divider is fed to the measuring instrument (CRO etc. ) M. The appropriate ground return should assure low voltage drops for even highly transient phenomena and keep the ground potential of zero as far as possible.
It is to be noted that the test object is a predominantly capacitive element and thus this forms an oscillatory circuit with the inductance of the lead. These oscillations are likely to be excited by any steep voltage rise from the generator output, but will only partly be detected by the voltage divider. A resistor in series with the connecting leads damps out these oscillations. The voltage divider should always be connected outside the generator circuit towards the load circuit (Test object) for accurate measurement. In case it is connected within the generator circuit, and the test object discharges (chopped wave) the whole generator including voltage divider will be discharged by this short circuit at the test object and thus the voltage divider is loaded by the voltage drop across the lead L. As a result, the voltage measurement will be wrong.
Yet for another reason, the voltage divider should be located away from the generator circuit. The dividers cannot be shielded against external fields. All objects in the vicinity of the divider which may acquire transient potentials during a test will disturb the field distribution and thus the divider performance. Therefore, the connecting lead CL is an integral part of the potential divider circuit. In order to avoid electromagnetic interference between the measuring instrument M and C the high voltage test area, the length of the delay cable should be adequately chosen. Very short length of the cable can be used only if the measuring instrument has high level of electromagnetic compatibility (EMC).
For any type of voltage to be measured, the cable should be co-axial type. The outer conductor provides a shield against the electrostatic field and thus prevents the penetration of this field to the inner conductor. Even though, the transient magnetic fields will penetrate into the cable, no appreciable voltage is induced due to the symmetrical arrangement. Ordinary coaxial cables with braided shields may well be used for d. c. and a. c. voltages. However, for impulse voltage measurement double shielded cables with pre-dominently two insulated braided shields will be used for better accuracy.
During disruption of test object, very heavy transient current flow and hence the potential of the ground may rise to dangerously high values if proper earthing is not provided. For this, large metal sheets of highly conducting material such as copper or aluminium are used. Most of the modern high voltage laboratories provide such ground return along with a Faraday Cage for a complete shielding of the laboratory. Expanded metal sheets give similar performance. At least metal tapes of large width should be used to reduce the impedance.
Voltage Divider Voltages dividers for a. c. , d. c. or impulse voltages may consist of resistors or capacitors or a convenient combination of these elements. Inductors are normally not used as voltage dividing elements as pure inductances of proper magnitudes without stray capacitance cannot be built and also these inductances would otherwise form oscillatory circuit with the inherent capacitance of the test object and this may lead to inaccuracy in measurement and high voltages in the measuring circuit. The height of a voltage divider depends upon the flash over voltage and this follows from the rated maximum voltage applied.
Now, the potential distribution may not be uniform and hence the height also depends upon the design of the high voltage electrode, the top electrode. For voltages in the megavolt range, the height of the divider becomes large. As a thumb rule following clearances between top electrode and ground may be assumed. 2. 5 to 3 metres/MV for d. c. voltages. 2 to 2. 5 m/MV for lightning impulse voltages. More than 5 m/MV rms for a. c. voltages. More than 4 m/MV for switching impulse voltage. .
The potential divider is most simply represented by two impedances Z 1 and Z 2 connected in series and the sample voltage required for measurement is taken from across Z 2, Fig. If the voltage to be measured is V 1 and sampled voltage V 2, then Fig. Basic diagram of a potential divider circuit
The voltage V 2 is normally only a few hundred volts and hence the value of Z 2 is so chosen that V 2 across it gives sufficient deflection on a CRO. Therefore, most of the voltage drop is available across the impedance Z 1 and since the voltage to be measured is in megavolt the length of Z 1 is large which result in inaccurate measurements because of the stray capacitances associated with long length voltage dividers (especially with impulse voltage measurements) unless special precautions are taken. On the low voltage side of the potential dividers where a screened cable of finite length has to be employed for connection to the oscillograph other errors and distortion of wave shape can also occur.
Resistance Potential Dividers The resistance potential dividers are the first to appear because of their simplicity of construction, less space requirements, less weight and easy portability. These can be placed near the test object which might not always be confined to one location. The length of the divider depends upon two or three factors. The maximum voltage to be measured is the first and if height is a limitation, the length can be based on a surface flash over gradient in the order of 3– 4 k. V/cm irrespective of whether the resistance R 1 is of liquid or wire-wound construction. The length also depends upon the resistance value but this is implicitly bound up with the stray capacitance of the resistance column, the product of the two (RC) giving a time constant the value of which must not exceed the duration of the wave front it is required to record. It is to be noted with caution that the resistance of the potential divider should be matched to the equivalent resistance of a given generator to obtain a given wave shape.
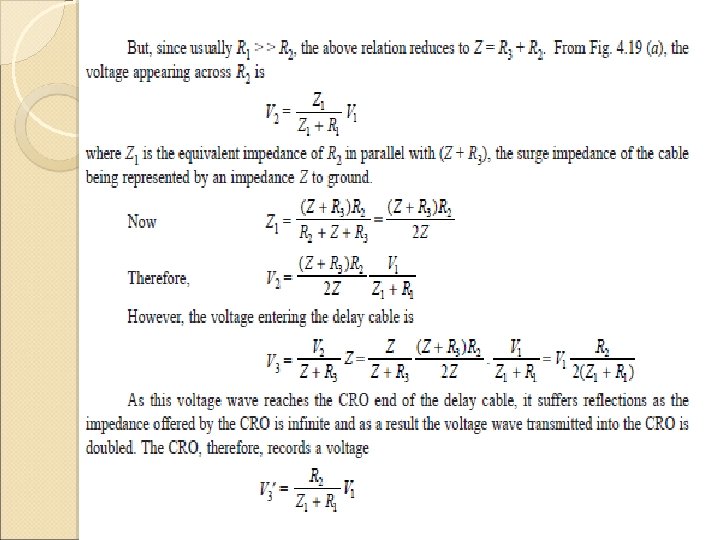
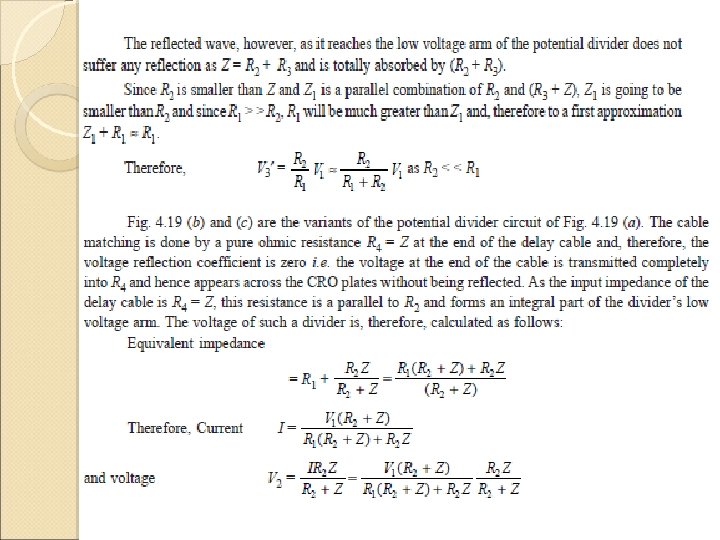
Fig. shows a common form of resistance potential divider used for testing purposes where the wave front time of the wave is less than 1 micro sec. Fig. Various forms of resistance potential dividers recording circuits (a) Matching at divider end (b) Matching at Oscillograph end (c) Matching at both ends of delay cable Here R 3, the resistance at the divider end of the delay cable is chosen such that R 2 + R 3 = Z which puts an upper limit on R 2 i. e. , R 2 < Z. In fact, sometimes the condition for matching is given as
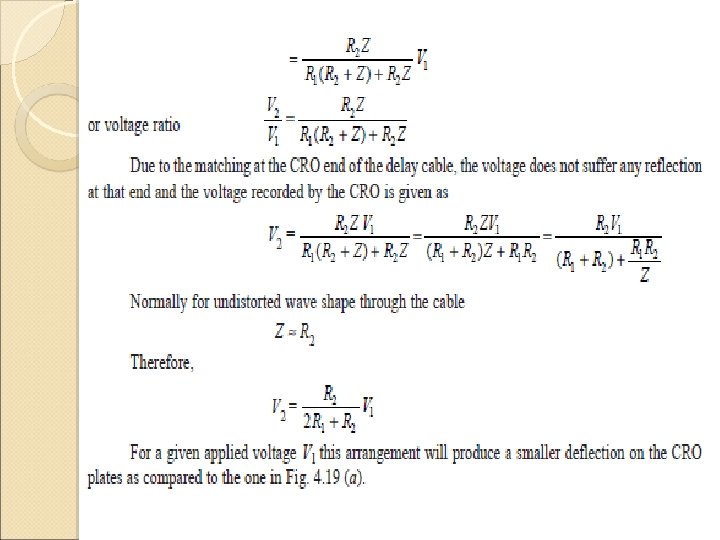
The arrangement of Fig. 4. 19 (c) provides for matching at both ends of the delay cable and is to be recommended where it is felt necessary to reduce to the minimum irregularities produced in the delay cable circuit. Since matching is provided at the CRO end of the delay cable, therefore, there is no reflection of the voltage at that end and the voltage recorded will be half of that recorded in the arrangement of Fig. 4. 19 (a) viz. It is desirable to enclose the low voltage resistance (s) of the potential dividers in a metal screening box. Steel sheet is a suitable material for this box which could be provided with a detachable close fitting lid for easy access. If there are two low voltage resistors at the divider position as in Fig. 4. 19 (a) and (c), they should be contained in the screening box, as close together as possible, with a removable metallic partition between
The partition serves two purposes : (i) it acts as an electrostatic shield between the two resistors (ii) it facilitates the changing of the resistors. The lengths of the leads should be short so that practically no inductance is contributed by these leads. The screening box should be fitted with a large earthing terminal. Fig. shows a sketched cross-section of possible layout for the low voltage arm of voltage divider.
Capacitance Potential Dividers Capacitance potential dividers are more complex than the resistance type. For measurement of impulse voltages not exceeding 1 MV capacitance dividers can be both portable and transportable. In general, for measurement of 1 MV and over, the capacitance divider is a laboratory fixture. The capacitance dividers are usually made of capacitor units mounted one above the other and bolted together. It is this feature which makes the small dividers portable. A screening box similar to that described earlier can be used for housing both the low voltage capacitor unit C 2 and the matching resistor if required. The low voltage capacitor C 2 should be non-inductive.
Capacitance Potential Dividers…. contd A form of capacitor which has given excellent results is of mica and tin foil plate, construction, each foil having connecting tags coming out at opposite corners. This ensures that the current cannot pass from the high voltage circuit to the delay cable without actually going through the foil electrodes. It is also important that the coupling between the high and low voltage arms of the divider be purely capacitive. Hence, the low voltage arm should contain one capacitor only; two or more capacitors in parallel must be avoided because of appreciable inductance that would thus be introduced. Further, the tappings to the delay cable must be taken off as close as possible to the terminals of C 2.
Fig. shows variants of capacitance potential dividers. Fig. Capacitor dividers (a) Simple matching (b) Compensated matching(c) Damped capacitor divider simple matching For voltage dividers in Fig. (b) and (c), the delay cable cannot be matched at its end. A low resistor in parallel to C 2 would load the low voltage arm of the divider too heavily and decrease the output voltage with time. Since R and Z form a potential divider and R = Z, the voltage input to the cable will be half of the voltage across the capacitor C 2.
This halved voltages travels towards the open end of the cable (CRO end) and gets doubled after reflection. That is, the voltage recorded by the CRO is equal to the voltage across the capacitor C 2. The reflected wave charges the cable to its final voltage magnitude and is absorbed by R (i. e. reflection takes place at R and since R = Z, the wave is completely absorbed as coefficient of voltage reflection is zero) as the capacitor C 2 acts as a short circuit for high frequency waves. The transformation ratio, therefore, changes from the value:
However, the capacitance of the delay cable Cd is usually small as compared with C 2. For capacitive divider an additional damping resistance is usually connected in the lead on the high voltage side as shown in Fig. (c). The performance of the divider can be improved if damping resistor which corresponds to the a periodic limiting case is inserted in series with the individual element of capacitor divider. This kind of damped capacitive divider acts for high frequencies as a resistive divider and for low frequencies as a capacitive divider. It can, therefore, be used over a wide range of frequencies i. e. for impulse voltages of very different duration and also for alternating voltages.
MEASUREMENT OF HIGH D. C. , AND IMPULSE CURRENTS High currents are used in power system for testing circuit breakers, cables lightning arresters etc. and high currents are encountered during lightning discharges, switching transients and shunt faults. These currents require special techniques for their measurements. High Direct Currents Low resistance shunts are used for measurement of these currents. The voltage drop across the shunt resistance is measured with the help of a milli-voltmeter. The value of the resistance varies usually between 10 microohm and 13 milliohm. This depends upon the heating effect and the loading permitted in the circuit. The voltage drop is limited to a few milli-volts usually less than 1 V. These resistances are oil immersed and are made as three or four terminal resistances to provide separate terminals for voltage measurement for better accuracy.
Hall Generators Hall effect is used to measure very high direct current. Whenever electric current flows through a metal plate placed in a magnetic field perpendicular to it, Lorenz force will deflect the electrons in the metal structure in a direction perpendicular to the direction of both the magnetic field and the flow of current. The charge displacement results in an e. m. f. in the perpendicular direction called the Hall voltage. The Hall voltage is proportional to the current I, the magnetic flux density B and inversely proportional to the plate thickness d i. e. , where R is the Hall coefficient which depends upon the material of the plate and temperature of the plate. For metals the Hall coefficient is very small and hence semiconductor materials are used for which the Hall coefficient is high.
When large d. c. currents are to be measured the current carrying conductor is passed through an iron cored magnetic circuit (b). The magnetic field intensity produced by the conductor in the air gap at a depth d is given by The Hall element is placed in the air gap and a small constant d. c. current is passed through the element. The voltage developed across the Hall element is measured and by using the expression for Hall voltage the flux density B is calculated and hence the value of current I is obtained.
High Power Frequency Currents High Power frequency currents are normally measured using current transformers as use of low resistance shunts involves unnecessary power loss. Besides, the current transformers provide isolation from high voltage circuits and thus it is safer to work on HV circuits. Fig. shows a scheme for high a. c current measurements using current transformers and electro-optical technique.
A voltage signal proportional to the current to be measured is produced and is transmitted to the ground through the electrooptical device. Light pulses proportional to the voltage signal are transmitted by a glass optical fibre bundle to a photo-detector and converted back into an analog voltage signal. The required power for the signal convertor and optical device are obtained from suitable current and voltage transformers.
High Frequency and Impulse Currents In power system the amplitude of currents may vary between a few amperes to a few hundred kiloamperes and the rate of rise of currents can be as high as 1010 A/sec and the rise time can vary between a few micro seconds to a few macro seconds. Therefore, the device to be used for measuring such currents should be capable of having a good frequency response over a very wide frequency band. The methods normally employed are—(i) resistive shunts; (ii) elements using induction effects; (iii) Faraday and Hall effect devices. With these methods the accuracy of measurement varies between 1 to 10%. Fig. shows the circuit diagram of the most commonly used method for high impulse current measurement.
The voltage across the shunt resistance R due to impulse current i(t) is fed to the oscilloscope through a delay cable D. The delay cable is terminated through an impedance Z equal to the surge impedance of the cable to avoid reflection of the voltage to be measured and thus true measurement of the voltage is obtained. Since the dimension of the resistive element is large, it will have residual inductance L and stray capacitance C. The inductance could be neglected at low frequencies but at higher frequencies the inductive reactance would be comparable with the resistance of the shunt. The effect of inductance and capacitance above 1 MHz usually should be considered.
The resistance values range between 10 micro ohm to a few milliohms and the voltage drop is of the order of few volts. The resistive shunts used for measurements of impulse currents of large duration is achieved only at considerable expense for thermal reasons. The resistive shunts for impulse current of short duration can be built with rise time of a few nano seconds of magnitude. The resistance element can be made of parallel carbon film resistors or low inductance wire resistors of parallel resistance wires or resistance foils. Assuming the stray capacitance to be negligibly small the voltage drop across the shunt in complex frequency domain may be written as V(s) = I(s)[R + Ls] It is to be noted that in order to have flat frequency response of the resistive element the stray inductance and capacitance associated with the element must be made as small as possible.
In order to minimise the stray field effects following designs of the resistive elements have been suggested and used 1. Bifilar flat strip shunt. 2. Co-axial tube or Park’s shunt 3. Co-axial squirrel cage shunt. The bifilar flat strip shunts suffer from stray inductance associated with the resistance element and its potential leads are linked to a small part of the magnetic flux generated by the current that is being measured. In order to eliminate the problems associated with the bifilar shunts, coaxial shunts were developed (Fig. ) Here the current enters the inner cylinder of the shunt element and returns through an outer cylinder. The space between the two cylinders is occupied by air which acts like a perfect insulator. The voltage drop across the element is measured between the potential pick up point and the outer case. The frequency response of this element is almost a flat characteristic upto about 1000 MHz and the response time is a few nanoseconds. The upper frequency limit is governed by the skin effect in the
Squirrel cage shunts are high ohmic shunts which can dissipate larger energies as compared to coaxial shunts which are unsuitable due to their limitation of heat dissipation, larger wall thickness and the skin effect. Squirrel cage shunt consists of thick metallic rods or strips placed around the periphery of a cylinder and the structure resembles the rotor construction of a double squirrel cage induction motor. The step response of the element is peaky and, therefore, a compensating network is used in conjunction with the element to improve its frequency response. Rise times less than 8 n sec and bandwidth of 400 MHz have been obtained with these shunts.
Elements using Induction Effects If the current to be measured is flowing through a conductor which is surrounded by a coil as shown in Fig. 4. 29, and M is the mutual inductance between the coil and the conductor, the voltage across the coil terminals will be: Usually the coil is wound on a non-magnetic former in the form of a toroid and has a large number of turns, to have sufficient voltage induced which could be recorded. The coil is wound criss-cross to reduce the leakage inductance. If M is the number of turns of the coil, A the coil area and lm its mean length, the mutual inductance is given by Usually an integrating circuit RC is employed as shown in Fig. 4. 29 to obtain the output voltage proportional to the current to be measured. The output voltage is given by
Integration of v(t) can be carried out more elegantly by using an appropriately wired operational amplifier. The frequency response of the Rogowski coil is flat upto 100 MHz but beyond that it is affected by the stray electric and magnetic fields and also by the skin effect.
Magnetic Links These are used for the measurement of peak magnitude of the current flowing in a conductor. These links consist of a small number of short steel strips on high retentivity. The link is mounted at a known distance from the current carrying conductor. It has been found through experiments that the remanant magnetism of the link after impulse current of 0. 5/5 micro sec shape passes through the conductor is same as that caused by a direct current of the same peak value. Measurement of the remanance possessed by the link after the impulse current has passed through the conductor enables to calculate the peak value of the current. For accurate measurements, it is usual to mount two or more links at different distances from the same conductor. Because of its relative simplicity, the method has been used for measurement of lightning current especially on transmission towers.
It is to be noted that the magnetic links help in recording the peak value of the impulse current but gives no information regarding the wave shape of the current. For this purpose, an instrument called Fulcronograph has been developed which consists of an aluminium wheel round the rim of which are slots containing magnetic links of sufficient length to project on both sides of the wheel. As the wheel is rotated, the links pass successively through a pair of narrow coils through which flows the current to be measured. The current at the instant during which a particular link traverses the coil, can be determined by a subsequent measurement of the residual flux in the link and, therefore, a curve relating the variation of current with time can be obtained. The time scale is governed by the speed of rotation of the wheel.
Hall Generators The high amplitude a. c. and impulse currents can be measured by Hall Generator described earlier. For the Hall Generator, though a constant control current flows which is permeated by the magnetic field of the current to be measured, the Hall voltage is directly proportional to the measuring current. This method became popular with the development of semiconductor with sufficient high value of Hall constant. The band width of such devices is found to be about 50 MHz with suitable compensating devices and feedback.
Faraday Generator or Magneto Optic Method These methods of current measurement use the rotation of the plane of polarisation in materials by the magnetic field which is proportional to the current (Faraday effect). When a linearly polarised light beam passes through a transparent crystal in the presence of a magnetic field, the plane of polarisation of the light beam undergoes relation. The angle of rotation is given by θ = α Bl where α = A constant of the cyrstal which is a function of the wave length of the light. B = Magnetic flux density due to the current to be measured in this case. l = Length of the crystal.
MAGNETO OPTICAL METHOD
Fig. 4. 30 shows a schematic diagram of Magneto-optic method. Crystal C is placed parallel to the magnetic field produced by the current to be measured. A beam of light from a stabilised light source is made incident on the crystal C after it is passed through the polariser P 1. The light beam undergoes rotation of its plane of polarisation. After the beam passes through the analyser P 2, the beam is focussed on a photomultiplier, the output of which is fed to a CRO. The filter F allows only the monochromatic light to pass through it. Photoluminescent diodes too, the momentary light emission of which is proportional to the current flowing through them, can be used for current measurement. The following are the advantages of the method (i) It provides isolation of the measuring set up from the main current circuit. (ii) It is insensitive to overloading. (iii) As the signal transmission is through an optical system no insulation problem is faced. However, this device does not operate for d. c. current.