HV detector PMT filters PMT capillary laser beam
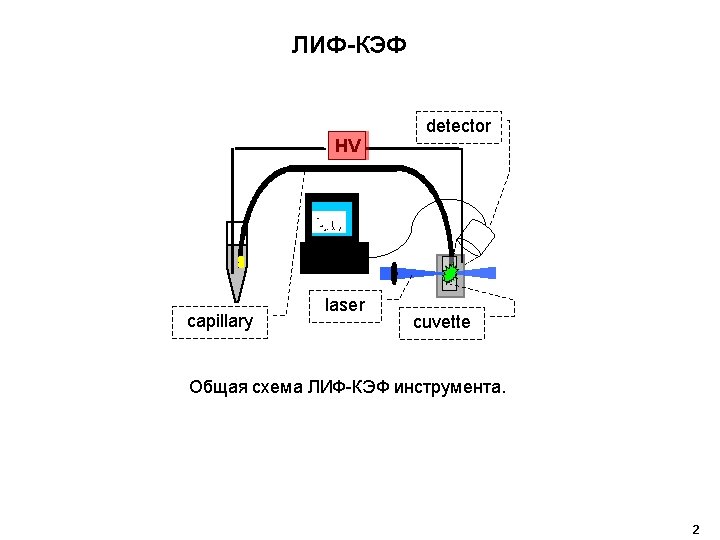
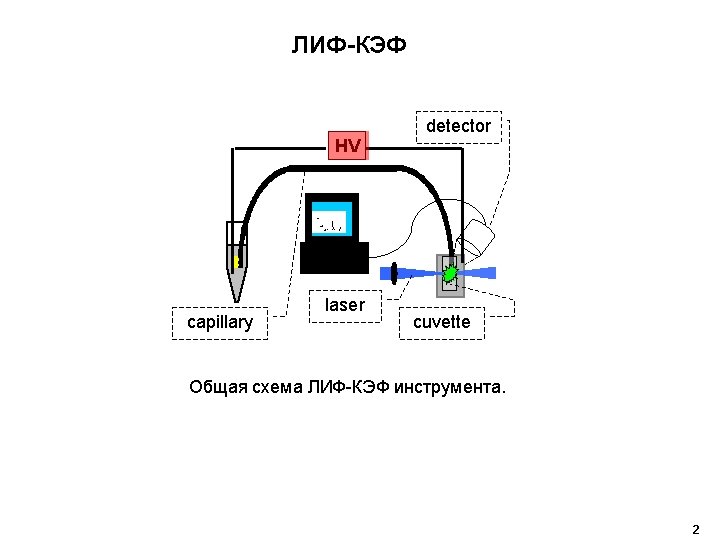

HV detector PMT filters PMT capillary laser beam splitter cuvette pinhole cuvette 3
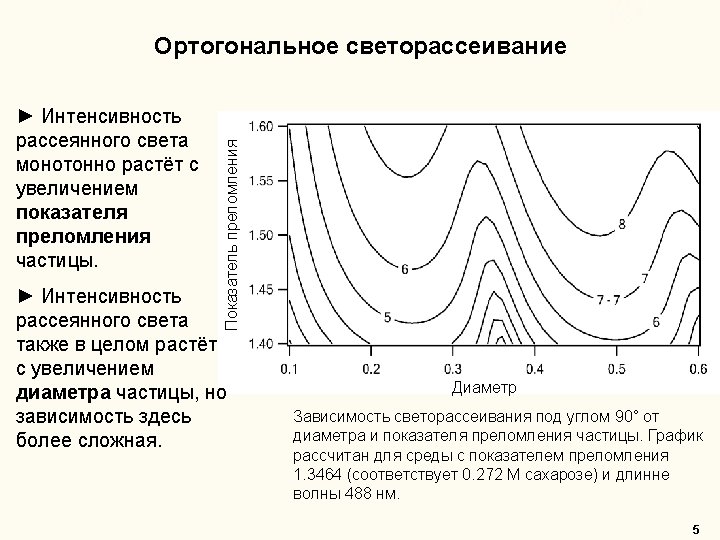

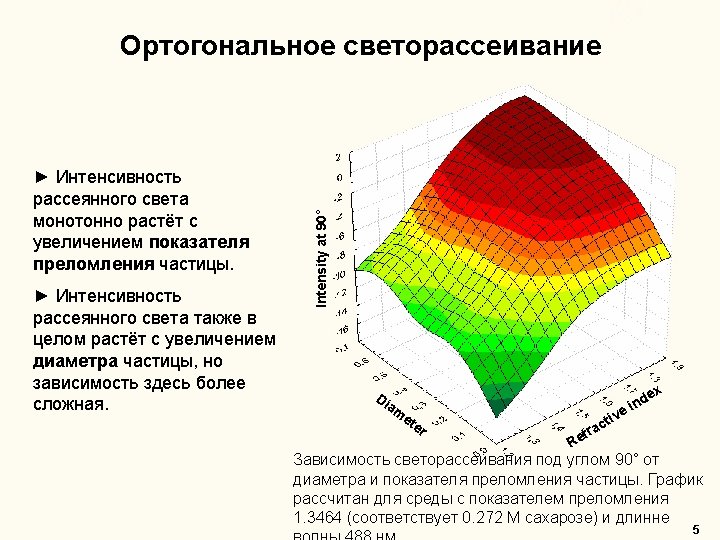
Extraction of scattering signal ► Scattering detection alone does not provide sufficient selectivity for detection of sub-micron particles in CE ► It is possible to employ the fluorescence signal to identify the scattering response of the analyte particles CE-LIF/LS analysis of Alexa-488 labeled polystyrene microspheres. Top trace: scattering, ~10500 peaks; bottom trace: fluorescence, ~1500 peaks. 6
 Andreyev, D. S. , Arriaga E. A. , Analytical")
“Peaks and Waves” software (1) Andreyev, D. S. , Arriaga E. A. , Analytical Chemistry 2007, 79/14: 5474 (2) Ahmadzadeh, H. , Andreyev, D. S. , Arriaga, E. A. , Thompson, L. V. , Journal of Gerontology 2006 61 A/12: 1211 (3) Johnson R. D. , Navratil M. , Poe B. G. , Xiong G. , Olson K. J. , Ahmadzadeh H. , Andreyev D. S. , Duffy C. F. , Arriaga A. E. , Analytical and Bioanalytical Chemistry (2007) 387: 107 7
 plot. scattering fluorescence Electropherogram")
Electropherogram. Fluorescence vs. scattering Electropherogram of polystyrene microspheres mixture. (FVS) plot. scattering fluorescence Electropherogram of fluorescently-labeled polystyrene beads with diameters of 500 and 1000 nm (separation by 300 V/cm field, 10 m. M HEPES buffer p. H 7. 4). A total of 1500 events have matching migration times in both detectors and form Beginning of migration time window. three well defined subgroups in the FVS plot. 8

CE-LIF/LS analysis of polystyrene microspheres A B C Left: The FVS plot. Right: Migration time histograms for each group no FVS plot. Group A attributed to 1 µm microspheres; group B attributed to 500 nm microspheres; group C attributed to Three particle’s debris. groups are observed. Fluorescence and vs. scattering (FVS) plot. well-distinct Dmitry S. Andreyev and Edgar A. Arriaga, Analytical Chemistry 2007, 79(14), 5474 -5478 9

Mitochondria: subtle effects of cryogenic damage TEM of osmium – contrasted, polymer-embedded mitochondrial samples. Left: freshly prepared mitochondria. Right: mitochondria after storage in liquid nitrogen. 10

Mitochondria: subtle effects of cryogenic damage Higher magnification TEM of osmium – contrasted, polymer-embedded mitochondrial samples. Left: freshly prepared mitochondria. Right: mitochondria after storage in liquid nitrogen. 11
")
CE-LIF/LS analysis reveals cryogenic damage to mitochondrial membranes FVS plots of freshly prepared (left) and cryogenically stored (right) mitochondria, stained with 10 m. M NAO. The drastic difference in the observed patterns allows to distinguish damaged and intact mitochondrial samples Andreyev, D. S. , Arriaga E. A. , Analytical Chemistry 2007, 79/14: 5474 12

Introduction of polarizer into the detector may split the patterns on FVS/SVS plots. filter set without polarizer filter set with polarizer Polystyrene microspheres show two distinct subpopulations when polarization of light is taken into account. The simplest explanation is presence for two kinds of microspheres in the sample, each affecting the light polarization differently. 13


Further development of LIF-LS detector ► Single-angle light scattering signals depends on both refractive index and size of particles, hence neither can be directly determined. ►Ratio of light scattering signals, collected at different angles, nearly completely depends on size of particles only. laser pinhole objective optical filters P M T beam splitter Diameter pinhole block lenses CCD Left: Dependence of ratio of light scattering intensities at 30° and 15° from diameter and refractive index of a particle. Right: The scheme of the multi-angle LIF/LS detector (in development). 15

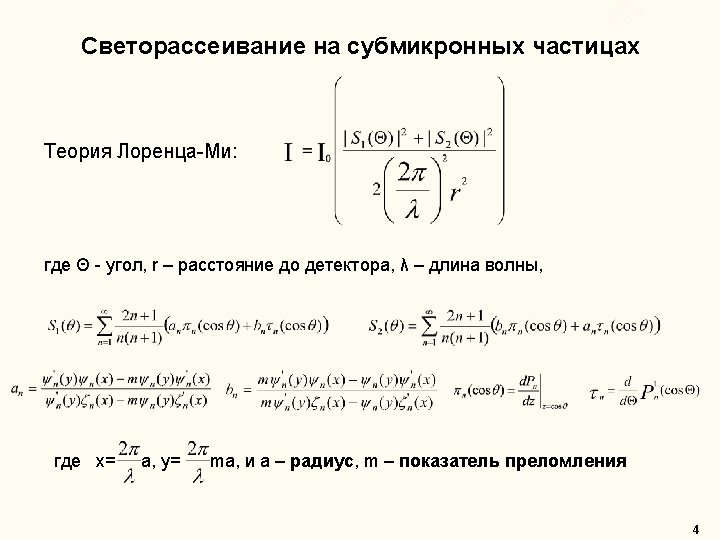
Rayleigh-Gans-Debye theory: np – independent - good for metal nanoparticles - not good for mitochondria Lorenz-Mie theory is accurate for spherical, homogenious non-magnetic particle immersed in isotropic, homogenious, nonconducting media. - partially usable for mitochondria.
 detector. Capillary Shear flow buffer P M T 1 Fluorescence filter")
Laser-induced fluorescence/scattering (LIF/LIS) detector. Capillary Shear flow buffer P M T 1 Fluorescence filter set P M T 2 Beam splitter Laser focusing objective Scattering filter set Pinhole Signal collecting objective

Dual channel LIF&LIS detection of polystyrene microspheres. scattering total, 32838 events fluorescence from analyte, 48 events scattering from analyte, 48 events Probability of single coincidence (false positive) = 2. 9*10 -5.

CE-LIS detection of silica-encapsulated silver particles 50 nm TEM Ag/Si. O 2 Capillary length 40 cm, inner Ǿ 50μm, separation voltage 200 V/cm. 10 m. M phosphate, p. H 11. Sample injection: 20 s X 200 V/cm, Amax= 0. 1 at 415 nm. Shear flow h=5 cm, 488 NB 3 and neutral density filters in front of PMT.

Artifacts caused by detector alignment capillary end focused laser beam I 1 focused detector I 2 unfocused laser beam I 1 unfocused detector I 2

FVS plots for different alignments focused defocused Left: the detected events form straight or slightly curved line – trajectory deviations from optimum affect signals in both channels strongly, but either equally (straight line) or very similarly (slightly curved line). Right: the evens form compact, nearly circular main group and the secondary group of fewer events, possibly corresponding to detection of two particles together.

A C B D
 plot. window.")
Electropherogram. of Fluorescence polystyrene microspheres vs. scattering mixture. Beginning of migration (FVS) plot. window. scattering fluorescence Electropherogram of fluorescently-labeled polystyrene beads with diameters of 500 and 1000 nm (separation by 300 V/cm field, 10 m. M HEPES buffer p. H 7. 4). A total of 1500 events have matching migration times in both detectors and form Beginning of migration time window. three well defined subgroups in the FVS plot.

FVS plot and analysis of the electropherogram A B C Left: Fluorescence vs. scattering (FVS) plot. Three well-distinct groups are observed. Right: A - migration time histogram for the subpopulation of 500 nm particles from FVS plot. B - the same histogram for 1 microngroups particles. - the Fluorescence vs. scattering (FVS) plot. Three well-distinct are C observed. same histogram, attributed particle’s debris.
- Slides: 27