Hurricanes Chapter 16 Hurricane CrossSection eye wall Hurricane
")


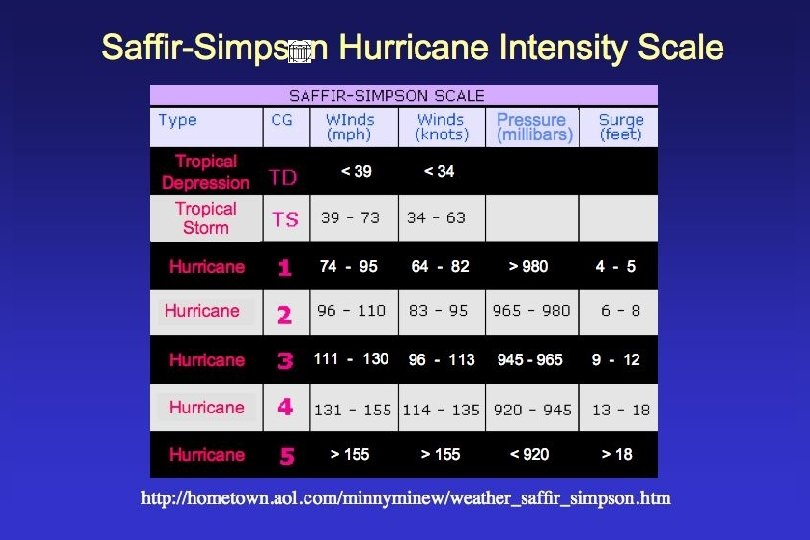
 2. Tropical Depression 3. Tropical")


 1992")
 from Tropical Cyclones Knight and Davis, 2007")


")


 An Upward")
 No change")
- Slides: 34
Hurricanes! (Chapter 16)
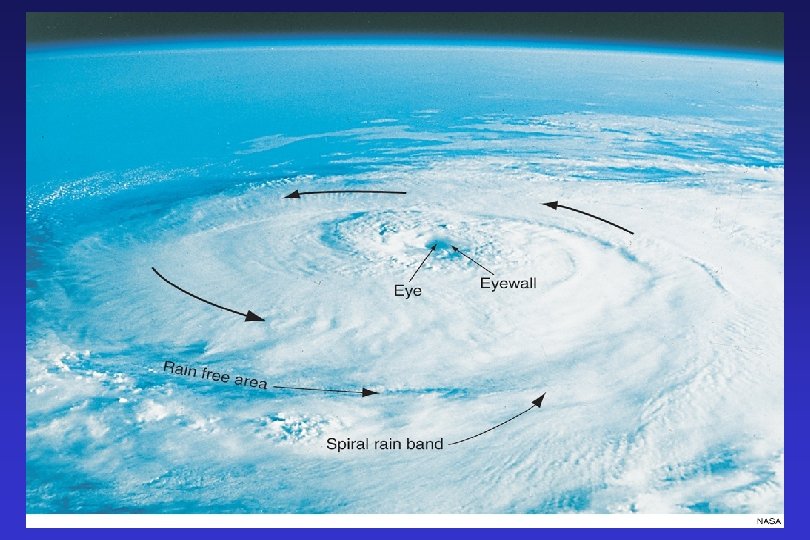
Hurricane Cross-Section
eye wall Hurricane Cross-Section eye
Hurricane Katrina’s Eye Wall
Hurricane Katrina Rain Rate Estimates
Hurricane Dora Wind Speed and Direction
Progression of Tropical Events 1. Easterly Wave (Tropical Disturbance) 2. Tropical Depression 3. Tropical Storm 4. Hurricane 10 -25% 50 -60%
Easterly Wave low pressure trough moving east to west
Tropical Storm Hurricane Tropical Disturbance
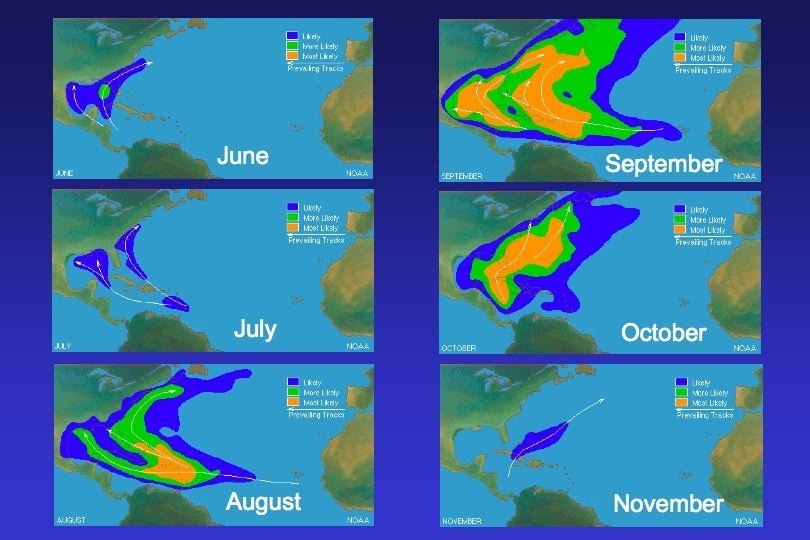
Regional Hurricane Names and Typical Tracks
Tropical Cyclones and Sea-Surface Temperatures Tropical Cyclone Fixes 80°F Water Temperature June/July August September
Atlantic Hurricane Frequency by Date
Hurricane Georges
Atlantic Basin Hurricane Satellite Loops 2005 season https: //www. youtube. com/watch? v=v. B_K e. Km. MOYA (start at 3: 30) 2010 season http: //www. youtube. com/watch? v=ual 22 z n. KM 10&feature=related (Igor, 2: 40)
Regional Hurricane Names and Typical Tracks H H
GLOBAL TROPICAL CYCLONES 1985– 2005
COASTAL HURRICANE VULNERABILITY > 50 years between landfall < 20 years # years between hurricanes # years between major hurricanes
Damage • Wind • Tornadoes • Flooding Storm Surge
Hurricane Storm Surge
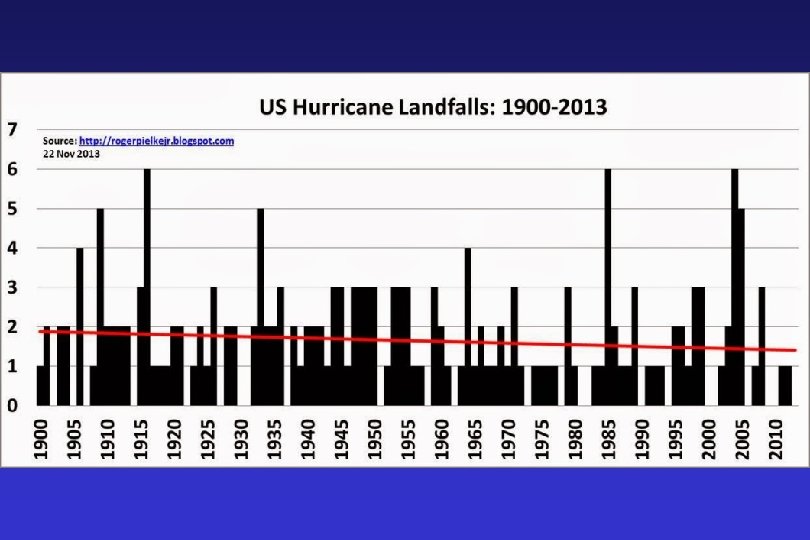
# U. S. Landfalling Hurricanes, 1901– 2013 1935 Florida Keys 1969 Camille (Biloxi) 1992 Andrew (Miami)
% Rainfall (May-Nov) from Tropical Cyclones Knight and Davis, 2007
ANNUAL NUMBER OF NORTH ATLANTIC TROPICAL CYCLONES When do the storm counts become reliable?
Global Hurricanes: 1971– 2017
Hurricane Development Factors • High Water Temperatures • Unstable lower atmosphere Cool up • Moisture convergence at surface Warm L • Lack of vertical wind shear up Wind
Deadliest U. S. Hurricanes, 1880– 2010 (Blake et al. , 2011)
Costliest U. S. Hurricanes 1900– 2017 (Blake et al. , 2011 with updates; damages not inflation-adjusted)
Costliest U. S. Hurricanes 1900– 2017 (Blake et al. , 2011 with updates; adjusted to 2017 dollars)
U. S. Total Losses per Year from Atlantic Tropical Cyclones (1900– 2005) An Upward Trend? (Source: Pielke Jr. , R. , 2006, Oceanography, 19, 138 -147)
Normalized U. S. Losses per Year from Atlantic Tropical Cyclones (1900– 2005) No change when population demographics are properly considered (Source: Pielke Jr. , R. , 2006, Oceanography, 19, 138 -147)