
Human Resource Workforce Analysis Report for the Private
- Slides: 31
Human Resource & Workforce Analysis Report for the Private Club Industry August 17, 2017
Presentation Overview • Club Benchmarking Mission • Comments on Survey and Report Methodology • What We Have Learned • Executive Summary • Overview of Human Resource Expense • Overview of Payroll Taxes and Benefits • Individual Position Benchmarks • Discussion
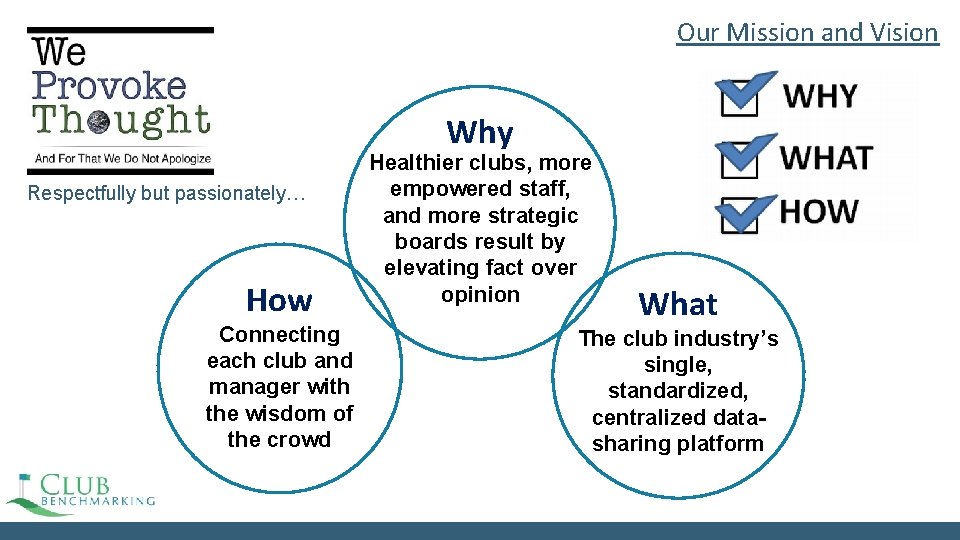
Our Mission and Vision Why Respectfully but passionately… How Connecting each club and manager with the wisdom of the crowd Healthier clubs, more empowered staff, and more strategic boards result by elevating fact over opinion What The club industry’s single, standardized, centralized datasharing platform
Comments on Survey and Report Methodology • Benefits of new Compensation & Benefits Analysis • The most up to data compensation ranges • Year-over-year trend analysis in staffing, benefits and wages • Strategic look at how staff are allocated throughout the club • More transparent, easier to interpret information
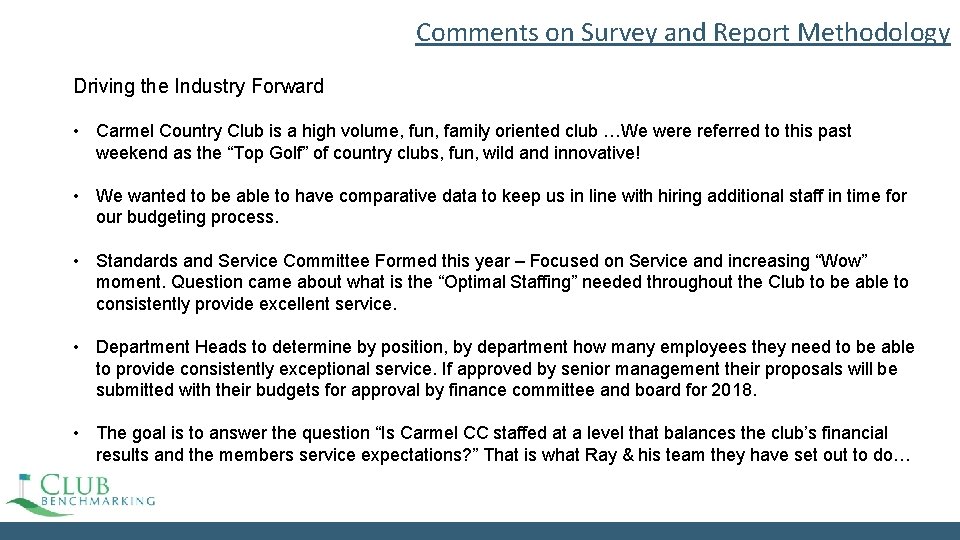
Comments on Survey and Report Methodology Driving the Industry Forward • Carmel Country Club is a high volume, fun, family oriented club …We were referred to this past weekend as the “Top Golf” of country clubs, fun, wild and innovative! • We wanted to be able to have comparative data to keep us in line with hiring additional staff in time for our budgeting process. • Standards and Service Committee Formed this year – Focused on Service and increasing “Wow” moment. Question came about what is the “Optimal Staffing” needed throughout the Club to be able to consistently provide excellent service. • Department Heads to determine by position, by department how many employees they need to be able to provide consistently exceptional service. If approved by senior management their proposals will be submitted with their budgets for approval by finance committee and board for 2018. • The goal is to answer the question “Is Carmel CC staffed at a level that balances the club’s financial results and the members service expectations? ” That is what Ray & his team they have set out to do…
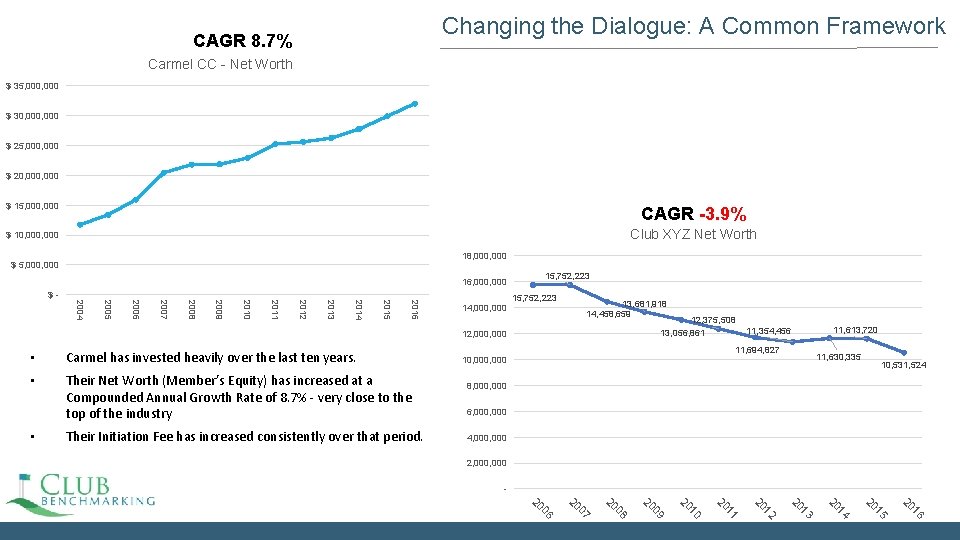
Changing the Dialogue: A Common Framework CAGR 8. 7% Carmel CC - Net Worth $ 35, 000 $ 30, 000 $ 25, 000 $ 20, 000 $ 15, 000 CAGR -3. 9% $ 10, 000 Club XYZ Net Worth 18, 000 $ 5, 000 16, 000 $ - 15, 752, 223 2016 2015 2014 2013 2012 2011 2010 2009 2008 2007 2006 2005 2004 15, 752, 223 14, 000 13, 681, 918 14, 458, 659 12, 375, 508 11, 354, 456 13, 056, 861 12, 000 • Carmel has invested heavily over the last ten years. • Their Net Worth (Member’s Equity) has increased at a Compounded Annual Growth Rate of 8. 7% - very close to the top of the industry • Their Initiation Fee has increased consistently over that period. 11, 694, 827 10, 000 11, 613, 720 11, 630, 335 10, 531, 524 8, 000 6, 000 4, 000 2, 000 - 6 1 20 5 1 20 14 20 13 20 12 20 11 20 10 20 09 20 08 20 07 20 06 20
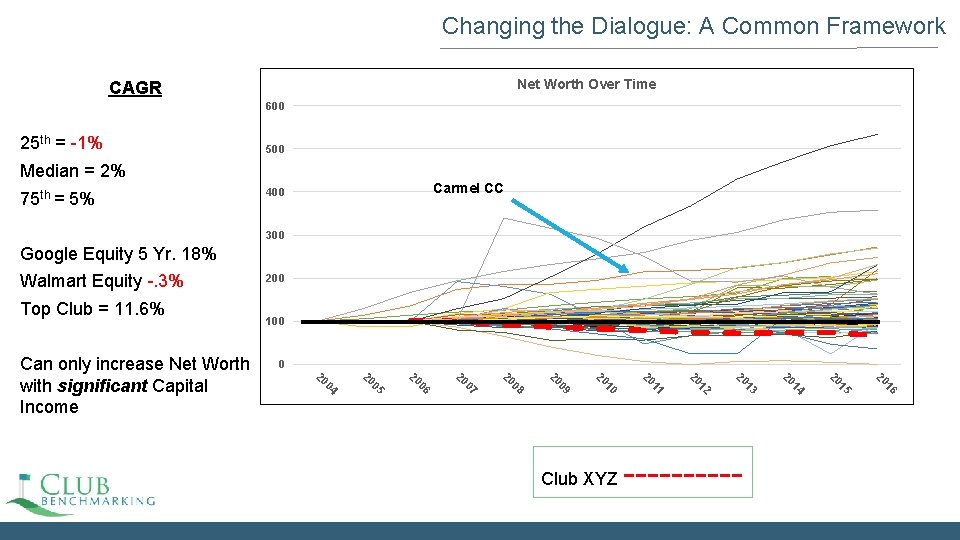
Changing the Dialogue: A Common Framework Net Worth Over Time CAGR 600 25 th = -1% 500 Median = 2% 75 th = 5% Carmel CC 400 300 Google Equity 5 Yr. 18% Walmart Equity -. 3% Top Club = 11. 6% 100 0 6 1 20 5 1 20 14 20 ----- 3 1 20 12 20 1 Club XYZ 1 20 0 1 20 9 0 20 8 0 20 07 20 6 0 20 5 0 20 4 0 20 Can only increase Net Worth with significant Capital Income 200
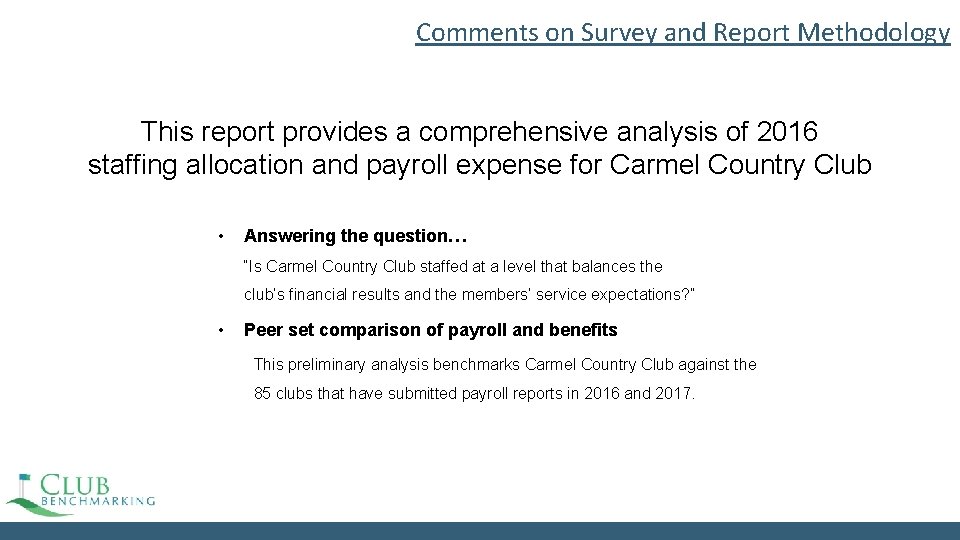
Comments on Survey and Report Methodology This report provides a comprehensive analysis of 2016 staffing allocation and payroll expense for Carmel Country Club • Answering the question… “Is Carmel Country Club staffed at a level that balances the club’s financial results and the members’ service expectations? ” • Peer set comparison of payroll and benefits This preliminary analysis benchmarks Carmel Country Club against the 85 clubs that have submitted payroll reports in 2016 and 2017.
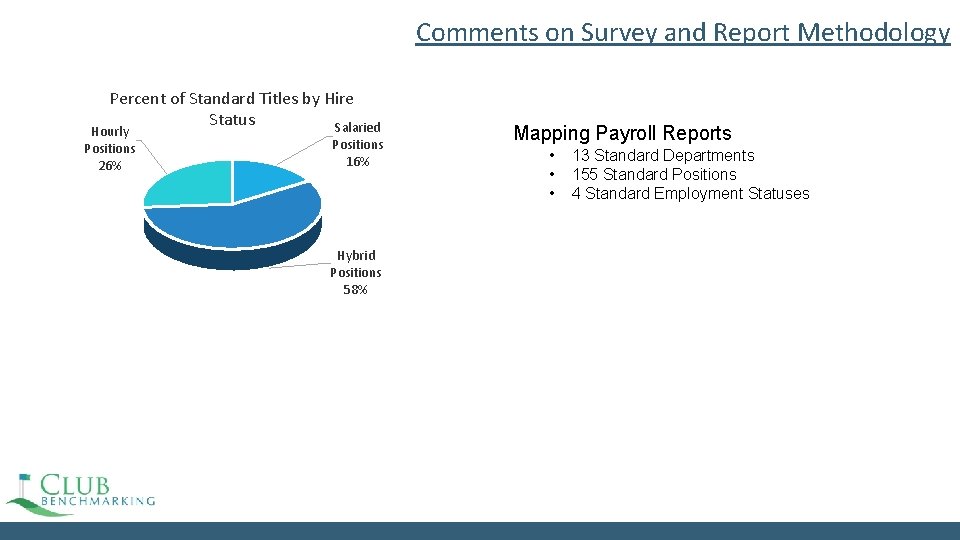
Comments on Survey and Report Methodology Percent of Standard Titles by Hire Status Salaried Hourly Positions 26% Positions 16% Hybrid Positions 58% Mapping Payroll Reports • • • 13 Standard Departments 155 Standard Positions 4 Standard Employment Statuses
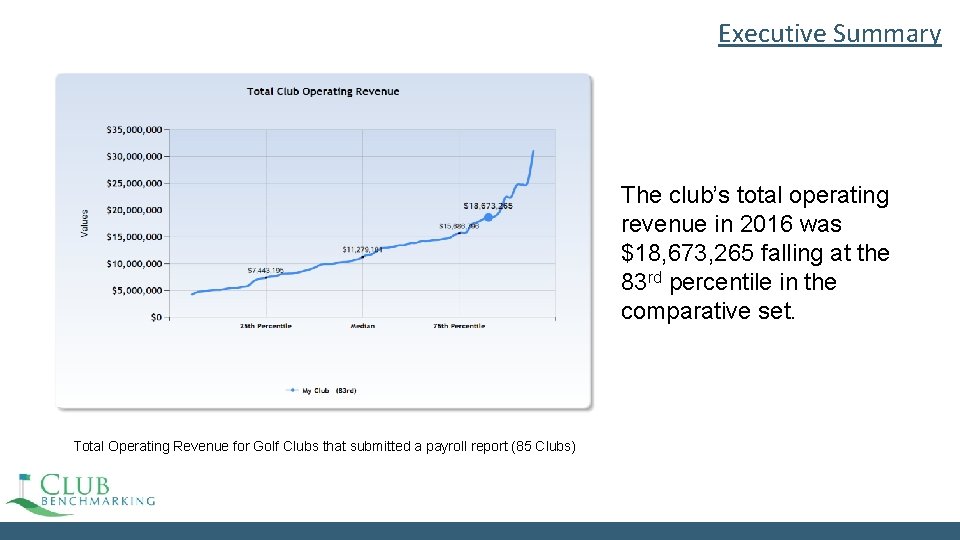
Executive Summary The club’s total operating revenue in 2016 was $18, 673, 265 falling at the 83 rd percentile in the comparative set. Total Operating Revenue for Golf Clubs that submitted a payroll report (85 Clubs)
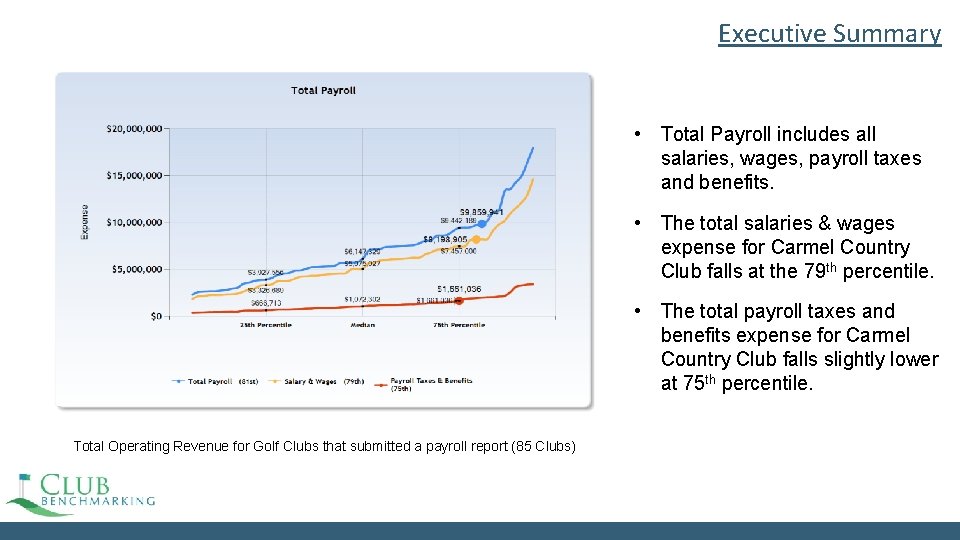
Executive Summary • Total Payroll includes all salaries, wages, payroll taxes and benefits. • The total salaries & wages expense for Carmel Country Club falls at the 79 th percentile. • The total payroll taxes and benefits expense for Carmel Country Club falls slightly lower at 75 th percentile. Total Operating Revenue for Golf Clubs that submitted a payroll report (85 Clubs)
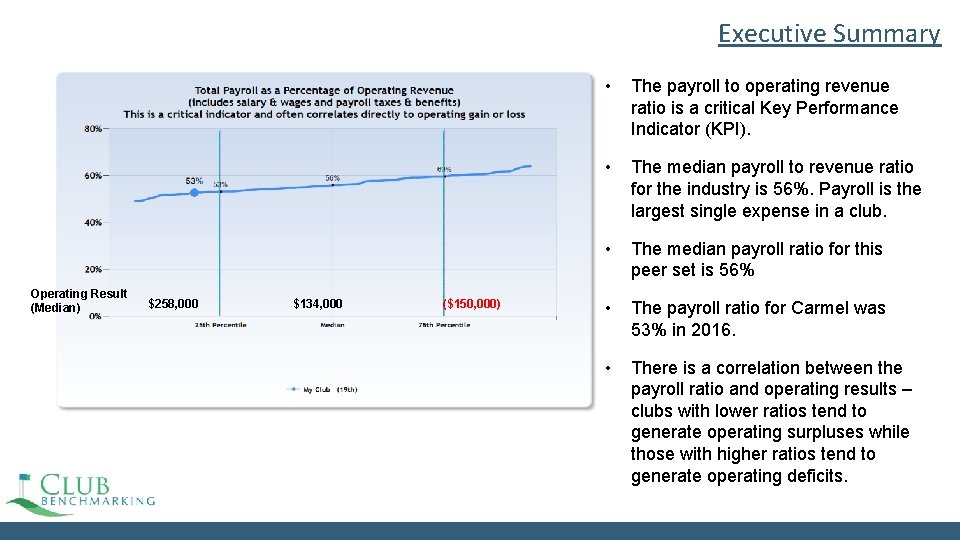
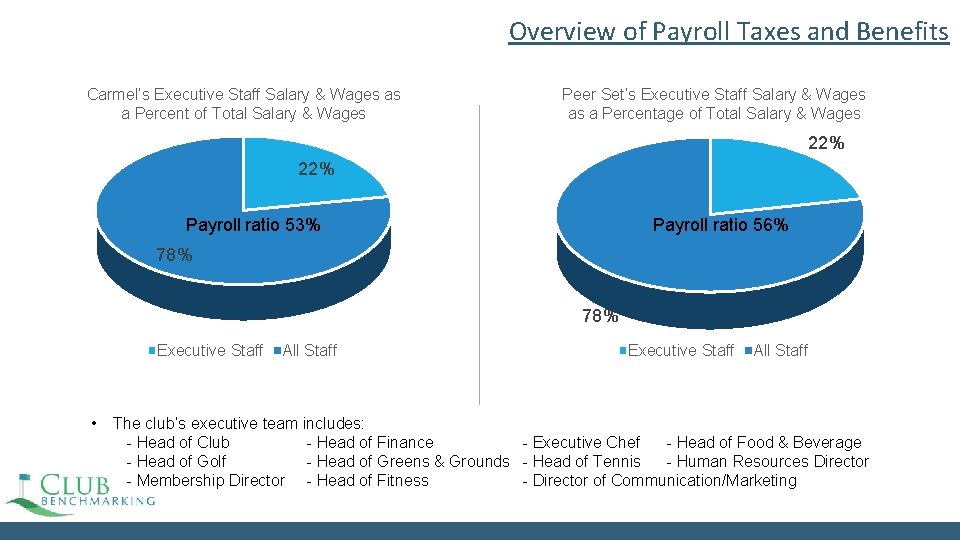
Executive Summary Operating Result (Median) $258, 000 $134, 000 ($150, 000) • The payroll to operating revenue ratio is a critical Key Performance Indicator (KPI). • The median payroll to revenue ratio for the industry is 56%. Payroll is the largest single expense in a club. • The median payroll ratio for this peer set is 56% • The payroll ratio for Carmel was 53% in 2016. • There is a correlation between the payroll ratio and operating results – clubs with lower ratios tend to generate operating surpluses while those with higher ratios tend to generate operating deficits.
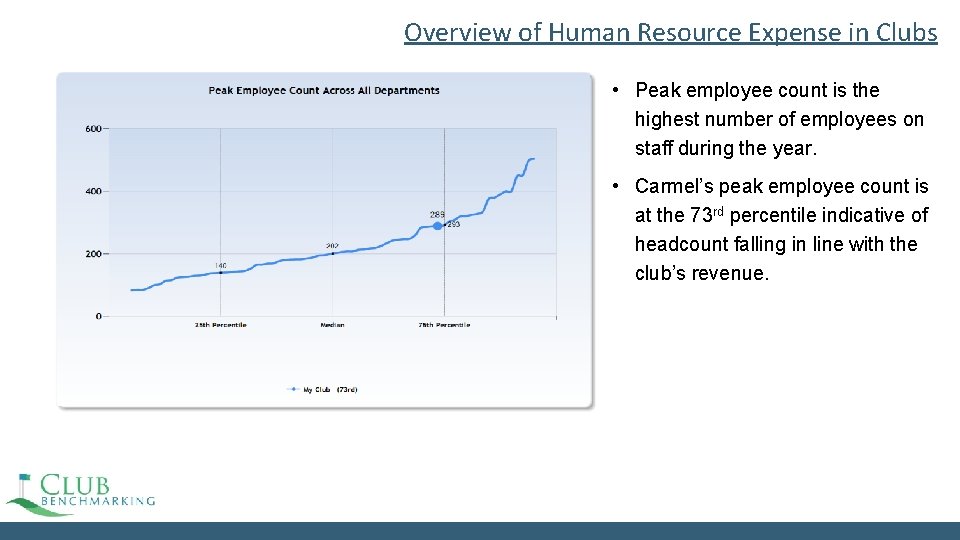
Overview of Human Resource Expense in Clubs • Peak employee count is the highest number of employees on staff during the year. • Carmel’s peak employee count is at the 73 rd percentile indicative of headcount falling in line with the club’s revenue.
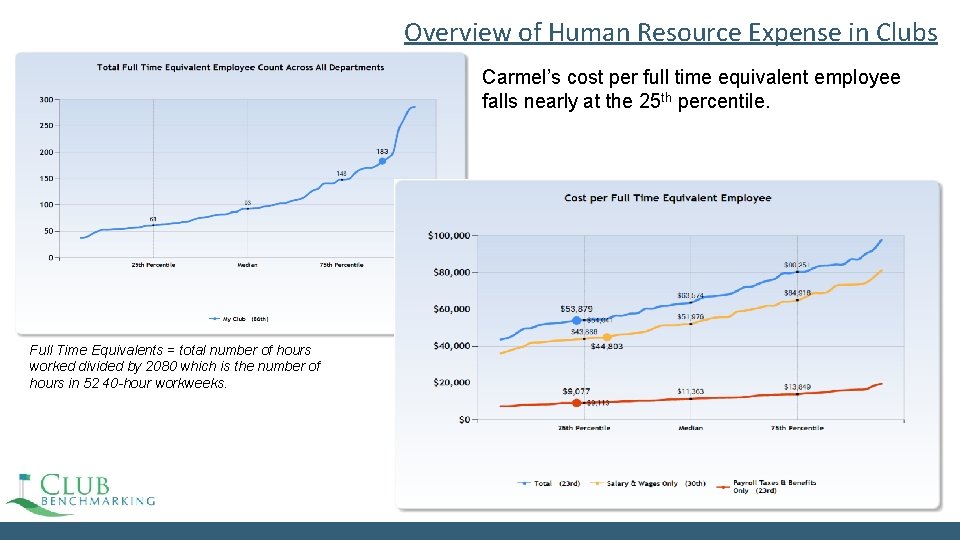
Overview of Human Resource Expense in Clubs Carmel’s cost per full time equivalent employee falls nearly at the 25 th percentile. Full Time Equivalents = total number of hours worked divided by 2080 which is the number of hours in 52 40 -hour workweeks.
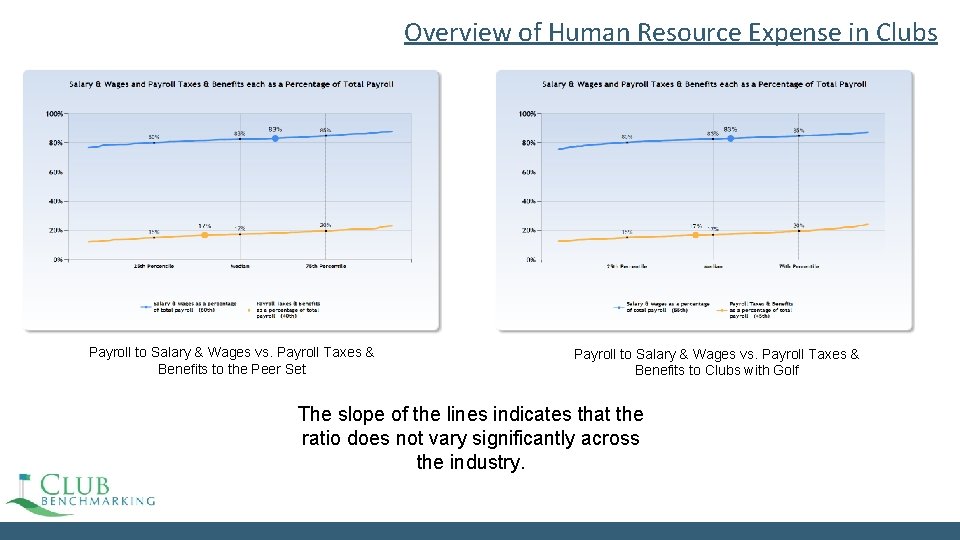
Overview of Human Resource Expense in Clubs Payroll to Salary & Wages vs. Payroll Taxes & Benefits to the Peer Set Payroll to Salary & Wages vs. Payroll Taxes & Benefits to Clubs with Golf The slope of the lines indicates that the ratio does not vary significantly across the industry.
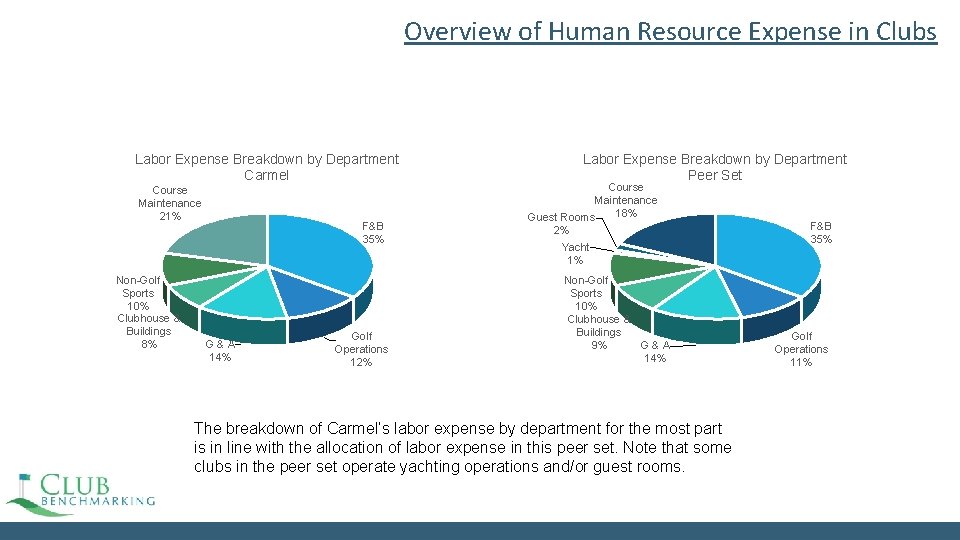
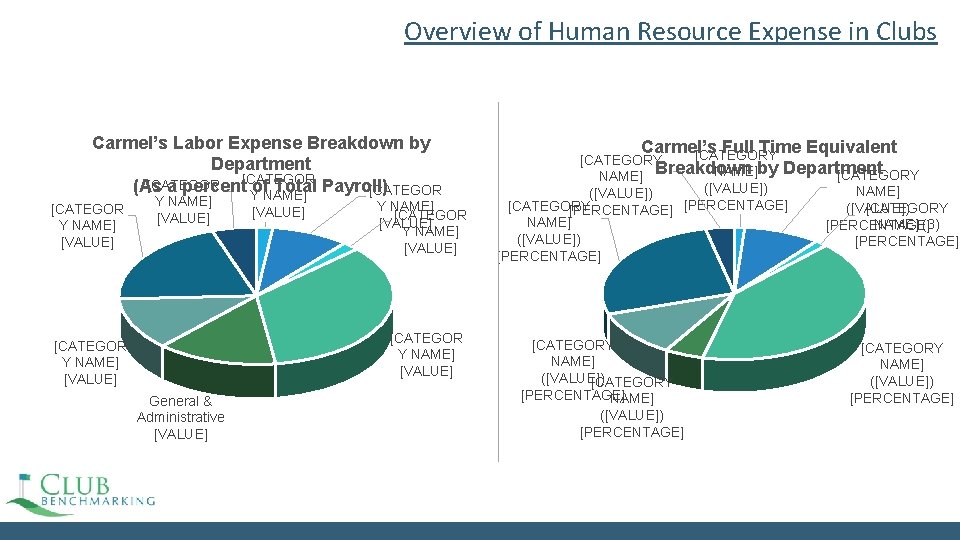
Overview of Human Resource Expense in Clubs Labor Expense Breakdown by Department Carmel Course Maintenance 21% Non-Golf Sports 10% Clubhouse & Buildings 8% F&B 35% G & A 14% Golf Operations 12% Labor Expense Breakdown by Department Peer Set Course Maintenance 18% Guest Rooms 2% Yacht 1% Non-Golf Sports 10% Clubhouse & Buildings G & A 9% 14% The breakdown of Carmel’s labor expense by department for the most part is in line with the allocation of labor expense in this peer set. Note that some clubs in the peer set operate yachting operations and/or guest rooms. F&B 35% Golf Operations 11%
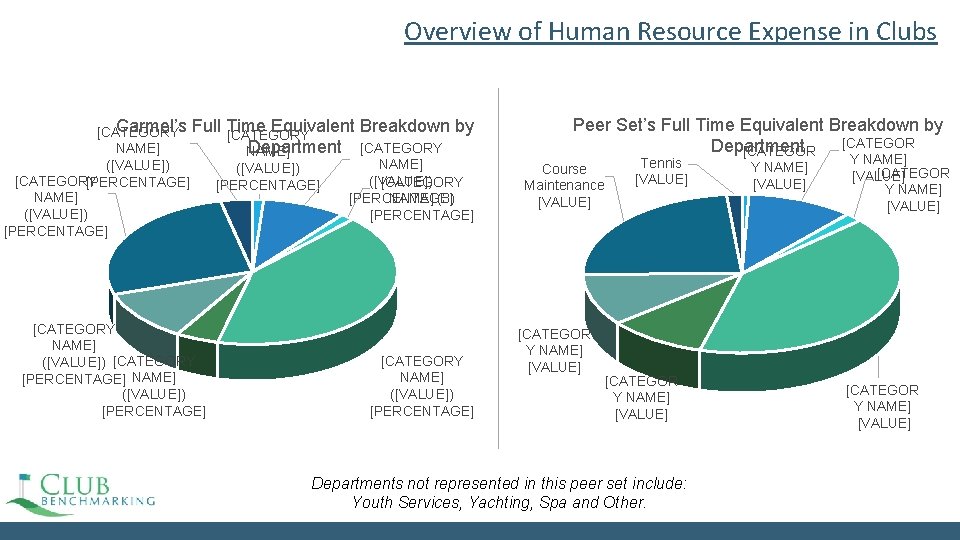
Overview of Human Resource Expense in Clubs Carmel’s Full Time Equivalent Breakdown by [CATEGORY Department [CATEGORY NAME] ([VALUE]) [CATEGORY [PERCENTAGE] NAME] (3) ([VALUE]) [PERCENTAGE] [CATEGORY NAME] ([VALUE]) [CATEGORY [PERCENTAGE] NAME] ([VALUE]) [PERCENTAGE] [CATEGORY NAME] ([VALUE]) [PERCENTAGE] Peer Set’s Full Time Equivalent Breakdown by [CATEGOR Department [CATEGOR Course Maintenance [VALUE] [CATEGOR Y NAME] [VALUE] Tennis [VALUE] [CATEGOR Y NAME] [VALUE] Departments not represented in this peer set include: Youth Services, Yachting, Spa and Other. Y NAME] [VALUE] Y NAME] [CATEGOR [VALUE] Y NAME] [VALUE] [CATEGOR Y NAME] [VALUE]
Overview of Human Resource Expense in Clubs Carmel’s Labor Expense Breakdown by Department [CATEGOR (As a percent[CATEGOR of Total Payroll) [CATEGOR Y NAME] [VALUE] Y NAME] [CATEGOR [VALUE] Y NAME] [VALUE] [CATEGOR Y NAME] [VALUE] General & Administrative [VALUE] Carmel’s Full Time Equivalent [CATEGORY Breakdown NAME] by Department [CATEGORY NAME] ([VALUE]) [PERCENTAGE] [CATEGORY ([VALUE]) [PERCENTAGE] NAME] (3) [PERCENTAGE] ([VALUE]) [PERCENTAGE] [CATEGORY NAME] ([VALUE]) [CATEGORY [PERCENTAGE] NAME] ([VALUE]) [PERCENTAGE] [CATEGORY NAME] ([VALUE]) [PERCENTAGE]
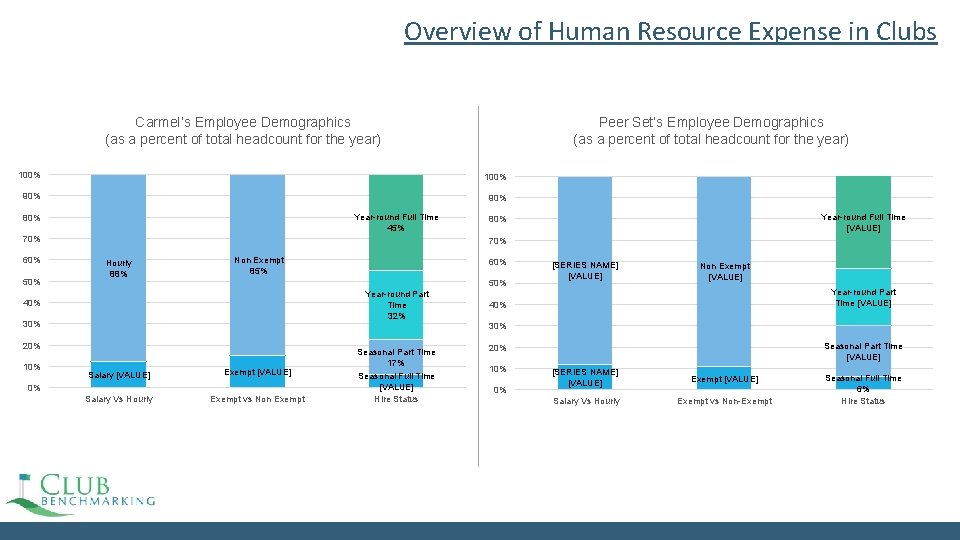
Overview of Human Resource Expense in Clubs Carmel’s Employee Demographics (as a percent of total headcount for the year) Peer Set’s Employee Demographics (as a percent of total headcount for the year) 100% 90% Year-round Full Time 45% 80% 70% 60% 50% 70% Hourly 88% Non Exempt 85% 60% 50% Year-round Part Time 32% 40% 30% [SERIES NAME] [VALUE] Non Exempt [VALUE] Year-round Part Time [VALUE] 40% 30% 20% 10% Year-round Full Time [VALUE] 80% Salary [VALUE] Exempt [VALUE] 0% Salary Vs Hourly Exempt vs Non Exempt Seasonal Part Time 17% Seasonal Full Time [VALUE] Hire Status Seasonal Part Time [VALUE] 20% 10% 0% [SERIES NAME] [VALUE] Exempt [VALUE] Salary Vs Hourly Exempt vs Non-Exempt Seasonal Full Time 6% Hire Status
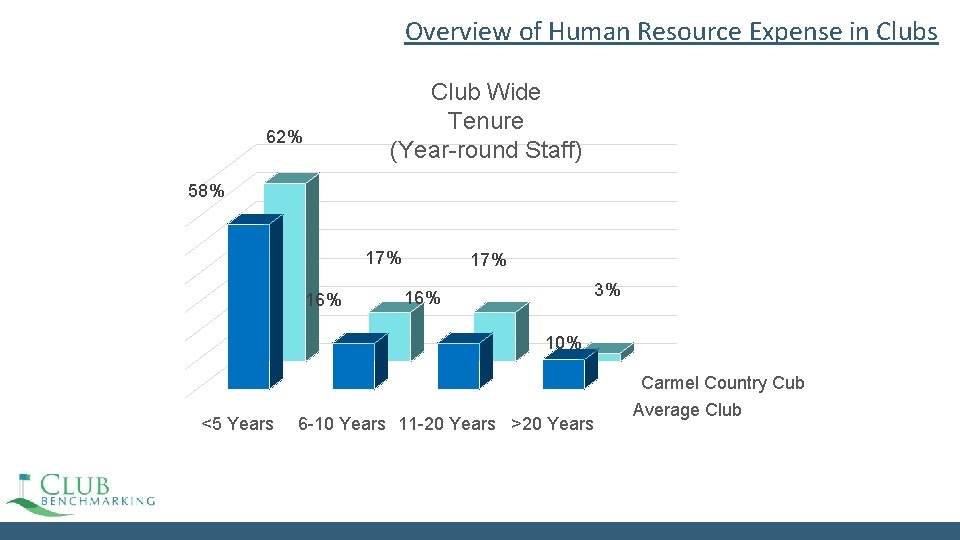
Overview of Human Resource Expense in Clubs Club Wide Tenure (Year-round Staff) 62% 58% 17% 16% 17% 3% 16% 10% <5 Years 6 -10 Years 11 -20 Years >20 Years Carmel Country Cub Average Club
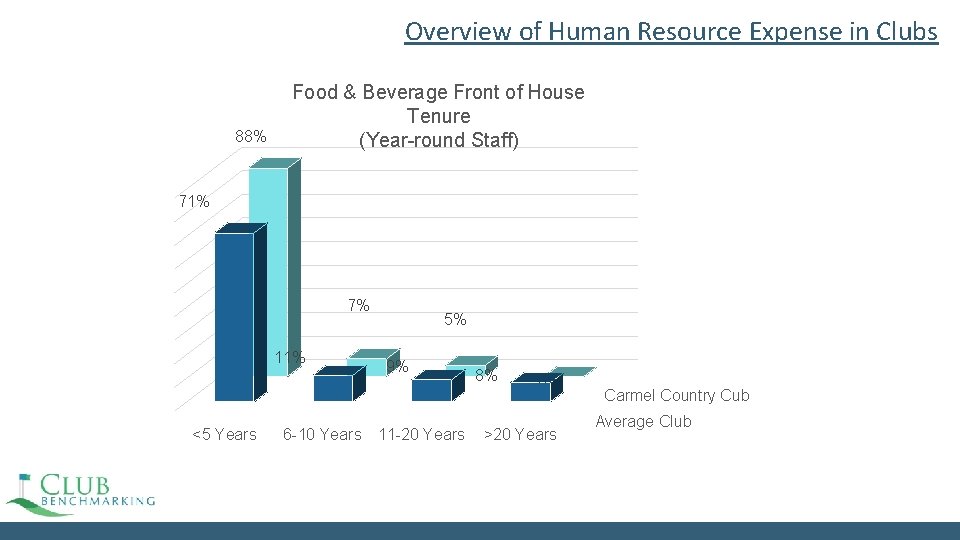
Overview of Human Resource Expense in Clubs 88% Food & Beverage Front of House Tenure (Year-round Staff) 71% 7% 11% <5 Years 6 -10 Years 5% 9% 11 -20 Years 8% 0% >20 Years Carmel Country Cub Average Club
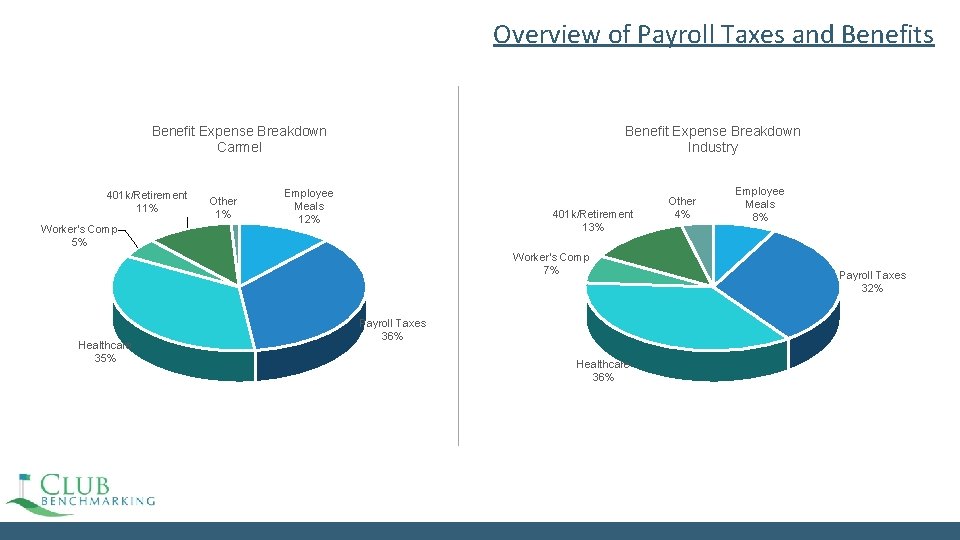
Overview of Payroll Taxes and Benefits Benefit Expense Breakdown Carmel 401 k/Retirement 11% Worker's Comp 5% Other 1% Benefit Expense Breakdown Industry Employee Meals 12% 401 k/Retirement 13% Worker's Comp 7% Healthcare 35% Payroll Taxes 36% Healthcare 36% Other 4% Employee Meals 8% Payroll Taxes 32%
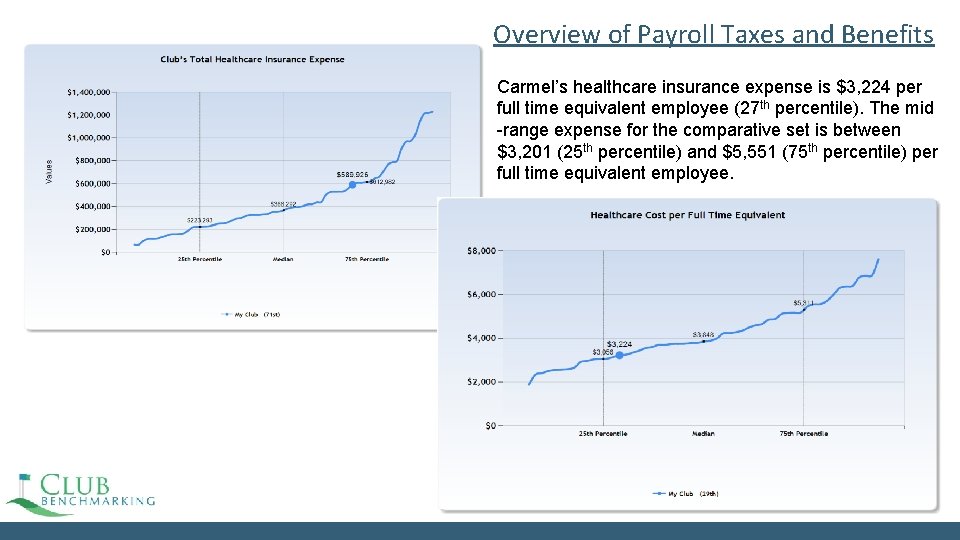
Overview of Payroll Taxes and Benefits Carmel’s healthcare insurance expense is $3, 224 per full time equivalent employee (27 th percentile). The mid -range expense for the comparative set is between $3, 201 (25 th percentile) and $5, 551 (75 th percentile) per full time equivalent employee.
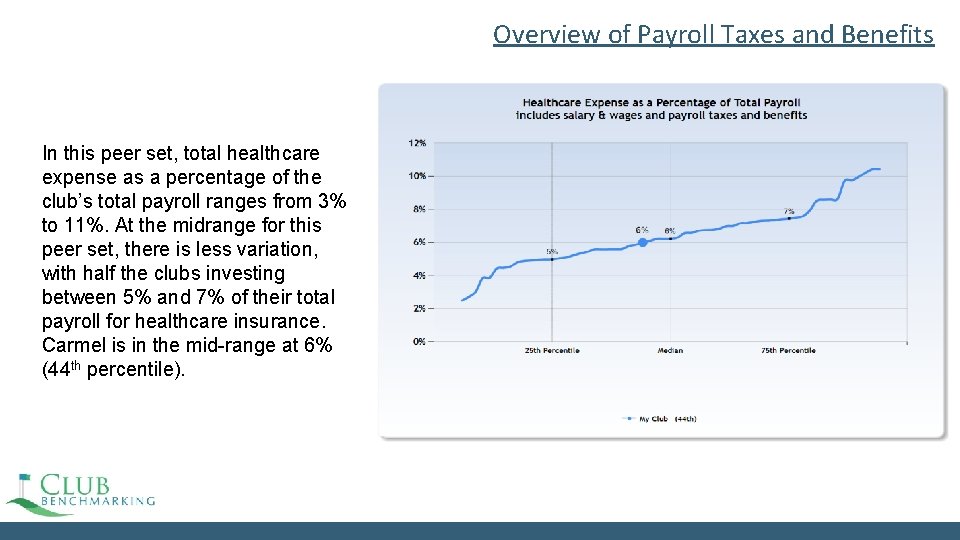
Overview of Payroll Taxes and Benefits In this peer set, total healthcare expense as a percentage of the club’s total payroll ranges from 3% to 11%. At the midrange for this peer set, there is less variation, with half the clubs investing between 5% and 7% of their total payroll for healthcare insurance. Carmel is in the mid-range at 6% (44 th percentile).
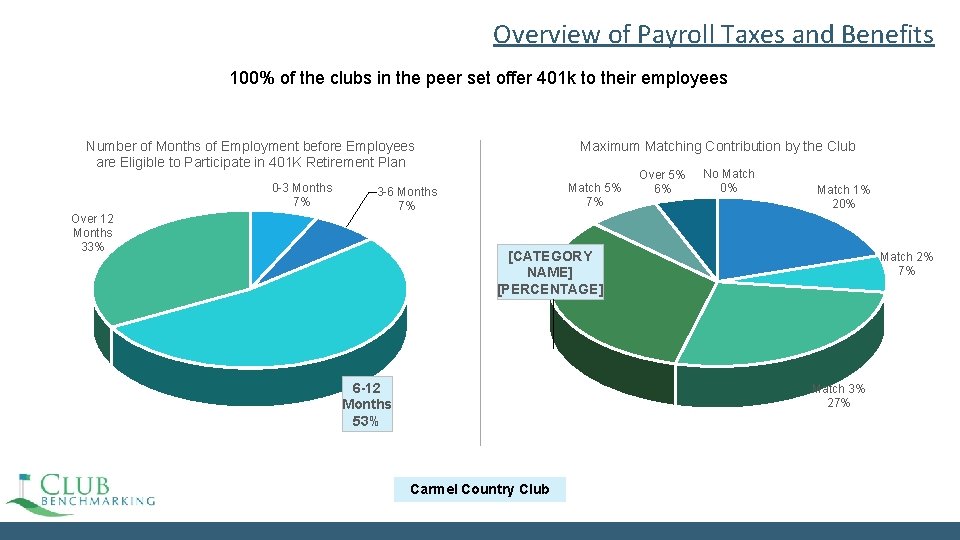
Overview of Payroll Taxes and Benefits 100% of the clubs in the peer set offer 401 k to their employees Number of Months of Employment before Employees are Eligible to Participate in 401 K Retirement Plan 0 -3 Months 7% Over 12 Months 33% Maximum Matching Contribution by the Club Match 5% 7% 3 -6 Months 7% Over 5% 6% No Match 0% Match 1% 20% [CATEGORY NAME] [PERCENTAGE] 6 -12 Months 53% Match 2% 7% Match 3% 27% Carmel Country Club
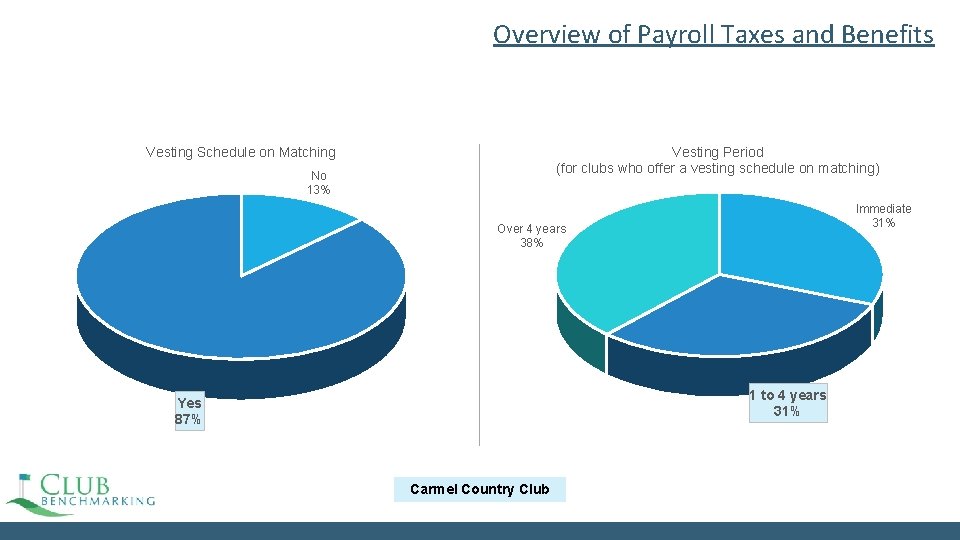
Overview of Payroll Taxes and Benefits Vesting Schedule on Matching Vesting Period (for clubs who offer a vesting schedule on matching) No 13% Immediate 31% Over 4 years 38% 1 to 4 years 31% Yes 87% Carmel Country Club
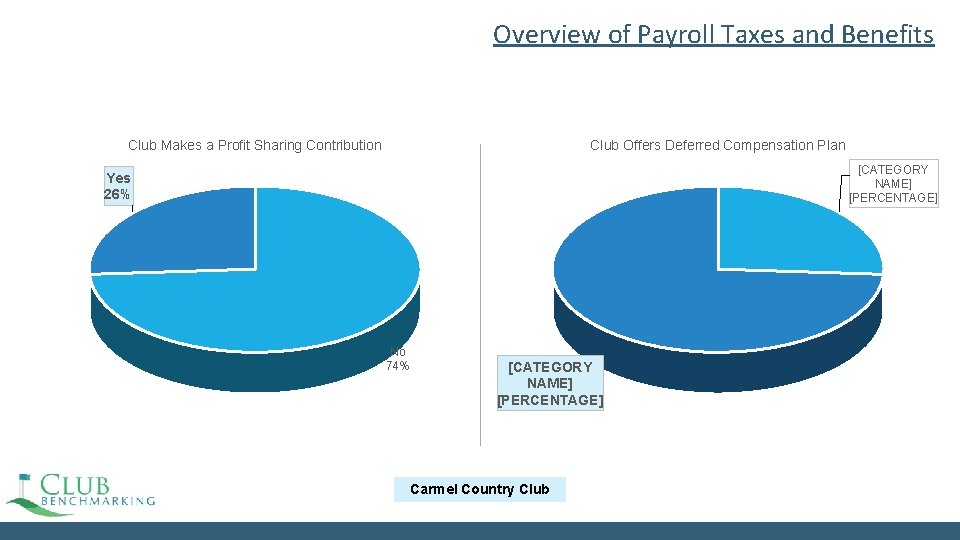
Overview of Payroll Taxes and Benefits Club Makes a Profit Sharing Contribution Club Offers Deferred Compensation Plan [CATEGORY NAME] [PERCENTAGE] Yes 26% No 74% [CATEGORY NAME] [PERCENTAGE] Carmel Country Club
Overview of Payroll Taxes and Benefits Carmel’s Executive Staff Salary & Wages as a Percent of Total Salary & Wages Peer Set’s Executive Staff Salary & Wages as a Percentage of Total Salary & Wages 22% Payroll ratio 53% Payroll ratio 56% 78% Executive Staff • All Staff Executive Staff All Staff The club’s executive team includes: - Head of Club - Head of Finance - Executive Chef - Head of Food & Beverage - Head of Golf - Head of Greens & Grounds - Head of Tennis - Human Resources Director - Membership Director - Head of Fitness - Director of Communication/Marketing
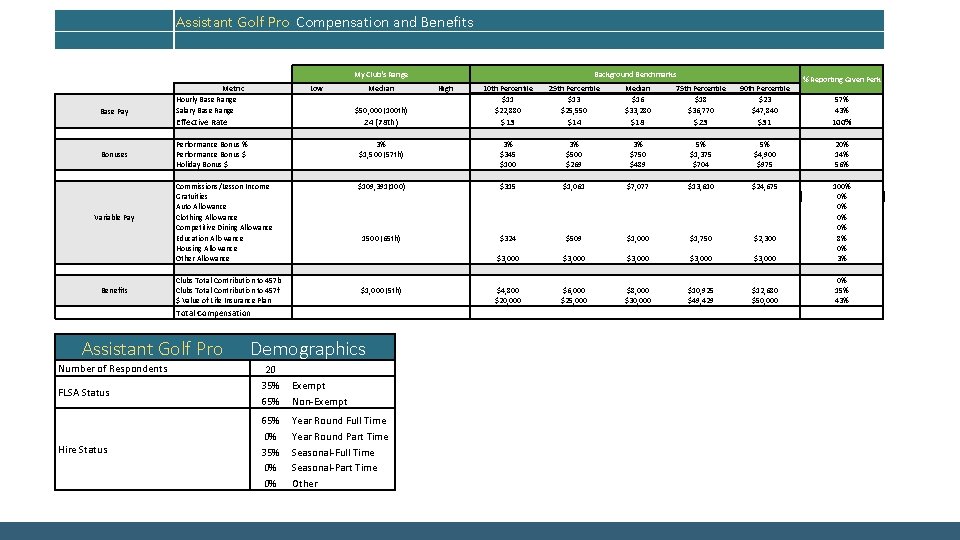
Assistant Golf Pro Compensation and Benefits My Club's Range Base Pay Bonuses Variable Pay Benefits Metric Hourly Base Range Salary Base Range FLSA Status Hire Status % Reporting Given Perk Median $50, 000 (100 th) High 10 th Percentile $11 $22, 880 25 th Percentile $13 $25, 550 Median $16 $33, 280 75 th Percentile $18 $36, 770 90 th Percentile $23 $47, 840 Effective Rate 24 (78 th) $13 $14 $18 $23 $31 100% Performance Bonus $ Holiday Bonus $ Commissions/Lesson Income Gratuities Auto Allowance Clothing Allowance Competitive Dining Allowance Education Allowance Housing Allowance Other Allowance Clubs Total Contribution to 457 b Clubs Total Contribution to 457 f $ Value of Life Insurance Plan 3% $1, 500 (57 th) 3% $345 $100 $315 $324 $3, 000 $4, 800 $20, 000 3% $500 $269 $1, 061 3% $750 $489 $7, 077 5% $1, 375 $704 $13, 610 $509 $1, 000 $1, 750 $1, 000 (5 th) $3, 000 $6, 000 $25, 000 $3, 000 $8, 000 $30, 000 $3, 000 $10, 925 $49, 429 5% $4, 900 $975 $24, 675 $2, 300 $3, 000 $12, 680 $50, 000 20% 14% 56% 100% 0% 0% 8% 0% 3% 0% 15% 43% Total Compensation Assistant Golf Pro Number of Respondents Background Benchmarks Low $109, 391(100) 1500 (65 th) Demographics 20 35% 65% Exempt Non-Exempt 65% 0% 35% 0% 0% Year Round Full Time Year Round Part Time Seasonal-Full Time Seasonal-Part Time Other 57% 43%
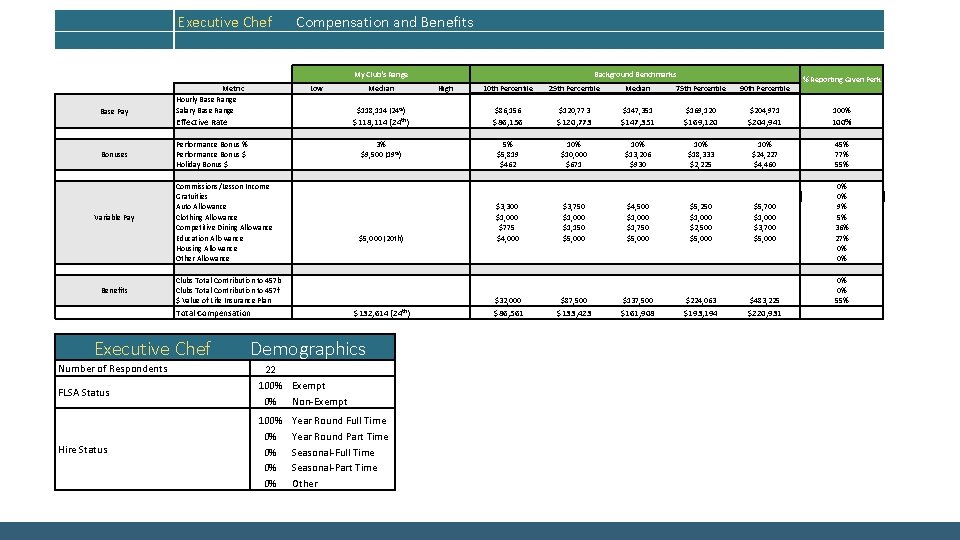
Executive Chef Compensation and Benefits 75 th Percentile 90 th Percentile My Club's Range Base Pay Bonuses Variable Pay Benefits Metric Hourly Base Range Salary Base Range High 10 th Percentile $86, 156 25 th Percentile $120, 773 $147, 351 $169, 120 $204, 971 100% Effective Rate $118, 114 (24 th) $86, 156 $120, 773 $147, 351 $169, 120 $204, 941 100% Performance Bonus $ Holiday Bonus $ Commissions/Lesson Income Gratuities Auto Allowance Clothing Allowance Competitive Dining Allowance Education Allowance Housing Allowance Other Allowance Clubs Total Contribution to 457 b Clubs Total Contribution to 457 f $ Value of Life Insurance Plan 3% $9, 500 (19 th) 5% $5, 819 $462 10% $10, 000 $671 10% $13, 206 $930 10% $18, 333 $2, 225 10% $24, 227 $4, 460 $3, 300 $1, 000 $775 $4, 000 $3, 750 $1, 000 $1, 150 $5, 000 $4, 500 $1, 000 $1, 750 $5, 000 $5, 250 $1, 000 $2, 500 $5, 000 $5, 700 $1, 000 $3, 700 $5, 000 $32, 000 $87, 500 $137, 500 $224, 063 $483, 225 45% 77% 55% 0% 0% 9% 5% 36% 27% 0% 0% 55% Total Compensation $132, 614 (24 th) $86, 561 $133, 423 $161, 908 $193, 194 $220, 931 FLSA Status Hire Status $5, 000 (20 th) Demographics 22 100% Exempt 0% Non-Exempt 100% 0% 0% Year Round Full Time Year Round Part Time Seasonal-Full Time Seasonal-Part Time Other Median % Reporting Given Perk Median $118, 114 (24 th) Executive Chef Number of Respondents Background Benchmarks Low
Individual Hourly Position Benchmarks * 2016 range in peer set of clubs more than $15 million in revenue (20 Clubs)